HelpDesk
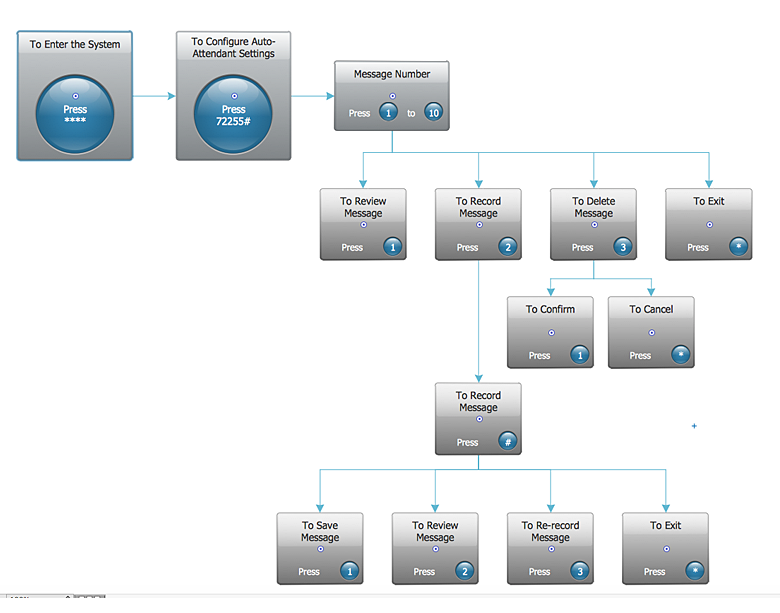
How to Create an Interactive Voice Response (IVR) Diagram in ConceptDraw PRO
Interactive Voice Response (IVR) Diagram is used to create and conduct the Interactive Voice Response systems for call-centers and voice mail services. IVR diagrams intended to visualize the logical and physical structure of Interactive voice response systems. ConceptDraw solution for Interactive Voice Response (IVR) Diagram allows you to create and communicate the Interactive Voice Response diagram of any complexity. Interactive Voice Response (IVR) System is a telecommunication technology that enables a computer to automatically process voice and touch phone signals. IVR systems allows users to interact through a computer with various service systems, available by telephone. The objective of IVR system is to reduce customer service costs by delivering self service to customers and guiding them to the information that they look for.
 Interactive Voice Response Diagrams
Interactive Voice Response Diagrams solution extends ConceptDraw PRO v10 software with samples, templates and libraries of ready-to-use vector stencils that help create Interactive Voice Response (IVR) diagrams illustrating in details a work of interactive voice response system, the IVR system’s logical and physical structure, Voice-over-Internet Protocol (VoIP) diagrams, and Action VoIP diagrams with representing voice actions on them, to visualize how the computers interact with callers through voice recognition and dual-tone multi-frequency signaling (DTMF) keypad inputs.
 Data Flow Diagrams (DFD)
Data Flow Diagrams solution extends ConceptDraw PRO software with templates, samples and libraries of vector stencils for drawing the data flow diagrams (DFD).
This interactive voice response (IVR) diagram sample shows the Scheme of VoIP call with SIM box and gateway. It was designed on the base of the Wikimedia Commons file: Scheme of VoIP call with Sim box.png. [commons.wikimedia.org/ wiki/ File:Scheme_ of_ VoIP_ call_ with_ Sim_ box.png]
This file is licensed under the Creative Commons Attribution-Share Alike 4.0 International license. [creativecommons.org/ licenses/ by-sa/ 4.0/ deed.en]
"A SIM box (also called a SIM bank) is device used as part of a VoIP gateway installation. It contains a number of SIM cards, which are linked to the gateway but housed and stored separately from it. A SIM box can have SIM cards of different mobile operators installed, permitting it to operate with several GSM gateways located in different places." [SIM box. Wikipedia]
The IVR diagram example "VoIP call with SIM box and gateway" was designed using ConceptDraw PRO diagramming and vector drawing software extended with the Interactive Voice Response Diagrams solution from the Computer and Networks area of ConceptDraw Solution Park.
 Audit Flowcharts
Audit flowcharts solution extends ConceptDraw PRO software with templates, samples and library of vector stencils for drawing the audit and fiscal flow charts.
HelpDesk
How to Use ConceptDraw Sales Dashboard Solution
The interactive visual dashboard is a valuable tool for any sales team. Sales dashboard allows you to view and monitor sales indicators that are important for manager and sales staff . It helps to use the timely and reliable information to improve the quality of sales performance and increase sales revenues. ConceptDraw Sales Dashboard solution is a tool for both: sales manager and sales team. It provides the visualization of key performance indicators that are critical to the entire sales organization. The custom sales dashboard displays the real-time information on sales performance KPIs with the help of intuitive and easy-to-understand diagrams and charts. Sales Dashboard helps the entire team see where they are, and what needs to be done. With ConceptDraw PRO you can easily create a visual Sales Dashboard using Live Objects Technology.
- What is Interactive Flowcharts | Create Response Charts | How to ...
- Process Flowchart | Interactive Voice Response Diagrams ...
- Customer Service System Flowchart
- IVR flowchart - Store reporting | Interactive Voice Response ...
- Example Of Interactive System
- IVR flowchart - Store reporting | How to Create an Interactive Voice ...
- Interactive Voice Response Diagrams | How to Create an Interactive ...
- Entity-Relationship Diagram (ERD) | Interactive Voice Response ...
- What is Interactive Flowcharts | How to Create a Sales Dashboard ...
- Process Flowchart | Interactive Voice Response Diagrams | Data ...
- Sequence Diagram For Multi Banking System
- Interactive Voice Response Diagrams | Telecommunication Network ...
- Entity-Relationship Diagram (ERD) | Interactive Voice Response ...
- Interactive Voice Response Diagrams | UML Diagram | Process ...
- Process Flowchart | Interactive Voice Response Diagrams ...
- Copying Service Process Flowchart . Flowchart Examples | Sales ...
- Process Flowchart | Interactive Voice Response Diagrams | Entity ...
- IVR flowchart
- IVR customer service hotline diagram | Interactive Voice Response ...
- System Flow Chart Example Of Banking System


