When To Use a Fishbone Diagram
Fishbone diagrams work for most entrepreneurs and almost any industry or person having a problem. Professional diagramming software may help you create Fishbone (Cause and Effect or Ishikawa) diagrams. When people are unclear about what is causing an issue, ConceptDraw PRO will be your lifesaver. When to use a Fishbone diagram? Originally developed as a quality control tool, you may find a Fishbone diagram helpful when used in many cases, such as to analyze a complex problem when there are many causes, for identifying all possible root causes for an effect or a problem, when you need different point of view to look on a problem, to uncover bottlenecks and identify where and why a process doesn't work, for acceleration a process when traditional ways of problem solving consume many time.Technology Blog
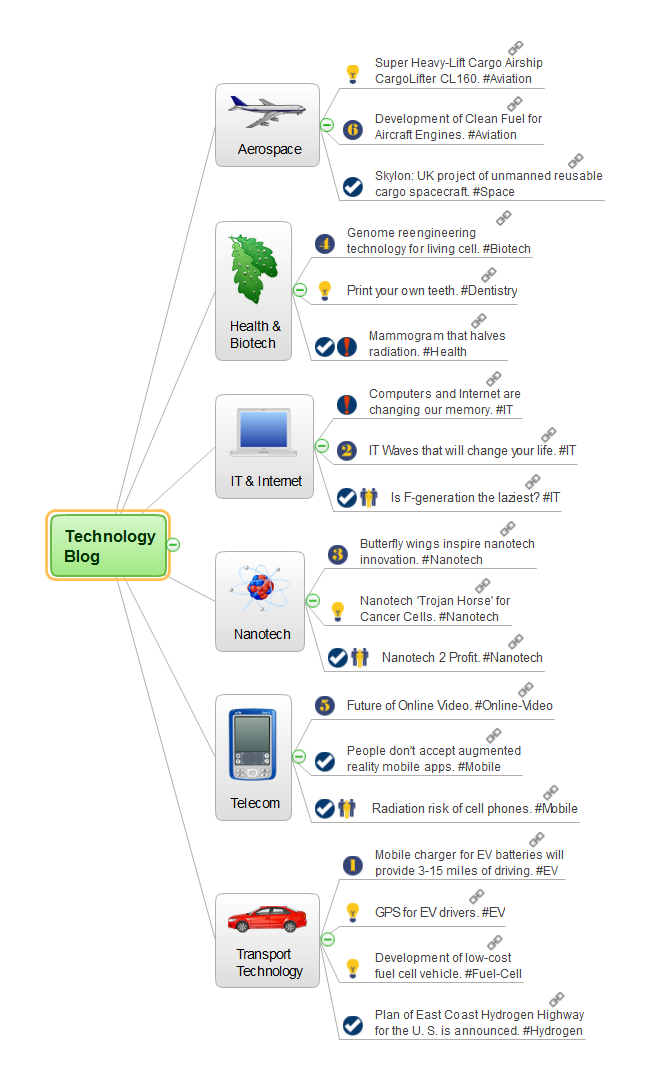
Twitter is a popular social networking service where the users post, share and openly interact with short messages "tweets". The ConceptDraw MINDMAP and MindTweet solution from the ConceptDraw Solution Park supply the Twitter users with excellent mind mapping tools, which boost the value of tweets, give the ability to brainstorm, review, formulate thrilling tweets, to send and organize tweet ideas. You can easy estimate tweets, mark them with icons or priorities, to structure visually the tweets by categories and add notes for a future. You have the access to useful tools allowing to consider tweet map with colleagues, to use the impressive dynamic presentation from the tweets already sent and that are going to send, to discuss conveniently ideas for future tweets, key words and quickly get team conclusion about the whole tweet plan. ConceptDraw MINDMAP software perfectly suits for mindmapping and creating consistent tweet story. This Mind Map designed in ConceptDraw MINDMAP organizes the blog posts that cover a variety of topics for a technology blog.Flowchart Definition
Flowchart definition - A Flowchart is a diagram that graphically represents the structure of the system, the flow of steps in a process, algorithm, or the sequence of steps and decisions for execution a process or solution a problem. For depiction the steps there are used specific shapes and graphic symbols which are linked by lines and directional arrows. The main standard shapes are rectangle or box, rounded box, diamond, circle. A Flowchart is a convenient way to observe the follow the process from beginning to end, it lets improve the work of process, highlight the key elements and detach not essential or even excessive steps. The Flowcharts can represent different levels of detail: High-Level Flowchart, Detailed Flowchart, and Deployment or Matrix Flowchart. They are incredibly useful for programmers when developing the programs of any complexity and on any high level language. Create your own Flowcharts using the ConceptDraw PRO diagramming and vector drawing software and powerful tools of Flowcharts solution from "Diagrams" area.Leadership Training Influence
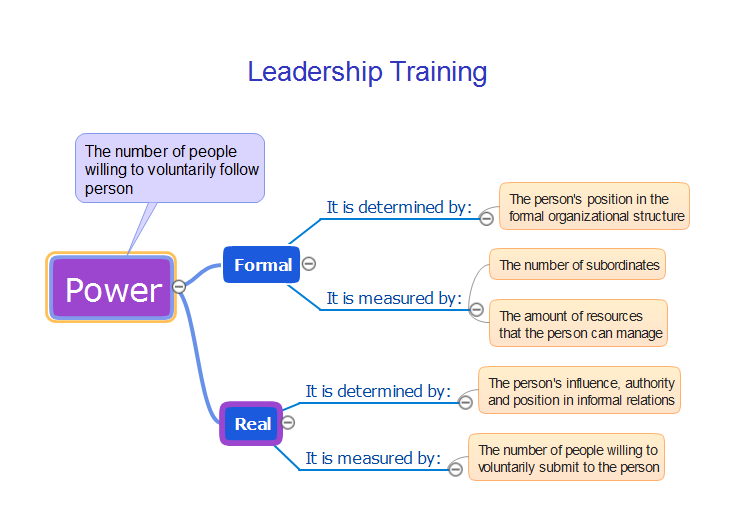
The modern organizations are interested in the professional growth of their employees at all levels and one of the most important tasks is the training of managers' reserve in organization. The system of preparation of managers' reserve involves solving of three problems: detection of organization's staff which have potential for leadership; training those staff for work in leadership positions; ensuring of slow replacement of vacant position and approving on it new employee. For successful managing of one or another team or group of employees, first of all the leader requires professional training, that includes development of professionally important qualities for successful execution of management activities and special learning to gain the necessary complex of knowledge, abilities and skills. The leader must have knowledge associated with specifics of a given collective and general knowledge, including the management theory, knowledge in the field of economics as well as psychology. Within a leadership training is also taken into account the practical experience of employee. This Mind Map created in ConceptDraw MINDMAP shows how the maps can be used to represent the training content to others and illustrates the leadership training.UML Collaboration Diagram (UML2.0)
UML Collaboration Diagram depicts the interactions between objects or parts in terms of sequenced messages and describes both the static structure and dynamic behavior of a system. Rapid UML solution provides templates, examples and libraries of stencils for quick and easy drawing all the types of system and software engineering diagrams according to UML 2.4 and 1.2 notations.
Process Flowchart
The main reason of using Process Flowchart or PFD is to show relations between major parts of the system. Process Flowcharts are used in process engineering and chemical industry where there is a requirement of depicting relationships between major components only and not include minor parts. Process Flowcharts for single unit or multiple units differ in their structure and implementation. ConceptDraw PRO is Professional business process mapping software for making Process flowcharts, Process flow diagram, Workflow diagram, flowcharts and technical illustrations for business documents and also comprehensive visio for mac application. Easier define and document basic work and data flows, financial, production and quality management processes to increase efficiency of your business with ConcepDraw PRO. Business process mapping software with Flowchart Maker ConceptDraw PRO includes extensive drawing tools, rich examples and templates, process flowchart symbols and shape libraries, smart connectors that allow you create the flowcharts of complex processes, process flow diagrams, procedures and information exchange. Process Flowchart Solution is project management workflow tools which is part ConceptDraw Project marketing project management software. Drawing charts, diagrams, and network layouts has long been the monopoly of Microsoft Visio, making Mac users to struggle when needing such visio alternative like visio for mac, it requires only to view features, make a minor edit to, or print a diagram or chart. Thankfully to MS Visio alternative like ConceptDraw PRO software, this is cross-platform charting and business process management tool, now visio alternative for making sort of visio diagram is not a problem anymore however many people still name it business process visio tools.
Types of Flowcharts
A Flowchart is a graphical representation of process, algorithm, workflow or step-by-step solution of the problem. It shows the steps as boxes of various kinds and connects them by arrows in a defined order depicting a flow. There are twelve main Flowchart types: Basic Flowchart, Business Process Modeling Diagram (BPMN), Cross Functional Flowchart, Data Flow Diagram (DFD), IDEF (Integrated DEFinition) Flowchart, Event-driven Process Chain (EPC) Diagram, Influence Diagram (ID), Swimlane Flowchart, Process Flow Diagram (PFD), Specification and Description Language (SDL) Diagram, Value Stream Mapping, Workflow Diagram. Using the Flowcharts solution from the Diagrams area of ConceptDraw Solution Park you can easy and quickly design a Flowchart of any of these types. This solution offers a lot of special predesigned vector symbols for each of these widely used notations. They will make the drawing process of Flowcharts much easier than ever. Pay also attention for the included collection of ready Flowchart examples, samples and quick-start templates. This is business process improvement tools. If you are looking for MS Visio for your Mac, then you are out of luck, because it hasn't been released yet. However, you can use Visio alternatives that can successfully replace its functions. ConceptDraw PRO is an alternative to MS Visio for Mac that provides powerful features and intuitive user interface for the same.
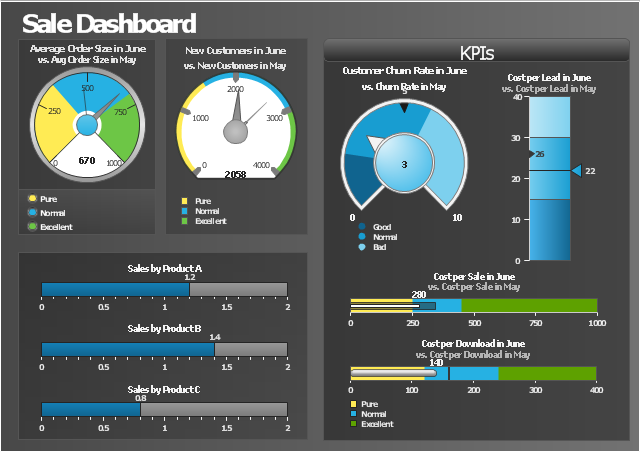
This sale dashboard example contains KPIs and sales effectiveness metrics visual indicators: speedometer gauge, dial, slider, level meter and bullet indicators.
"Sales effectiveness refers to the ability of a company’s sales professionals to “win” at each stage of the customer’s buying process, and ultimately earn the business on the right terms and in the right timeframe.
Improving sales effectiveness is not just a sales function issue; it’s a company issue, as it requires deep collaboration between sales and marketing to understand what’s working and not working, and continuous improvement of the knowledge, messages, skills, and strategies that sales people apply as they work sales opportunities.
Sales effectiveness has historically been used to describe a category of technologies and consulting services aimed at helping companies improve their sales results.
Many companies are creating sales effectiveness functions and have even given people titles such as VP of Sales Effectiveness." [Sales effectiveness. Wikipedia]
The example "Sales metrics and KPIs" was created using the ConceptDraw PRO diagramming and vector drawing software extended with the Meter Dashboard solution from the area "What is a Dashboard" of ConceptDraw Solution Park.
IDEF4 Standard
Use Case Diagrams technology. IDEF4 standard implies not only graphical presentation but the additional information about diagrams of heredity, methods systematization and types which are contained in specifications.- Hiring process workflow | Collaboration in a Project Team | Pdf Work ...
- Logo Png Motivation
- Project Management Collaboration Software
- Diagram And Flow Chart Of Organization Development Skills
- Circular diagrams - Vector stencils library | Collaboration life-cycle ...
- Collaboration in a Project Team | How To Implement Collaborative ...
- Scrum process work items and workflow | Scrum | How to Create a ...
- Design elements - Scrum people | Design elements - Project ...
- Fault Tree Analysis Diagrams | Root cause analysis tree diagram ...


