EPC Diagrams Illustrate Business Process Work Flows
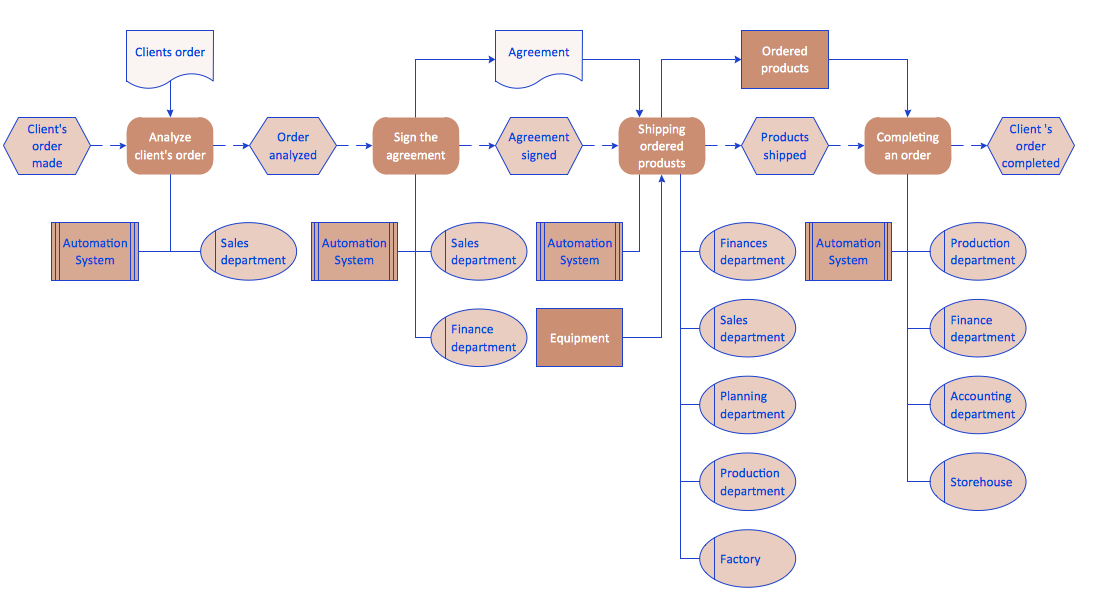
The Event-driven Process Chain ( EPC ) Diagrams allows users present business process models in terms of work flows. The EPC diagram can show various ways for improvement throughout an organisation.ConceptDraw Arrows10 Technology
When you are connecting existing objects you can control the diagram structure by changing selection order. This is how diagramming software should work. You are able to draw a diagram as quickly as the ideas come to you.Collaboration in a Project Team
Create with our data flow diagram software perfect data flow diagrams. Download data flow diagram software for FREE. Use hundreds of data flow diagram examples.Value stream with ConceptDraw DIAGRAM
The Value stream is a totality of all actions on the projection, order composition and production: starting from creation a product project to launching this product, from order to delivery, from extraction of raw materials to ready product manufacturing. Value stream mapping is a process of visualization of these actions and creation of a detailed and graphical map.How to Create a Cross Functional Flow Chart
If neither of 45 vector shapes of the Cross-Functional Flowcharts solution don't fit your needs, you will want to learn How to create a unique Cross-Functional flowchart. ConceptDraw Arrows10 Technology - This is more than enough versatility to draw any type of diagram with any degree of complexity. Drawing software lets you to make horizontal and vertical, audit, opportunity and many more flowcharts.Create Response Charts
Visual navigation through the stages of a response process helps you locate specific actions to be taken via Action Mind Maps. Use ConceptDraw DIAGRAM and ConceptDraw MINDMAP for organize the process of response for interactions occurring in social media.Quality visualization in your company
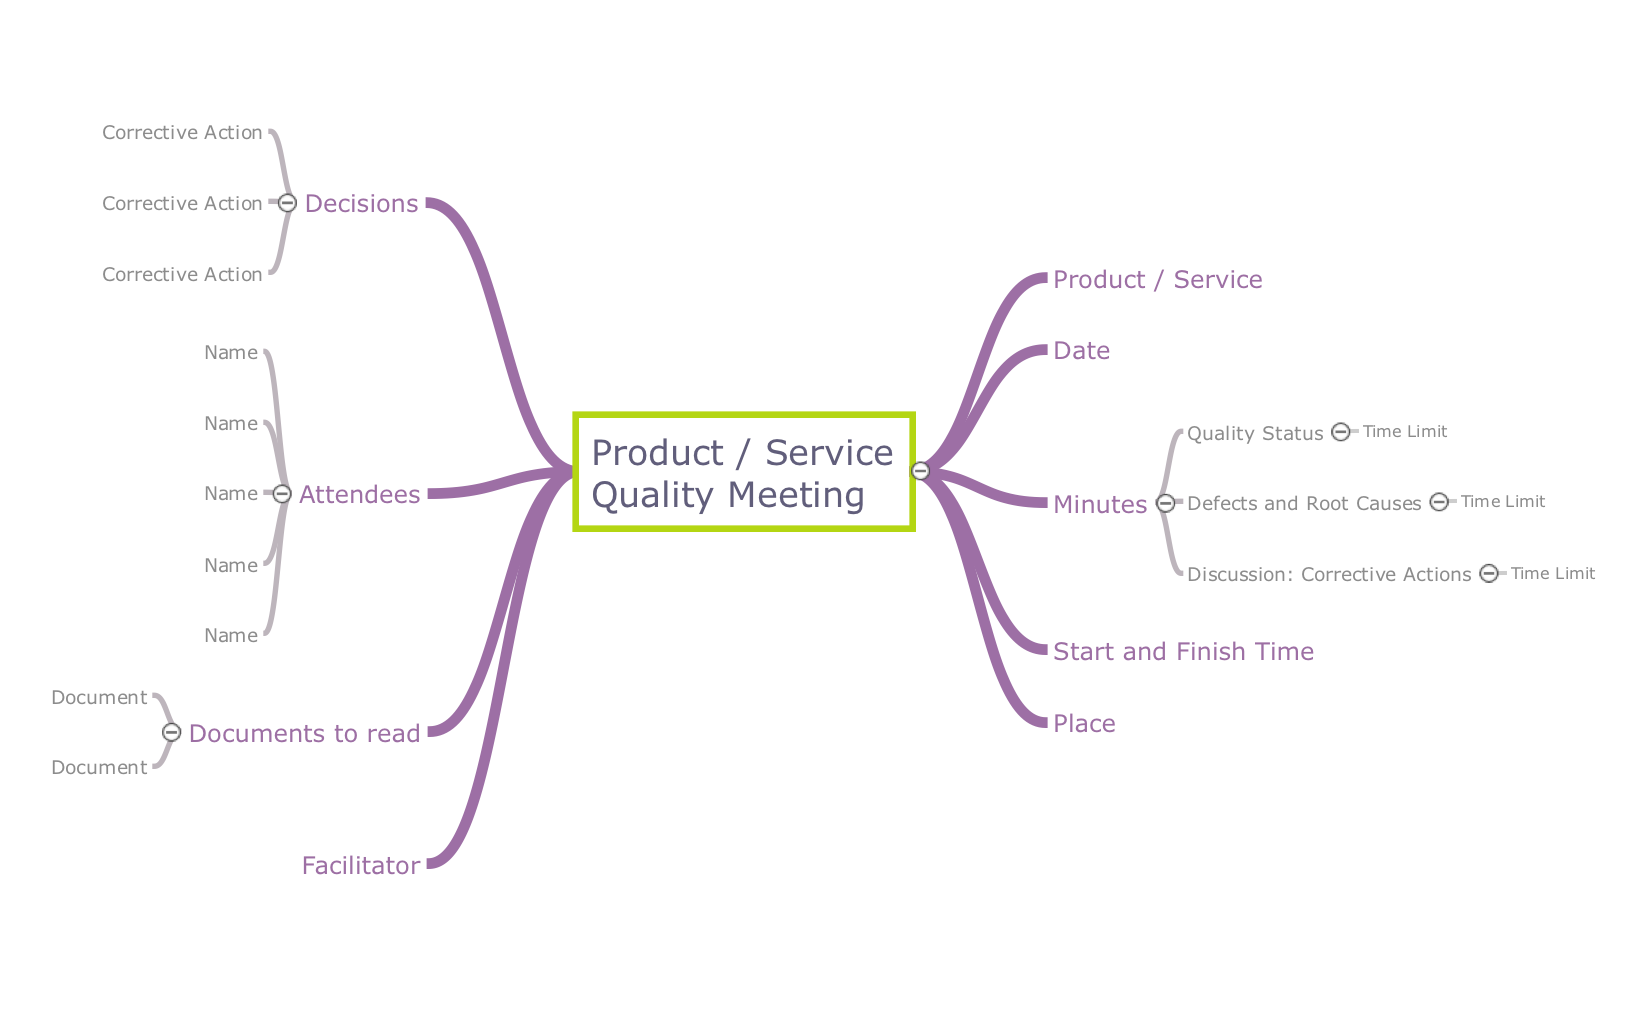
Using ConceptDraw quality mind maps is a perfect addition to quality visualization in your company.Organizational Charts with ConceptDraw DIAGRAM
Organizational chart or Orgchart is a diagram that depicts the structure of an organization using the terms of work responsibility and rank position. It is a useful and convenient format to visually illustrate the relationships within an organization, which is moreover applicable for organization of any size. Typically, an Organizational chart is constructed from the rectangular object blocks, which represent a job title, a person's name and relationships associated with them. You looks for the powerful Orgchart software? ConceptDraw DIAGRAM software is exactly what you've been searching long. Extended with Organizational Charts Solution, ConceptDraw DIAGRAM offers great-looking examples and samples of Orgcharts, built-in templates and various types of predesigned vector block objects and connectors for creation all kinds of Organizational Charts - from simple to complex multi-page. When designing the chart for large organization with complex branched structure, may be convenient to divide it into few smaller charts.Yourdon and Coad Diagram
The vector stencils library Yourdon and Coad Notation from the solution OOAD contains specific symbols of the Yourdon and Coad notation such as data store symbol, data process symbol, loop symbol for ConceptDraw DIAGRAM diagramming and vector drawing software. The OOAD solution is contained in the Software Development area of ConceptDraw Solution Park.How to Connect Social Media DFD Flowchart with Action Maps
The Social Media Response solution creates interactive social media flow charts and action mind maps. The solution includes a video tutorial and a number of samples helping social media teams refine and organize their response process.GUI Prototyping with ConceptDraw DIAGRAM
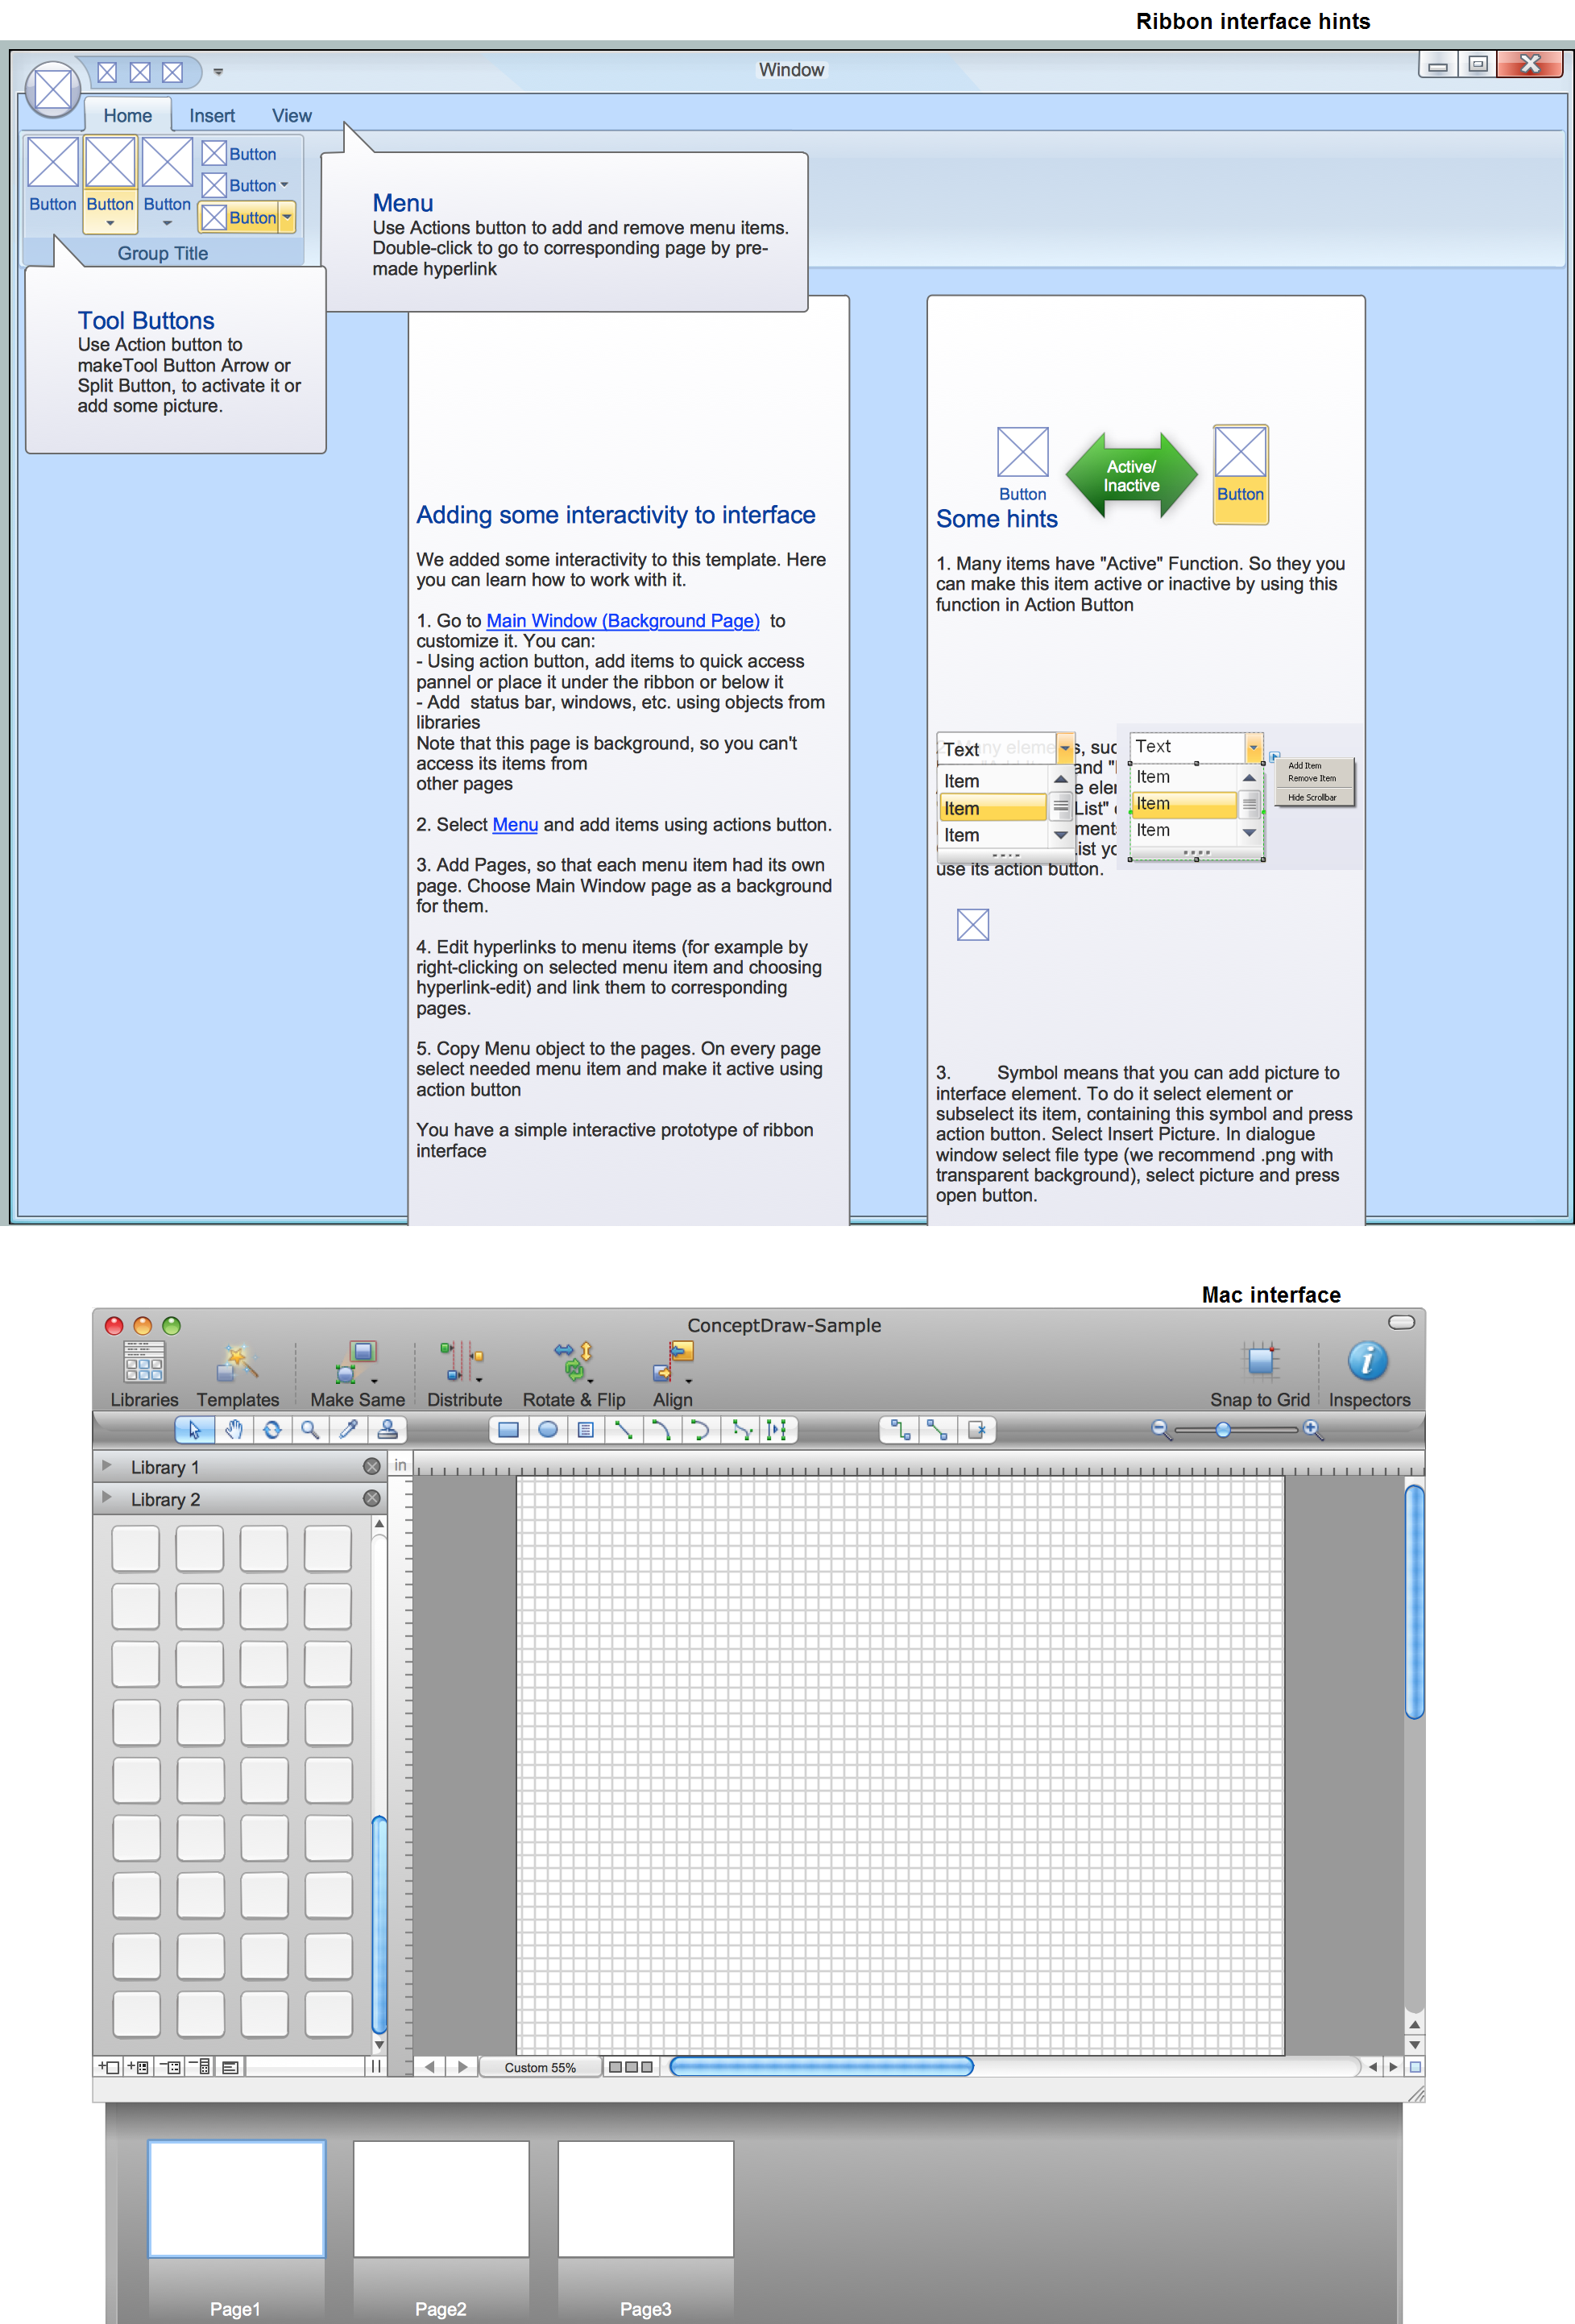
All about prototyping. GUI Prototyping with ConceptDraw. Download prototyping software.- Business Process Modeling Tools | Workflow Process Example ...
- Cross-Functional Flowcharts | Opportunity flowchart - Order ...
- Process Flowchart | Work Flow Diagrams with ConceptDraw PRO ...
- Opportunity flowchart template | Opportunity flowchart - Order ...
- Cross-Functional Flowcharts | Event-driven Process Chain ...
- EPC Diagrams Illustrate Business Process Work Flows | EPC ...
- Business Process Diagram | Business Process Modeling Tools ...
- Best Program to Make Flow Chart Diagrams | How to Create a Cross ...
- Business Process Mapping How to Map a Work Process | Work ...
- Business Process Mapping How to Map a Work Process ...
- Event-driven Process Chain Diagrams EPC | EPC Diagrams ...
- Work Flow Process Chart
- Swim Lane Diagrams | Business Process Mapping How to Map a ...
- Types of Flowchart - Overview | Value stream with ConceptDraw ...
- Business Process Mapping How to Map a Work Process | Cross ...
- ConceptDraw Arrows10 Technology | Simple & Fast Diagram ...
- Work Flow Process Chart | Flow Diagram Software | Business ...
- Work Flow Process Chart | Workflow Diagram Software Mac ...
- Value Stream Mapping | Value stream with ConceptDraw PRO ...
- Workflow Diagrams | Workflow Diagram Software Mac | Work Flow ...


