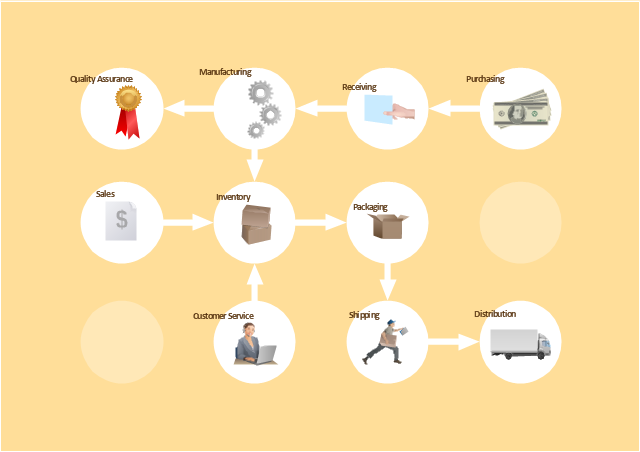
The vector stencils library "Workflow diagrams" contains 54 symbol icons of workflow diagrams.
Use these clipart to represent information flow, automation of business processes, business process re-engineering, accounting, management, and human resources tasks in industry, business, and manufacturing.
"The term workflow is more commonly used in particular industries, such as printing and professional domains, where it may have particular specialized meanings.
(1) Processes: A process is a more general notion than workflow and can apply to physical or biological processes, for instance; whereas a workflow is typically a process or collection of processes described in the context of work, such as all processes occurring in a machine shop.
(2) Planning and scheduling: A plan is a description of the logically necessary, partially ordered set of activities required to accomplish a specific goal given certain starting conditions. A plan, when augmented with a schedule and resource allocation calculations, completely defines a particular instance of systematic processing in pursuit of a goal. A workflow may be viewed as an (often optimal or near-optimal) realization of the mechanisms required to execute the same plan repeatedly.
(3) Flow control is a control concept applied to workflows, to distinguish from static control of buffers of material or orders, to mean a more dynamic control of flow speed and flow volumes in motion and in process. Such orientation to dynamic aspects is the basic foundation to prepare for more advanced job shop controls, such as just-in-time or just-in-sequence.
(4) In-transit visibility is a monitoring concept that applies to transported material as well as to work in process or work in progress, i.e., workflows." [Workflow. Wikipedia]
The example "Workflow diagram - Business" was drawn using the ConceptDraw PRO diagramming and vector drawing software extended with the Workflow Diagrams solution from the Business Processes area of ConceptDraw Solution Park.
HelpDesk
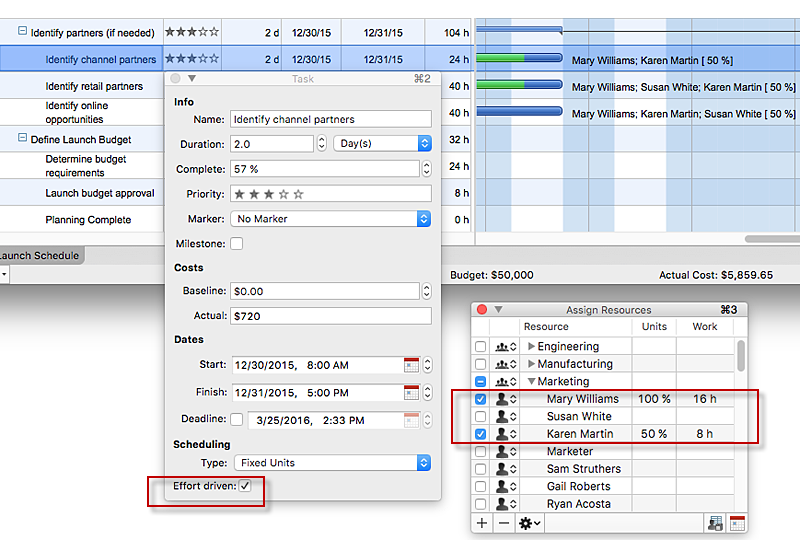
How to Use the Effort-Driven Scheduling Method
Effort-driven scheduling is the default method of project scheduling in ConceptDraw PROJECT.Gantt charts for planning and scheduling projects
ConceptDraw PROJECT is an excellent simple project scheduling software. It maintain classic project gantt charts and the line of professional reports on resources usage. It include handy critical path scheduling software tools and diagraming tools which helps prepare the presentation of project status. It include project tracking dashboard to keep project metrics upto date, also it have handy feature to export project management dashboard in excel file.HelpDesk
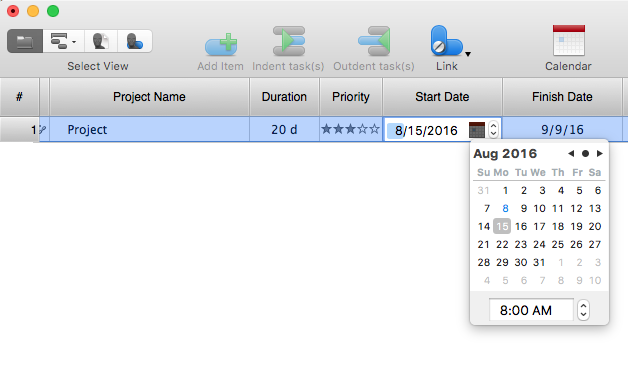
How to Operate with Project Time Frames in ConceptDraw PROJECT
ConceptDraw PROJECT applies an advanced scheduling facilities to enable you arrange your project's tasks with existing human and material resources. Comprehension of project scheduling principle allows you to plan the project the best way to execute it. Sometimes user is wondering why the task is moved to a different time than he supposed. Or he may be confused when a task's tardiness provoke the unwanted shift of other tasks. This article describes how do changes to the Start/Finish dates, or the Duration of the task affect the project schedule, created in ConceptDraw PROJECT.- Workflow Scheduling
- Workitems workflow diagram | How to Use the Effort-Driven ...
- Create Flow Chart on Mac | Workflow Diagram Software Mac ...
- Workflow Diagram | Workflow Diagram Software | Flowchart ...
- Workflow Diagram | Workflow Diagram Software | Work Flow ...
- Project Workflow Software
- Workflow Diagram Software Mac | How to Draw a Good Diagram of ...
- Workflow Diagram Software Mac | Workflow Diagram Examples ...
- Project —Task Trees and Dependencies | Software Work Flow ...
- ConceptDraw Solution Park | Workflow Diagram Software Mac ...
- Business Process Management | BPM Software | Workflow Diagram ...
- Best Workflow Software For Mac
- Business - Workflow diagram | How to Draw a Good Diagram of a ...
- What Is Process Diagram In Software Project
- Workflow Diagram Template | Workflow Diagram | Workflow ...
- How to Use Critical Path Analysis for Scheduling Complex Projects
- Process Flowchart | Software Work Flow Process in Project ...
- Workflow Diagram Software Mac | Create Flow Chart on Mac ...
- Scheduling Software Free
- Project — Assigning Resources | Software Work Flow Process in ...


