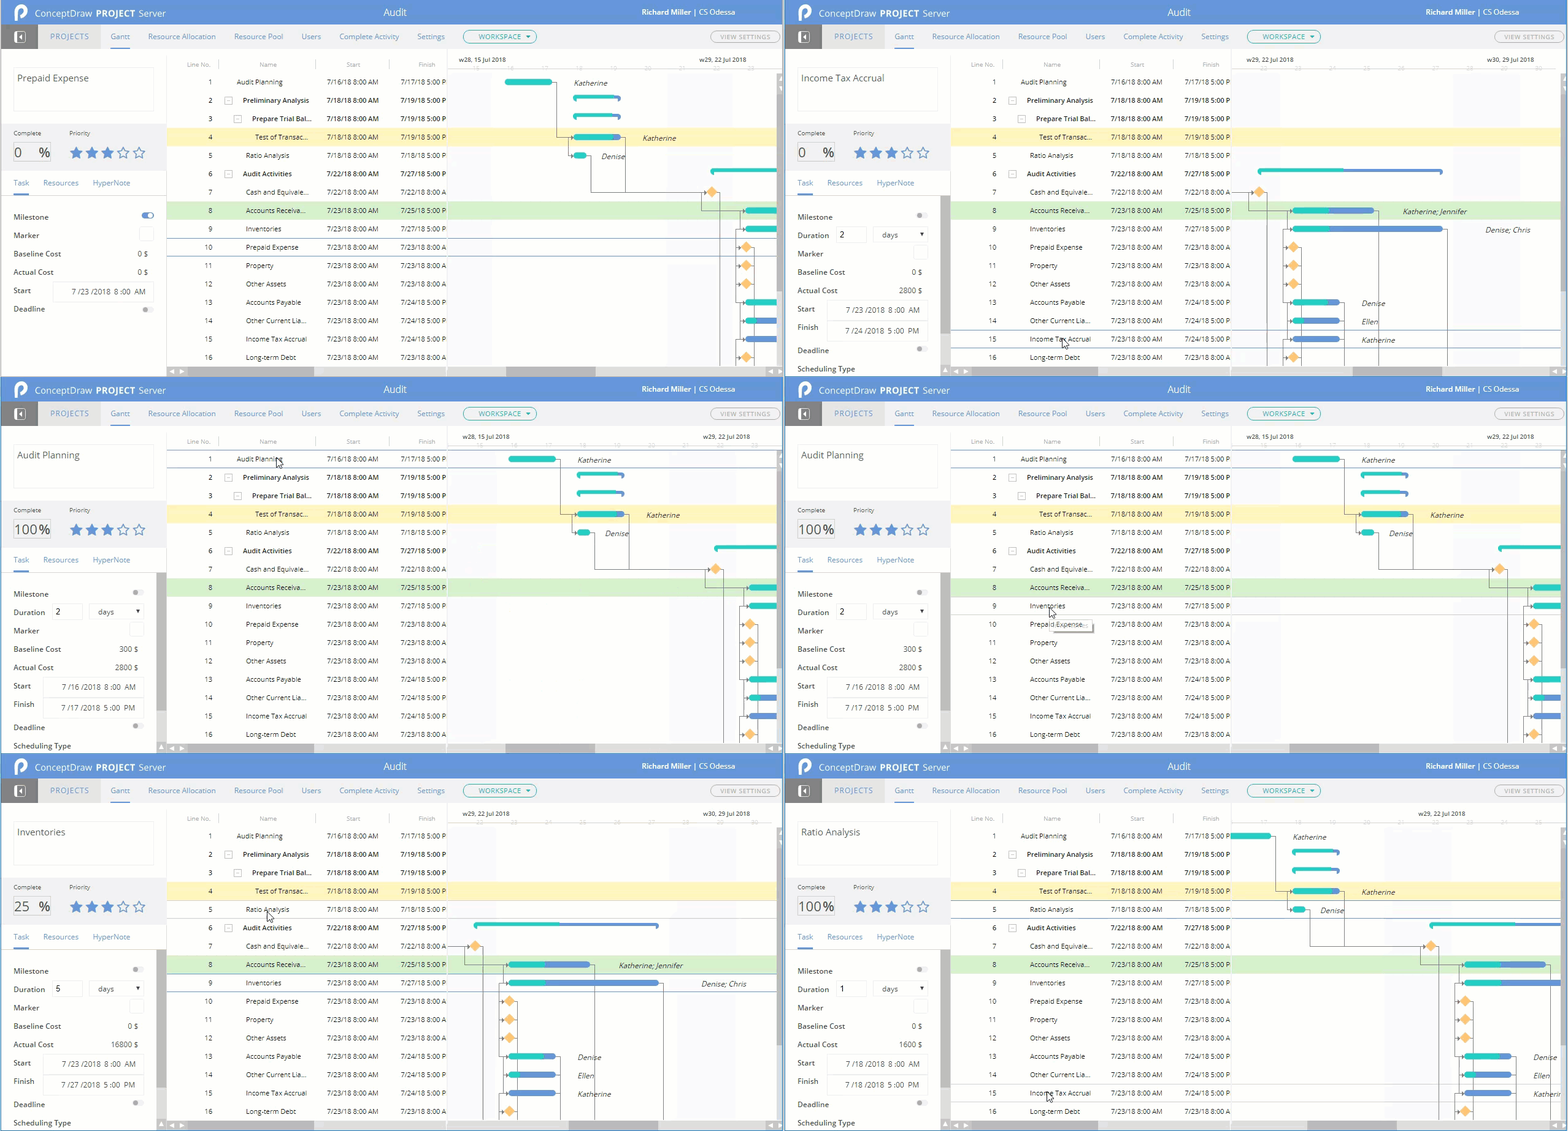
How to Change the Timescale in a Gantt Chart View
Some pages, such as the Gantt Chart view and the Resource usage views, have a timescale that appears above the chart. You can customize the timescale of ConceptDraw PROJECT Server workspace to meet your needs. You can change the timescale to show smaller or greater units. For example, you may need to display time in quarters of the year, or you may need to show Gantt chart across months and days.
- Open ConceptDraw PROJECT Server. The Projects page will be opened by default.
- Select the workspace and click the desired project tile. The selected project will be opened in the Gantt chart view.
- Click the VIEW SETTINGS button and use the TIME SCALE tool to set the desired timescale units.
The “Week-Day” is a default time scale. Available scales are: “Years-Half Years”, “Years-Quarters”, “Quarters-Months”, “Months-Weeks”, “Months-Day”, “Week-Day”, “Day-6 Hours”, “Day-2 Hours”.

- The time scale changes will be saved automatically for the particular project.
- When selecting any item on the project schedule (task, phase, or milestone) — the required piece of Gantt chart will be automatically scrolled on a time scale.

|
How it works:
- Upload up to 100 project easily
- Simple tracking of multiple projects status
- Effective collaboration with project team
- View and analyze project implementation online
ConceptDraw OFFICE:
- Business diagramming on Mac OS® and Windows®
- Compatibility with MS Visio®
- Live Objects technology
- Compatibility with MindJet MindManager®
- Import/Export data from MS Project®
- Integration with Twitter®
- Collaboration via Evernote®
- Compatibility with MS Project®
- Import/Export data from MS Excel®
- Import/Export data from MindJet MindManager®
- Manage multiple projects from a single file
|