 Entity Relationship Diagram ( ERD ) Solution. ConceptDraw.com
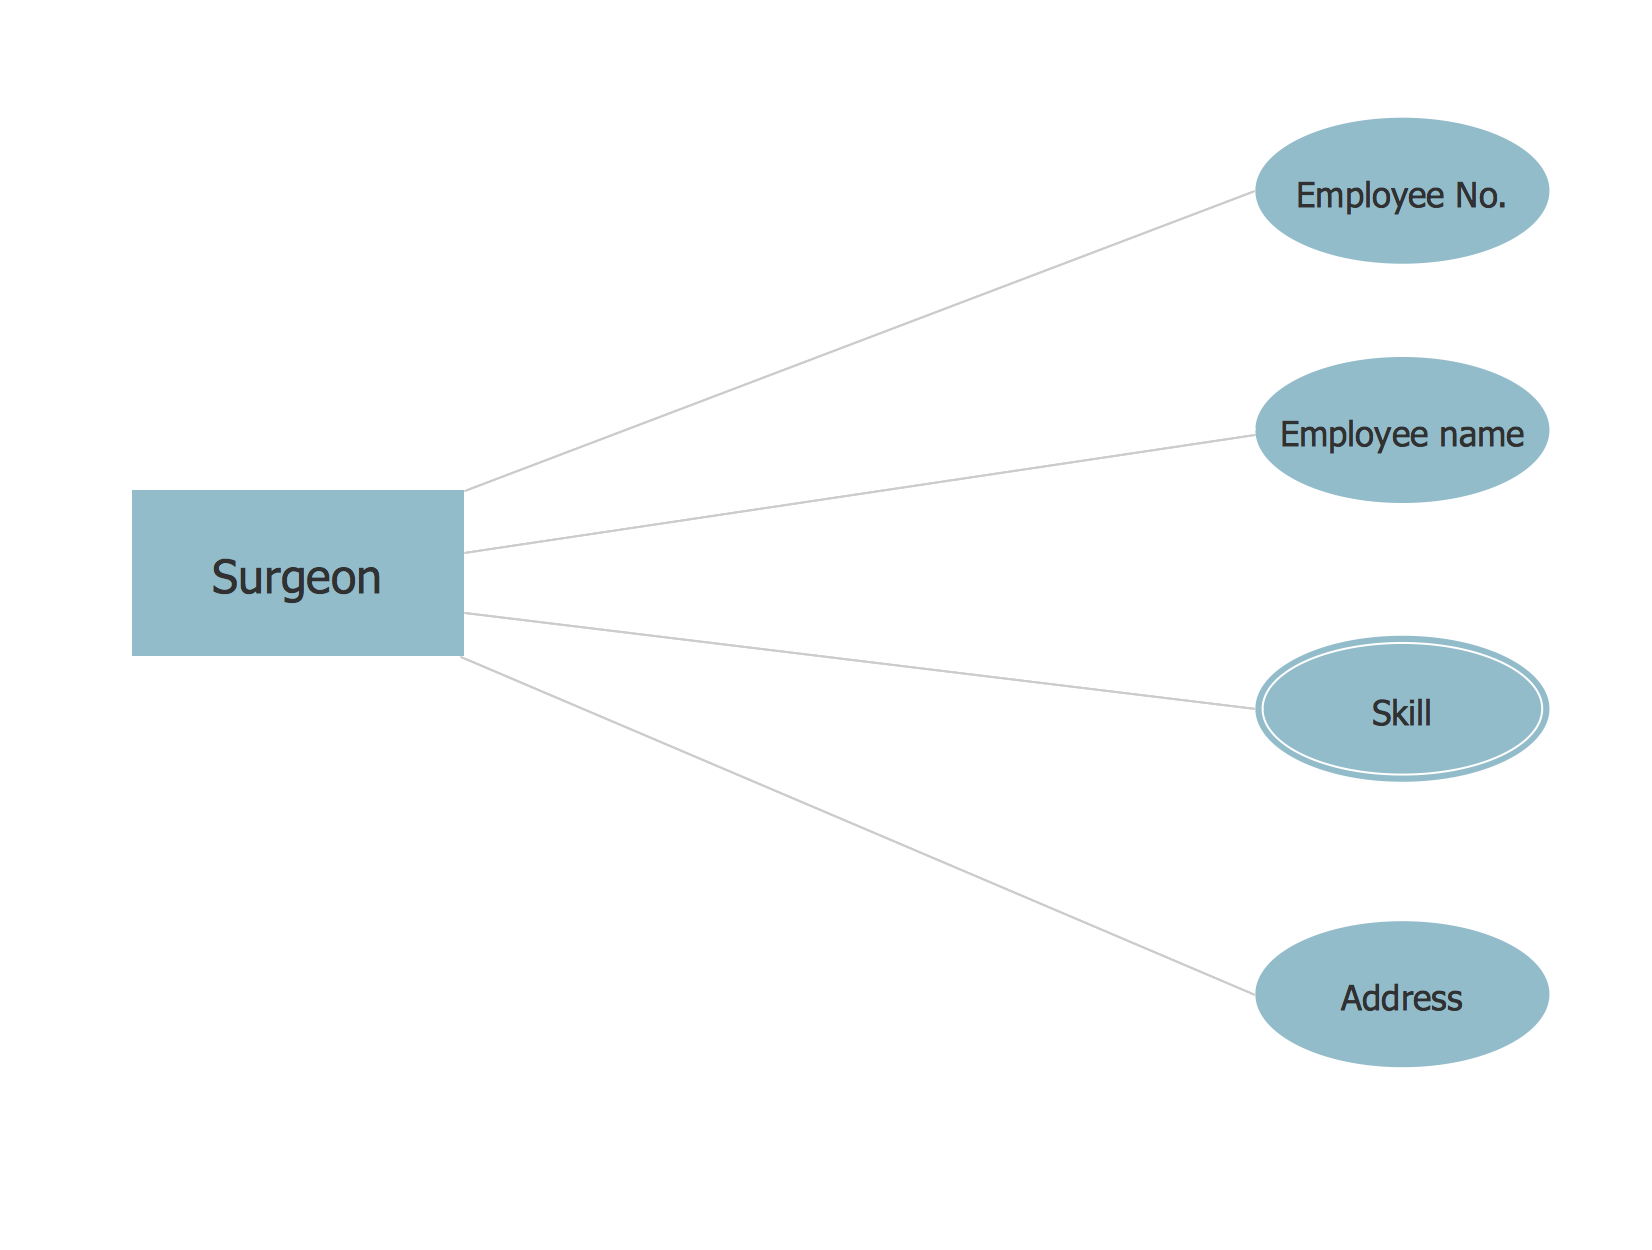
This sample diagram using the Entity-Relationship Diagram ( ERD ) Solution .
related to the Entity-Relationship Diagram solution, including video tutorials ,
ERD Symbols and Meanings
Modeling your data using entity-relationship diagram (ERD) with Crow's Foot notation which is popular in Structured Systems Analysis, Barker's Notations, Design Methods and information engineering you need the software that is easy in use having all necessary elements for creating the needed flowcharts as well as their examples. You can find all essential ERD symbols and its meanings on our site with tutorials of how to use it and you can always use the already existing layouts for making your own diagrams in our Solution Park. Once you download our application with extension of hundreds of design elements you’ll find it simple to start using it straight away and you’ll be pleasantly surprised of how smart this tool for making the charts is. Try it today for saving your time sake not to look for something else once you have great chance to use this excellent product already now!ERD Symbols and Meanings
Modeling your data using entity-relationship diagram (ERD) with Crow's Foot notation which is popular in Structured Systems Analysis, Barker's Notations, Design Methods and information engineering you need the software that is easy in use having all necessary elements for creating the needed flowcharts as well as their examples. You can find all essential ERD symbols and its meanings on our site with tutorials of how to use it and you can always use the already existing layouts for making your own diagrams in our Solution Park. Once you download our application with extension of hundreds of design elements you’ll find it simple to start using it straight away and you’ll be pleasantly surprised of how smart this tool for making the charts is. Try it today for saving your time sake not to look for something else once you have great chance to use this excellent product already now!Entity Relationship Diagram Software Engineering. Professional
In order to model some data, illustrate the logical structure and system design of databases, the Entity Relationship Diagram (ERD or ER Diagram as well as E-R Diagram) was introduced by Peter Chen as a modeling technique for software development. Using three main elements which are attributes, entities and relationships make possible to create so called ERD and to do it with help of ConceptDraw DIAGRAM software is simpler than ever now. As once you download ConceptDraw STORE, you will find the samples of ERDs which you can use for making your own diagram in short terms using all the elements necessary for this purpose. Immensely popular in software engineering this method for modeling database is common for IT engineers use as well as any other IT specialists once they want to succeed in their job. So why not to try our application just now to make sure you keep up with the times and use all necessary tools for achieving your goals?What's the best ERD tool for the Mac?. Professional ERD Drawing
What's the best ERD tool for the MacData Modeling with Entity Relationship Diagram
Data Modeling with Entity Relationship DiagramProfessional Diagram and Flowchart Software. Connect Everything
Audit planning flowchartThe example "Design elements - ERD solution (crow's foot notation)" is included
in the Entity-Relationship Diagram ( ERD ) solution from the Software
Sales Process Flowchart. Flowchart Examples
Analyzing the sales processing working in some business selling any kinds of products, you always want to control these processes and to do it is better illustrating the market and the relations happening in it. Being market-oriented and always keep pace with the time can help you to succeed in case you do everything just right and check on the receivables and accounts payable balance on time not to miss the right moment when you can invest more money in terms of getting more profit or stop supporting business in order to start something else, for example. To be successful and to have stable income is easy as long as you use the right tools for making your decisions on time. One of these tools can be software which can allow you to create any diagram or plan as well as sales process flowchart in shot terms using pre-designed layouts and samples to make your own charts looking professional, sophisticated and smart. Once you download the software itself as well as the application called ConceptDraw STORE, you can find examples there very helpful and useful as well as lots of different symbols for making any diagram look like if someone experienced made it.
 Jackson Structured Programming (JSP) Diagram Solution
Moreover, it includes the set of illustrative samples and examples of JSP
diagrams reflecting solution's abilities. The powerful abilities of this solution make
the
Structured Systems Analysis and Design Method (SSADM)
Structured Systems Analysis and Design Method (SSADM) was developed in the UK in the early 1980s and accepted in 1993 in order to analyze and project the information systems. Use the data flow diagrams (DFD) for describing the informational, functional and event-trigger models, the Logical Data Structure (LDS) diagrams for describing which data the system operates with and Entity Life History (ELH) diagrams for modelling events that happened in the system and find it simple to make any of these or other diagrams with help of our software. No matter what kind of flowcharts you decided to create, you can always do it using our ConceptDraw DIAGRAM product with help of Solutions sector on this site as well as STORE application which you can download to use the existing layouts from. Starting now, you’ll definitely make a better chart tomorrow, so why not to do it now, at this very moment? Once you get used to ConceptDraw DIAGRAM , you’ll find our product to be the most smart version of any existing applications and you’ll recommend it to all those who you care for to simplify their work and their lives.Swim Lane Diagrams
The process of displaying some production system’s object that is charged with given concrete processes in general flow of production system’s processes and making it in order to represent this object visually, is called Swim Lane analysis. In order to quickly draw the Swim Lane diagram, we recommend to use our sophisticated software called ConceptDraw DIAGRAM to make it simple and to have the final result look professional even if you never ever created anything like this in the past. There are so many libraries with design elements we provide as well as the examples and templates of pre-designed charts, flowcharts, schemes and diagrams. Use any as draft for your own great looking diagram and see how soon you get used to our smart application and recommend it to your colleagues, partners and friends. To represent working process of any complication simply in a visual form and to define participants of working process’s different parts is better in a way of Swim Lane diagram in ConceptDraw DIAGRAM.- Erd Examples Tutorials
- Er Diagram For Online Tutorial
- Design elements - ERD (crow's foot notation) | Entity Relationship ...
- Entity Relationship Diagram Symbols | Design elements - ERD ...
- Entity Relationship Diagram Examples | Martin ERD Diagram ...
- Er Diagram Tamil Tutorial
- Entity-Relationship Diagram ( ERD ) | Example Question And Answer ...
- Same Examples Of Erd In Database
- Dfd And Erd With Examples
- Entity Relationship Diagram Symbols | ConceptDraw DIAGRAM ER ...
- Er Diagram Tamil Pdf Tutorial
- Entity-Relationship Diagram ( ERD ) | Chen's ERD of MMORPG ...
- Create Erd Tutorial
- Data structure diagram with ConceptDraw PRO | Example Of Erd ...
- Er Diagram Questions With Solutions Pdf
- Entity-Relationship Diagram ( ERD ) | Erd Scenario Examples
- Entity-Relationship Diagram ( ERD ) | How to Create an Entity ...
- ERD Symbols and Meanings | Entity Relationship Diagram Symbols ...
- Chen Notation | Design elements - ER diagram (Chen notation ...
- Erd Diagram Examples With Solution Ppt


.png--diagram-flowchart-example.png)


