The Facts and KPIs. Visualizing Sales Data. To See How Your
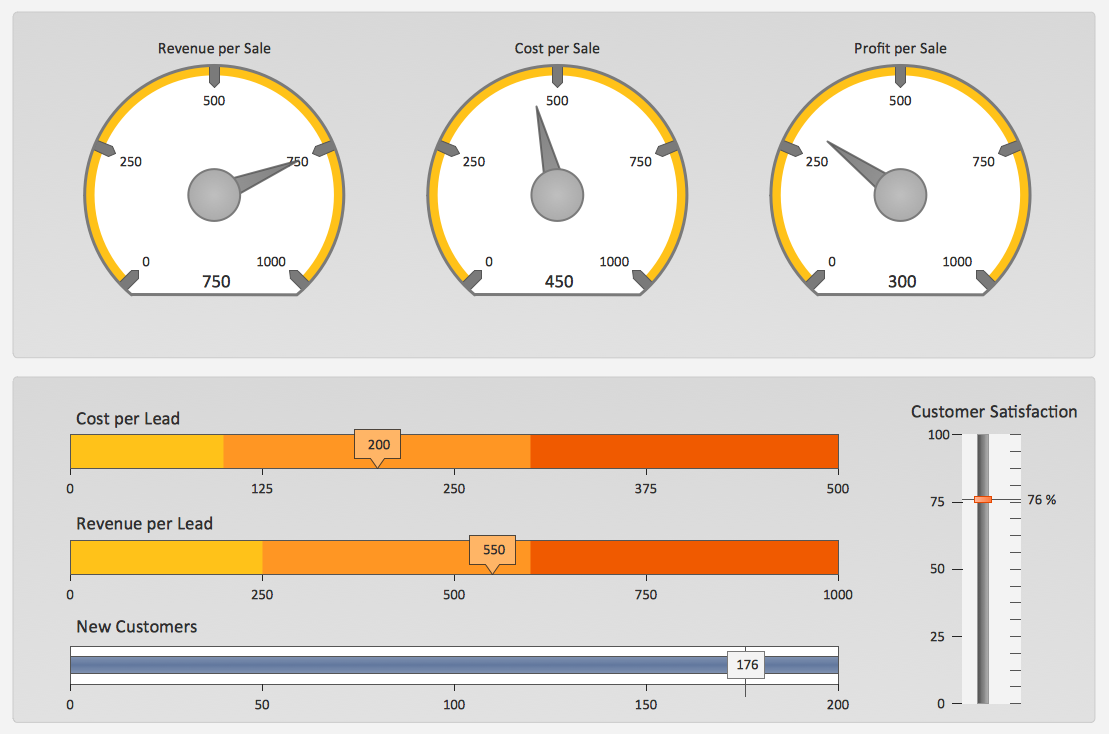
Sales KPIs Dashboard SampleCustomer Relationship Management. Visualizing Sales Data. To
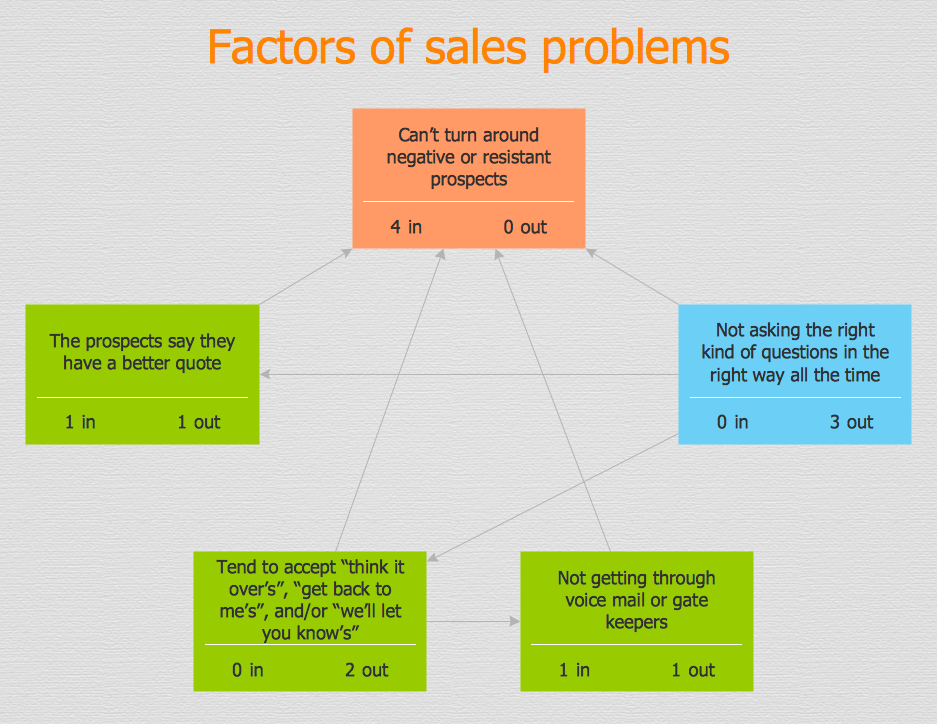
Design Elements - Sales DashboardRelations Diagram . Analyze Factors Relations. Problem Analysis
Relations diagram - Sales processWorkflow Process Example. Features to Draw Diagrams Faster
Taxi service - Workflow diagramCross Functional Flowchart Examples Conceptdraw. Connect
Flowchart - Manufacturing Process
 Fishbone Diagrams Solution. ConceptDraw.com
The Fishbone Diagrams solution extends ConceptDraw DIAGRAM software with
the ability to easily draw the Fishbone Diagrams ( Ishikawa Diagrams ) to clearly
Venn Diagram Problem Solving Examples in Quantum Information
Venn Diagram Problem Solving Example - BQP ComplexitySales Growth. Bar Graphs Example, Column Chart Example
Sales Growth. Bar Graphs Example
 Sales Flowcharts Solution. ConceptDraw.com
The Sales Flowcharts solution can be used while creating the sales and
marketing-related drawings in the ConceptDraw DIAGRAM diagramming and
drawing
What is SWOT Analysis in Marketing
Making SWOT analysis for any kind of business, whether it is big company or really small with two people working in it trying to achieve their goals, seems to be like a difficult thing, but once you try making it having ConceptDraw DIAGRAM you’ll realize how simple this process can be, and even very interesting as well as useful first of all. Describing Strengths, Weaknesses, Opportunities and Threats of your or somebody else’s company will become a usual thing as long as you have this great, smart and sophisticated software that allows you to choose any of already existing, created in advance templates and examples of great looking SWOT and TOWS analysis. Once you are ready to create SWOT or TOWS matrix, you can find what ever you need for making it as well as be able to draw any other plan, scheme, chart and flowchart, and even a diagram, having ConceptDraw DIAGRAM downloading on your desktop.
 IDEF0 Diagrams Solution. ConceptDraw.com
IDEF0 Diagrams visualize system models using the Integration Definition for
Function Modeling (IDEF) methodology. Use them for analysis , development and
 Sales Dashboard Solution. ConceptDraw.com
Sales Dashboard solution extends ConceptDraw DIAGRAM software with
templates, samples and library of vector stencils for drawing the visual
dashboards of
Visio Look a Like Diagrams . Connect Everything. ConceptDraw
Visio Look a Like Diagrams
 Funnel Diagrams Solution. ConceptDraw.com
Funnel Diagrams solution including wide range of funnel diagram samples, sales
funnel examples, and vector design elements, makes the ConceptDraw
Sales KPI Dashboards. Visualizing Sales Data. To See How Your
Fishbone diagram - Educational template- Fishbone Diagrams | Sales KPI Dashboards | PROBLEM ANALYSIS ...
- Business Process Diagrams | Fishbone Diagram | Rapid UML ...
- Fishbone Diagram | Six Markets Model Chart | Sales Dashboard ...
- Fishbone Diagrams | Fishbone Diagram | TQM Diagram Tool ...
- Ishikawa Diagram Sales
- Fishbone Diagram Sales Marketing
- Fishbone Diagrams | Sales KPI Dashboards | Fishbone Diagram ...
- Fish Bone Diagram For Sales Decreased
- Sales Strategy Diagram
- Sales Flowcharts | Fishbone Diagrams | Iso 9001 Sales Process Chart
- Mind Mapmind Map Fishbone Diagram For Sales
- Network Diagram Software Backbone Network | Sales Flowcharts ...
- Business Process Diagrams | Sales Process Flowchart. Flowchart ...
- Marketing Diagrams | Fishbone Diagram | Target and Circular ...
- Business Process Elements: Activities | Fishbone Diagram | Contoh ...
- Fishbone Diagrams | Fishbone Diagram Problem Solving | Using ...
- Cause and Effect Fishbone Diagram | Cause and Effect Analysis ...
- Fishbone Diagram | Fishbone Diagrams | Service 8 Ps fishbone ...
- Sales Diagram Examples
- How Do Fishbone Diagrams Solve Manufacturing Problems ...


