How Do Fishbone Diagrams Solve Manufacturing Problems
How Do Fishbone Diagrams Solve Manufacturing Problems
 Fishbone Diagrams Solution. ConceptDraw.com
The Fishbone Diagrams solution extends ConceptDraw DIAGRAM software with
the ability to easily draw the Fishbone Diagrams ( Ishikawa Diagrams ) to clearly
Wikipedia] This 8Ms Ishikawa diagram (manufacturing cause and effect diagram )
template is included in the Fishbone Diagram solution from the Management
Draw Fishbone Diagram on MAC Software
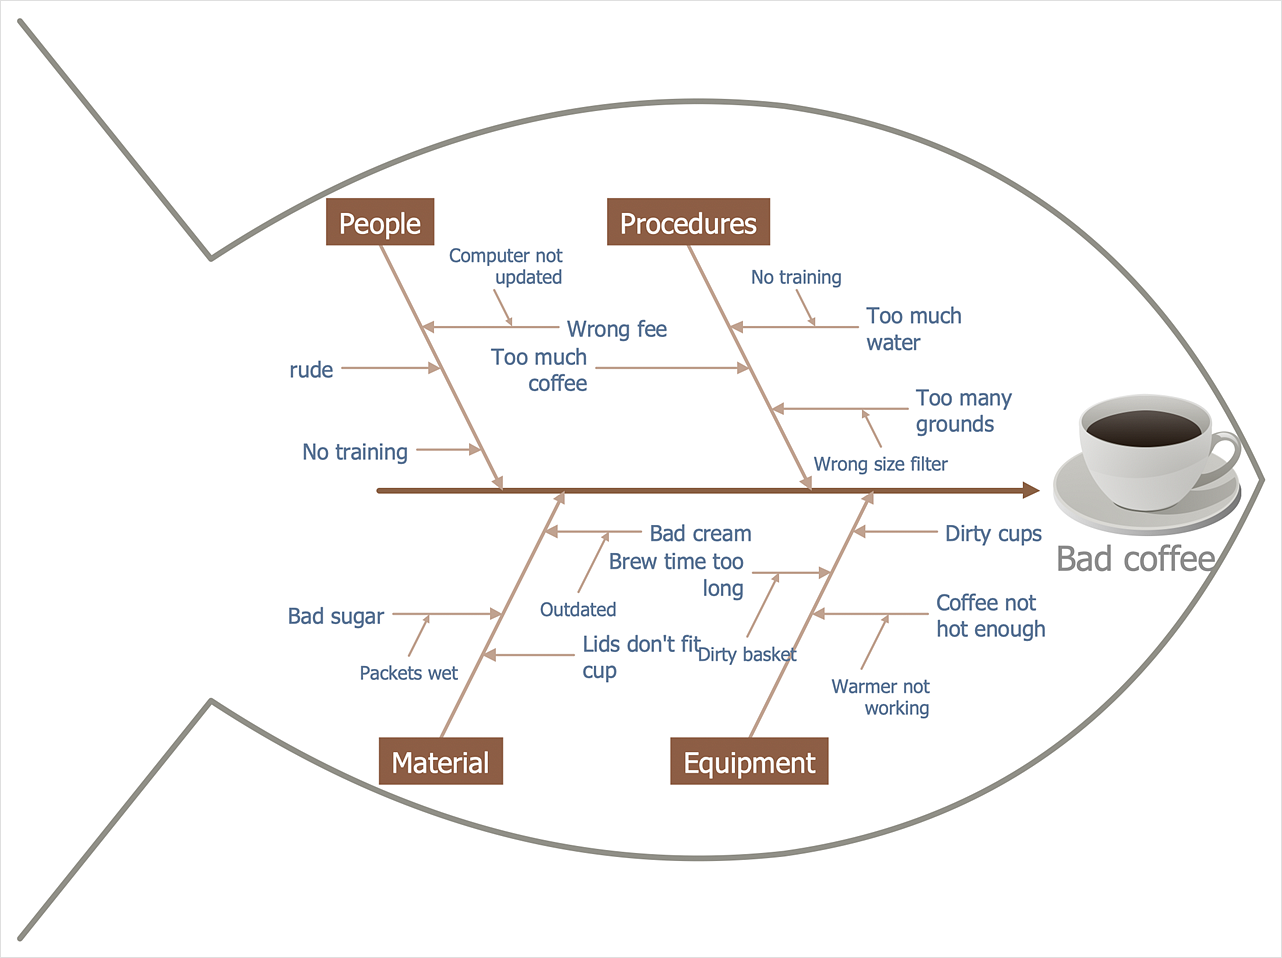
A Fishbone Diagram, also known as Ishikawa Diagram and a Cause and Effect Diagram, is a way of visualizing and categorizing the potential causes of any problem to be able to identify the root causes this problem. In this diagram you mention the System itself, the Suppliers, Surroundings, Skills as main parts of it as well as its sub-causes which lead to one main Service Problem. To be able to create such diagram you need the right software to use for drawing the professionally looking sophisticated diagram and the solution can be using ConceptDraw DIAGRAM as the best of existing applications for making such flowcharts. The variety of symbols and vector elements in it will please anyone and so it will simplify your work. Making different smart charts in terms of having good impression among your colleagues, chiefs and clients as well as progressing with your work, you can rely upon software called ConceptDraw DIAGRAM as the one being your best assistant and adviser which you can have on your Mac.Using Fishbone Diagrams for Problem Solving
Using Fishbone Diagrams for Problem SolvingHelpDesk
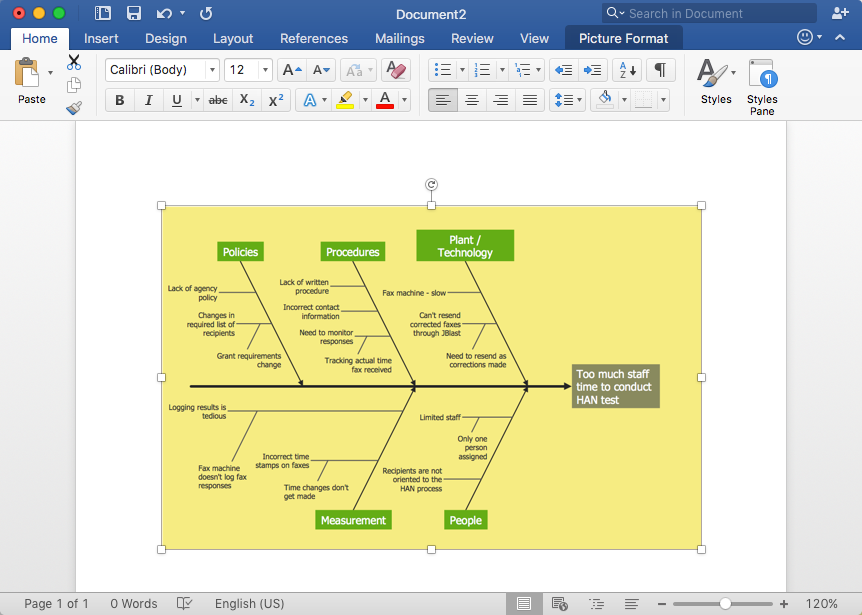
Add a Fishbone Diagram to MS Word. ConceptDraw HelpDesk
The ability to create a fishbone ( Ishikawa ) Diagram is supported by the ConceptDraw Fishbone Diagram solution. ConceptDraw DIAGRAM allows you to easilyHelpDesk
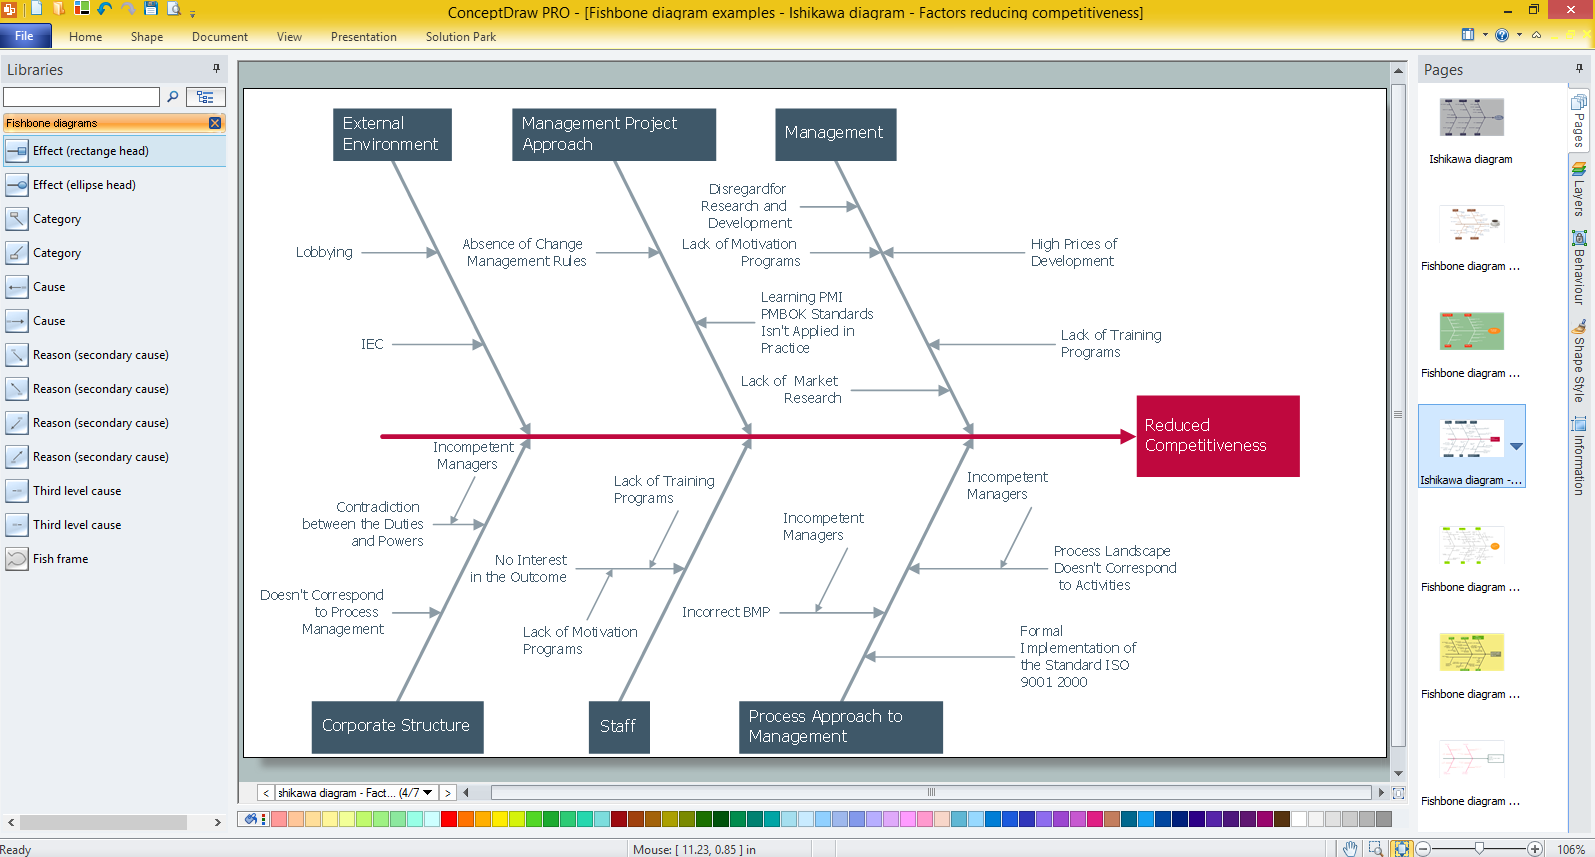
How to Draw a Fishbone Diagram
Fishbone ( Ishikawa ) Diagram is often used in business to determine the cause of some problem. A Fishbone diagram is also called a cause-and-effect diagram .HelpDesk
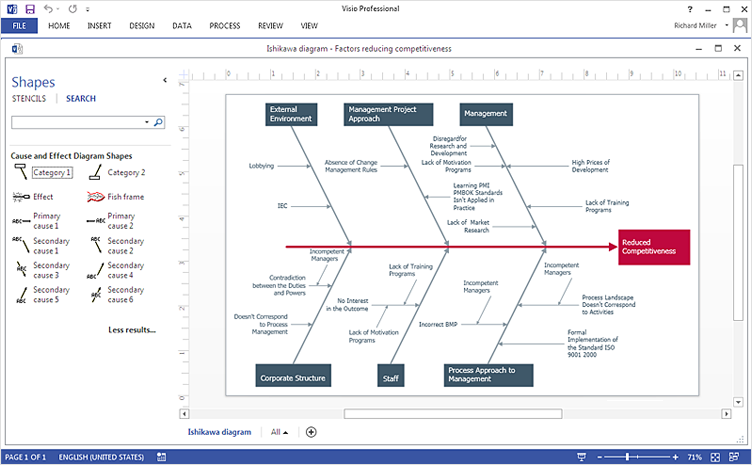
Create Visio Fishbone Diagram . ConceptDraw HelpDesk
A Fishbone ( Ishikawa ) diagram is also called a cause-and-effect diagram . Fishbone diagram is often used in business to determine the cause of some problem.Improving Problem Solving and Focus with Fishbone Diagrams
Improving Problem Solving and Focus with Fishbone DiagramsCause and Effect Analysis - Fishbone Diagrams for Problem Solving
Cause and Effect Analysis - Fishbone Diagrams for Problem SolvingCreate Fishbone Diagrams with the ConceptDraw
Create Fishbone Diagrams with the ConceptDrawUse a Fishbone Diagram to Attack Complex Problems
Use a Fishbone Diagram to Attack Complex Problems- Fishbone Diagram Problem Solving | Human Resource ...
- Fishbone Diagrams | How Do Fishbone Diagrams Solve ...
- Fault Tree Analysis Diagrams | Fishbone Diagrams | Fishbone ...
- Fishbone Diagrams | Blank Calendar Template | Cause and Effect ...
- Total Quality Management with ConceptDraw | Fishbone Diagrams ...
- Fishbone Diagram Example | How Do Fishbone Diagrams Solve ...
- Cause and Effect Analysis | Problem solving | Using Fishbone ...
- How Do Fishbone Diagrams Solve Manufacturing Problems ...
- Manufacturing 8 Ms fishbone diagram - Template | 7m Man Power ...
- Service 8 Ps fishbone diagram - Template | Fishbone Diagrams ...
- Fishbone diagram - Causes of low-quality output | Fishbone ...
- Fishbone Diagrams | Fishbone diagram - Causes of low-quality ...
- Accounts Payable Flowchart | Fishbone Diagram Procedure ...
- Manufacturing 8 Ms fishbone diagram - Template | 8m Method ...
- Fishbone Diagram | Using Fishbone Diagrams for Problem Solving ...
- Cause and Effect Diagram | How Do Fishbone Diagrams Solve ...
- How To Create Cause and Effect ( Fishbone ) Diagram in MS Visio ...
- Types of Flowcharts | Fishbone Diagrams | Venn Diagram | What Is ...
- Fishbone Diagrams | Draw Fishbone Diagram on MAC Software ...
- Cause and effect diagram - Increase in productivity | Fishbone ...


.png)


