HelpDesk
Drawing a Pictorial Charts. ConceptDraw HelpDesk
A Pictorial chart is a type of Pictorial Infographics. It is used to visually present data comparison. Pictorial charts use relative sizes or repetitions of the same icon ,Sample Pictorial Chart . Sample infographics
Sample Pictorial Chart — Small Business Statistics (UK 2013)Design Pictorial Infographics. Design Infographics
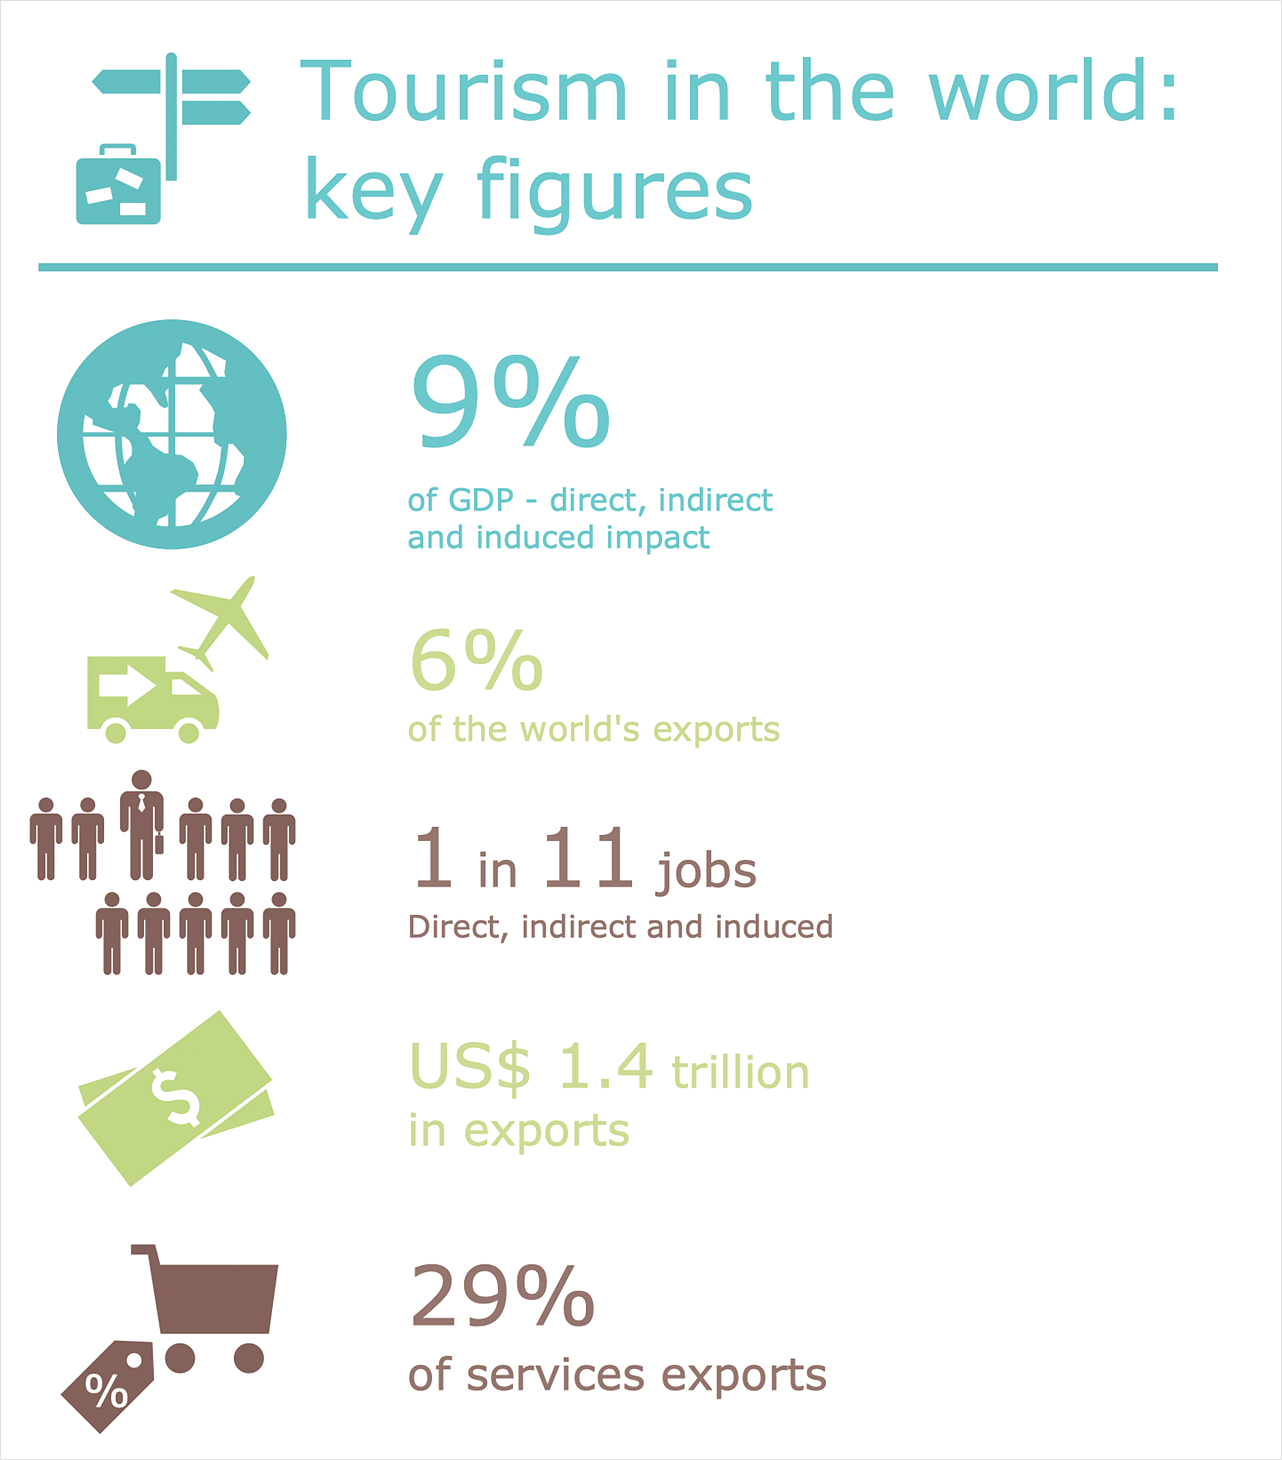
Design Pictorial Infographics — Tourism in the WorldUse these shapes to draw your pictorial bar charts in the ConceptDraw PRO
diagramming and vector drawing software. The vector stencils library "Picture
Work Flow Process Chart . Features to Draw Diagrams Faster
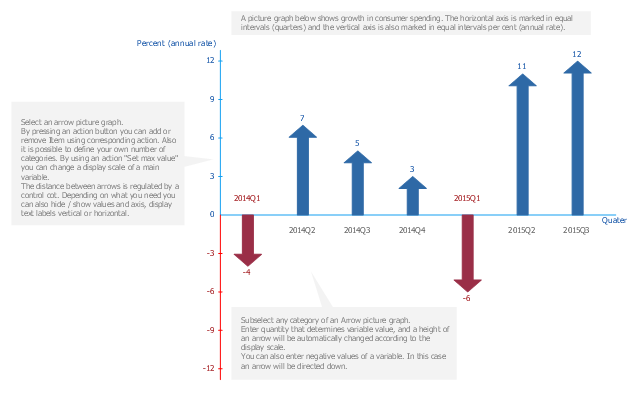
Workflow diagram - Design elementsThe vector stencils library "Picture Graphs" contains 4 image chart templates. Use
it to design your pictorial bar charts in ConceptDraw PRO diagramming and
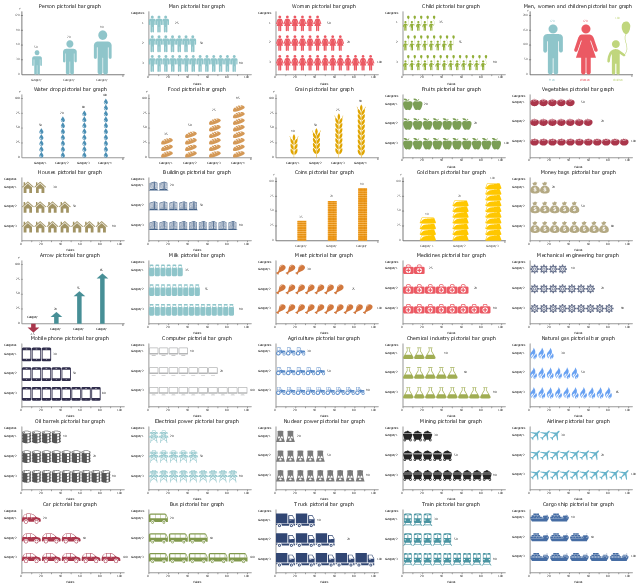
The vector stencils library "Picture bar graphs" contains 35 templates of pictorial
charts . Use it for visualization of data comparison and time series with
Pie Chart Software. Pie Charts , Donut Charts
Percentage pie chart example. DA determinationsA picture chart (image chart , pictorial graph ) is the type of a bar graph visualizing
numarical data using symbols and pictograms. In the field of economics and
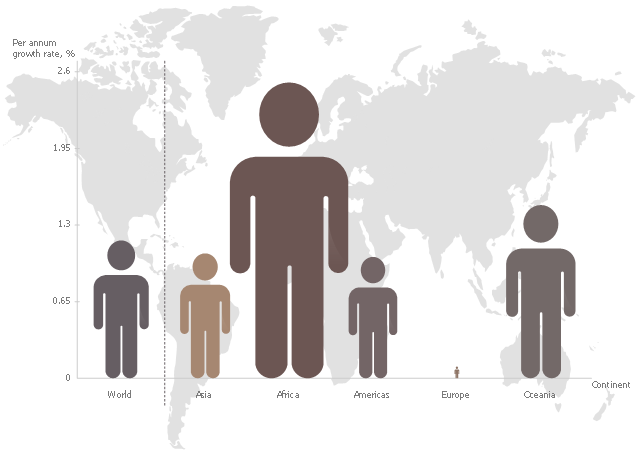
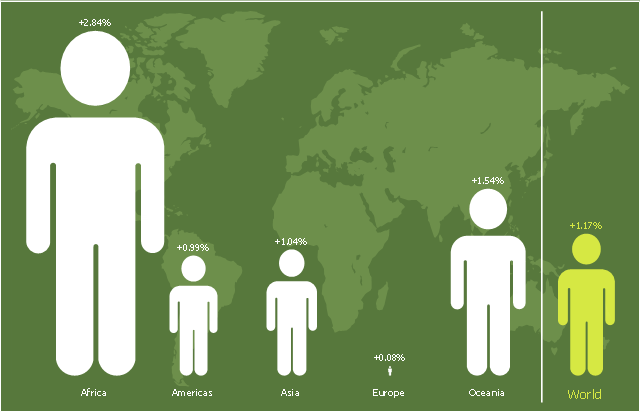
This pictorial chart sample shows the population growth by continent in 2010-
2013. "Population growth' refers to the growth in human populations. Global
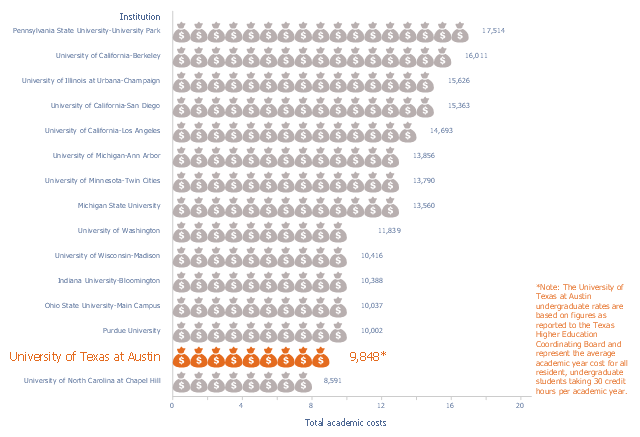
This picture bar graph sample shows the UT Austin Tuition Ranks 6th Compared
[tuition.utexas.edu/compare] The pictorial chart "Academic costs for residents,
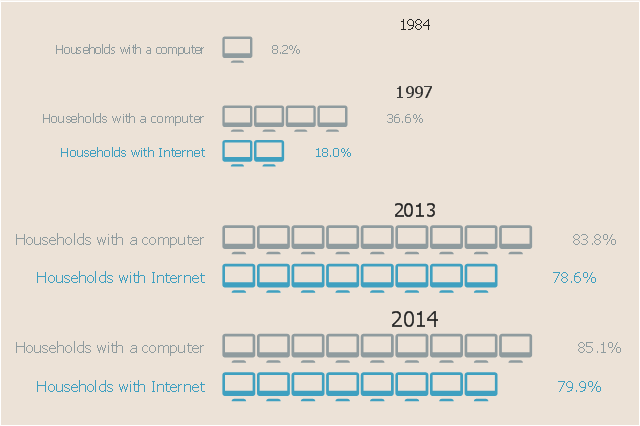
Wikipedia] The pictorial chart example "Computer and Internet use at home over
time" solution from the Graphs and Charts area of ConceptDraw Solution Park.
- How to Draw a Pictorial Chart in ConceptDraw PRO | How to Add a ...
- How to Draw Pictorial Chart . How to Use Infograms | Sample ...
- Sample Pictorial Chart . Sample Infographics | Picture Graphs ...
- How to Draw Pictorial Chart . How to Use Infograms | Workflow ...
- How to Draw Pictorial Chart . How to Use Infograms | How to Draw a ...
- Pictorial Chart
- Pictorial Chart
- How to Draw Pictorial Chart . How to Use Infograms | Pictorial Chart ...
- How to Draw a Pictorial Chart in ConceptDraw PRO | 3D pictorial ...
- Sample Pictorial Chart . Sample Infographics | Line Chart Examples ...
- Design elements - Picture graphs | How to Draw Pictorial Chart . How ...
- Population growth by continent | Infographic Maker | Sample ...
- How to Draw Pictorial Chart . How to Use Infograms | Sample ...
- Sample Pictorial Chart . Sample Infographics | Infographic Maker ...
- Pictorial Chart | Infographic Maker | Sample Pictorial Chart . Sample ...
- Flow Chart Diagram Examples | Business Diagram Software ...
- Basic Area Charts | Basic Picture Graphs | Area Charts | Pictorial ...
- How to Draw Pictorial Chart . How to Use Infograms | Computer and ...
- Information Graphics | Sample Pictorial Chart . Sample Infographics ...
- How to Draw Pictorial Chart . How to Use Infograms | Infographic ...
