HelpDesk
Creating Project Gantt Chart . ConceptDraw HelpDesk
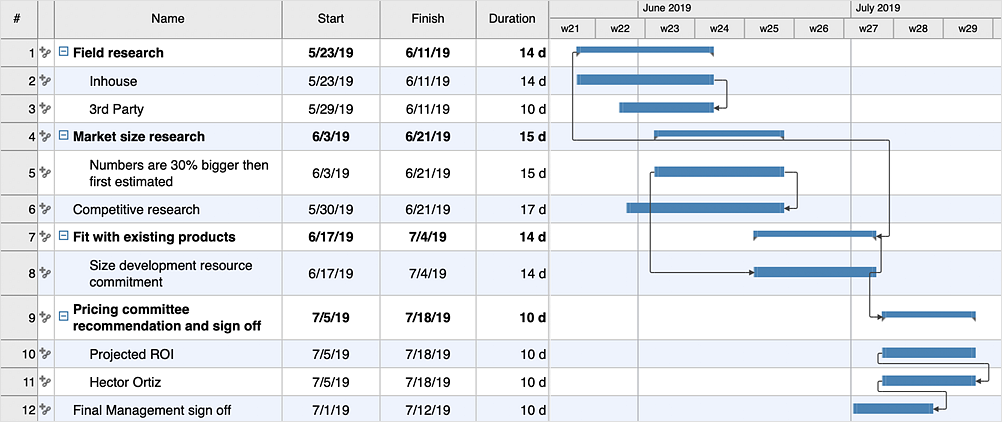
Instruction on how to create Gantt chart using ConceptDraw PROJECT software. Gant Chart is a graphical representation of tasks as segments on a time scale.HelpDesk
Drawing a Project Gantt Chart . ConceptDraw HelpDesk
A Gantt chart is intended to provide a visualization of a project schedule. It is developed to help planning, coordinating, and tracking on project tasksHow to Report Task's Execution with Gantt Chart
ConceptDraw Project Gantt chart reports galleryHelpDesk
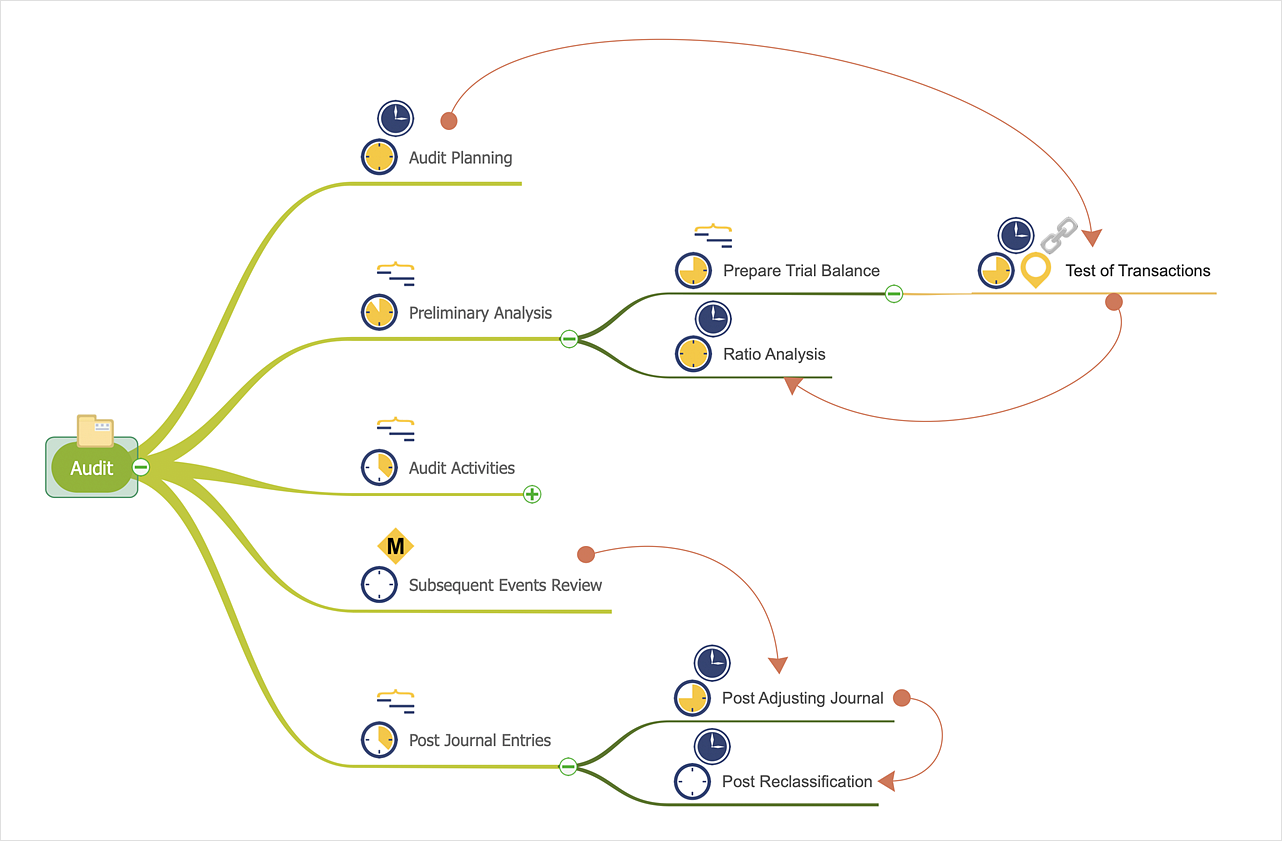
How to Make a Mind Map from a Project Gantt Chart . ConceptDraw
ConceptDraw Office allows you to see the project data from ConceptDraw PROJECT in a mind map structure by opening your project in ConceptDrawHow to Create Presentation of Your Project Gantt Chart
PowerPoint presentation of a projectHelpDesk
Adding a Color Marker to Project Task on a Gantt Chart
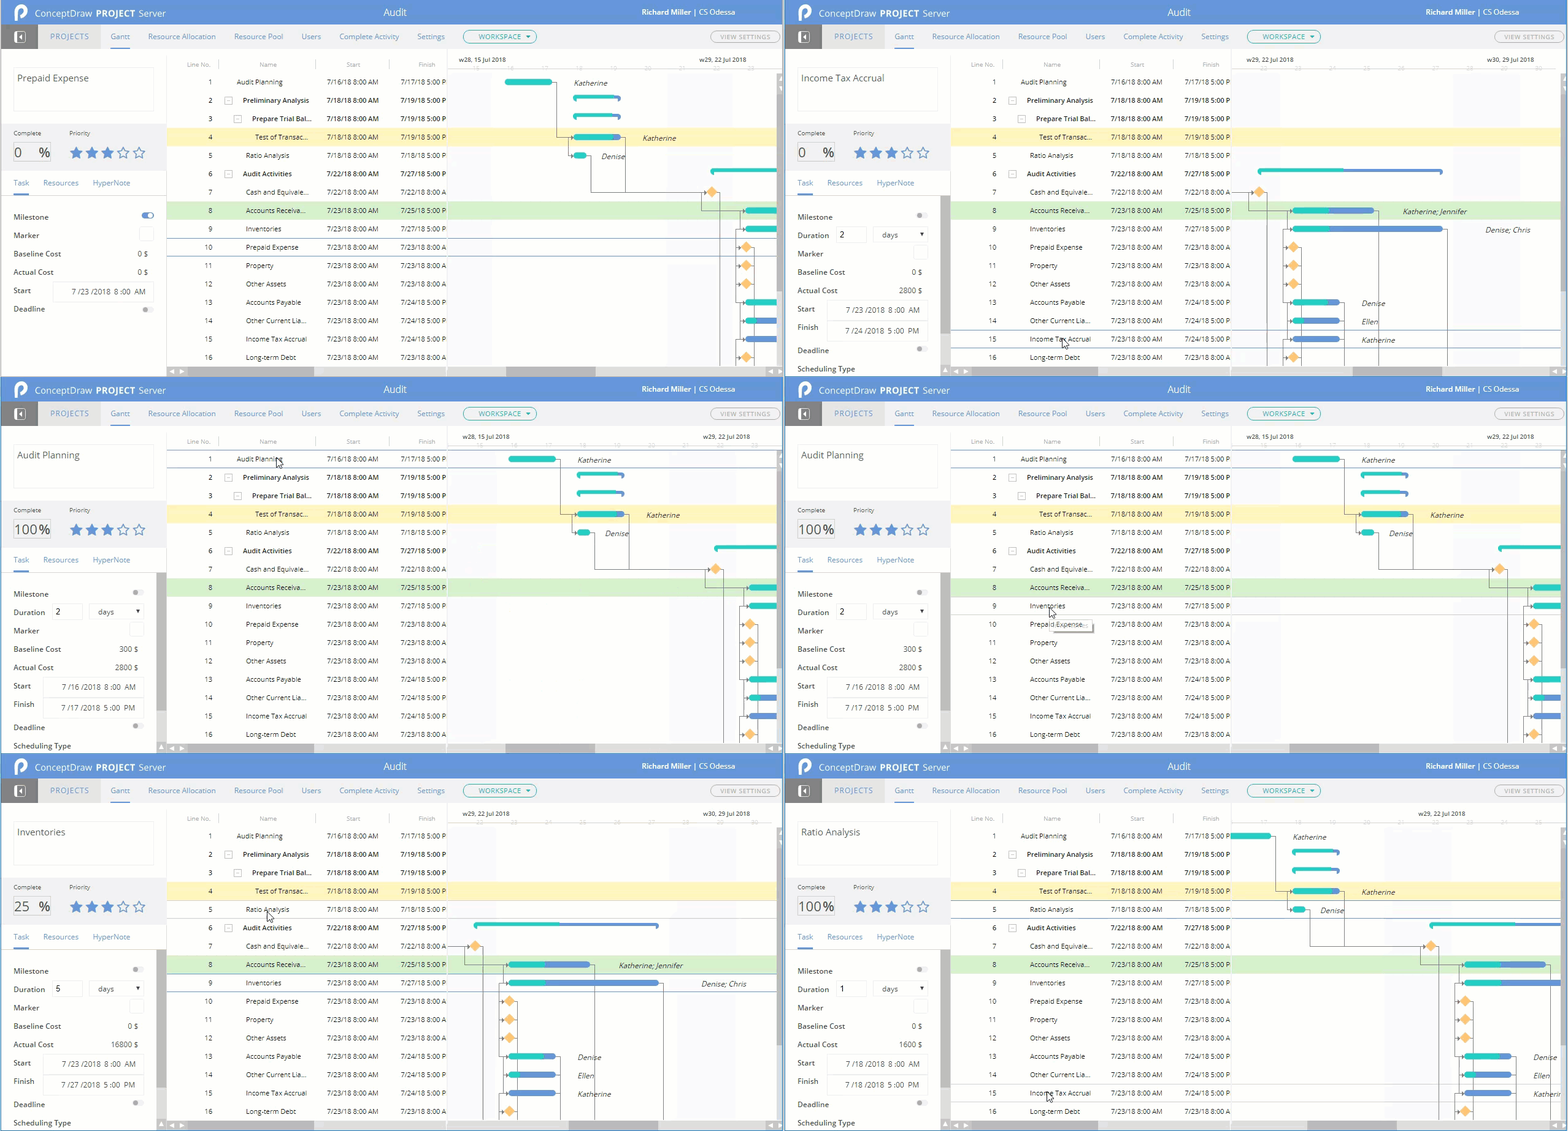
ConceptDraw PROJECT Server allows adding color markers to scheduled project tasks. A color marker is used to show whether a task is marked for further action or identification of some kind. You can use markers if you want to select certain tasks for further viewing, filtering, formatting, or editing in the offline mode.HelpDesk
What information to be displayed in the outline of project Gantt Chart
What information can can contain the project task list? Gantt Chart view is a graphical representation of a project outline that allows one to allocate tasks.You canHelpDesk
Change the Timescale in a Gantt Chart View. ConceptDraw HelpDesk
Most views in ConceptDraw PROJECT Server have a timescale that shows the units of project time measurement (hour, day, week, etc.) used to schedule project tasks. You can change the timescale to view smaller or bigger time units, from hours all the way up to years. For example, you may want to show time in quarterы of the yearб or you may want to show Gantt chart across months and days.What is Gantt Chart (historical reference)
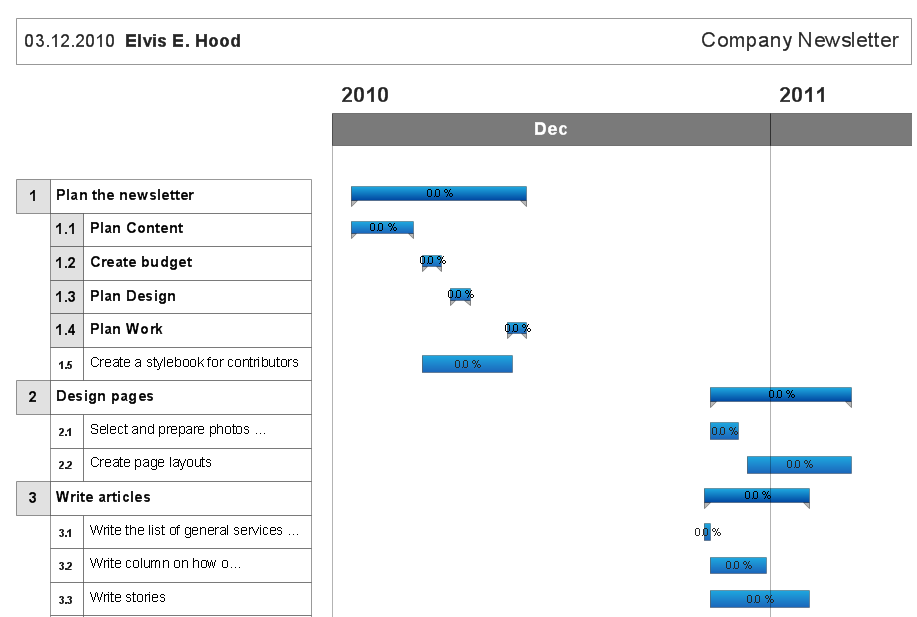
Gantt chart example - Strategic plan for hew businessHelpDesk
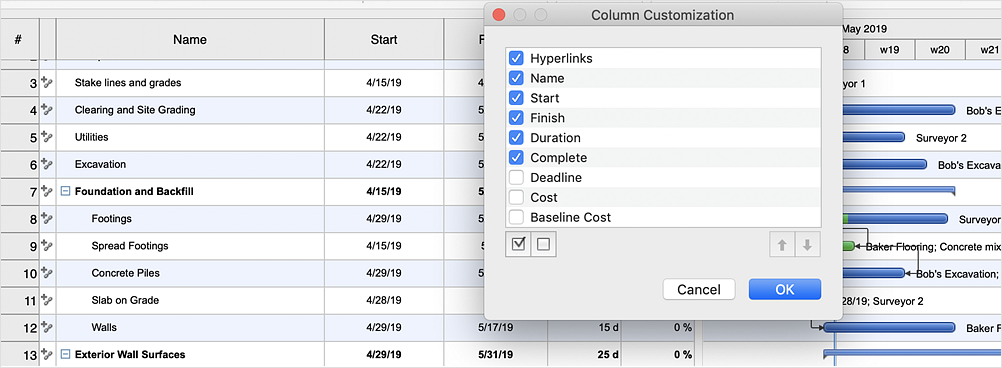
Customizing Columns in a Gantt Chart . ConceptDraw HelpDesk
ConceptDraw PROJECT allows customizing the columns displayed in a Gantt chart , Multiproject View, Resource View and Resource Usage View enablingHelpDesk
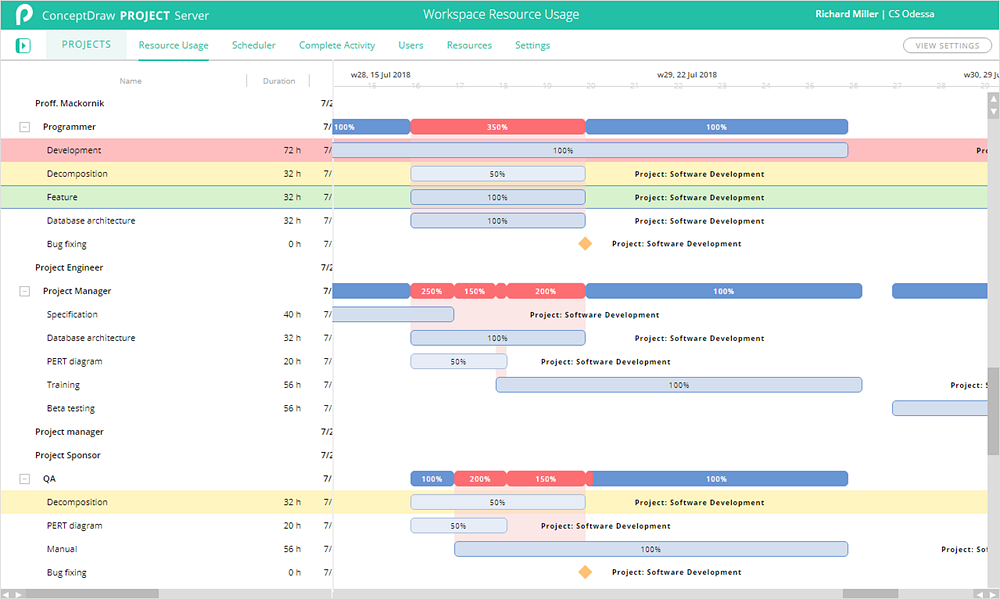
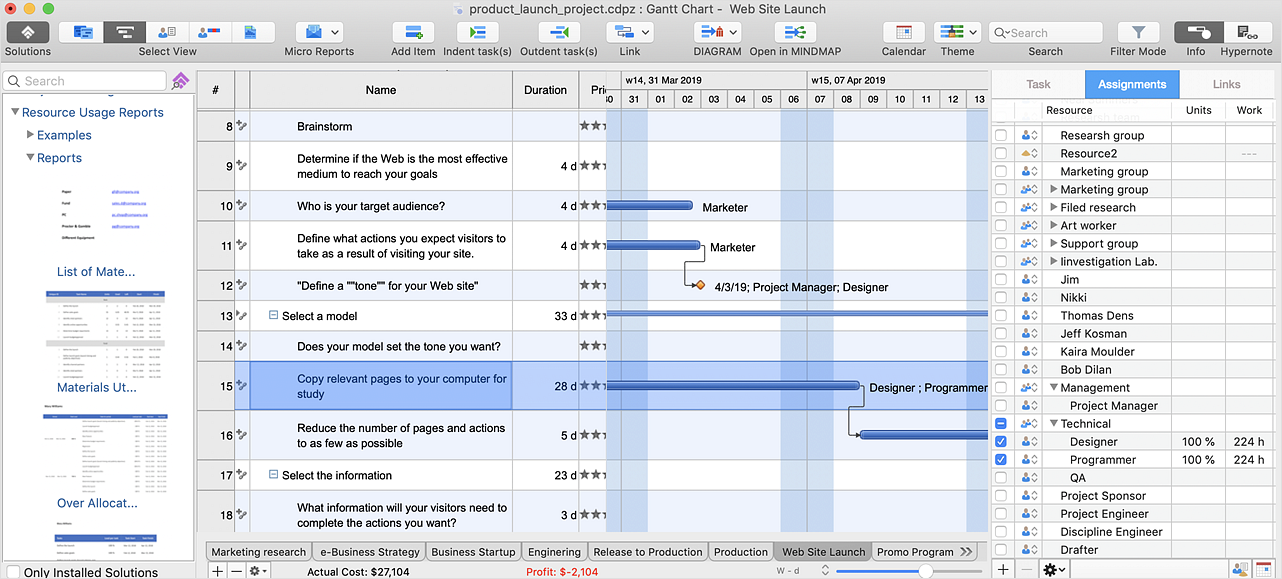
Planning and allocating project resources on Mac. ConceptDraw
When you are planning your project task list on the Gantt chart you will need to identify the resources to work on the project and assign them to tasks. To add a- Gantt chart examples | ConceptDraw PROJECT Project ...
- Gantt charts for planning and scheduling projects | Project ...
- Construction Project Chart Examples | Gant Chart in Project ...
- How to Create Presentation of Your Project Gantt Chart ...
- Gantt charts for planning and scheduling projects | What is Gantt ...
- Gantt charts for planning and scheduling projects | HR Flowcharts ...
- Gantt Chart Sample For Telecom
- Gantt charts for planning and scheduling projects
- Gantt Chart Software | How to Create a Gantt Chart for Your Project ...
- How to Draw a Gantt Chart | Gantt chart examples | Gant Chart in ...
- Gantt charts for planning and scheduling projects | How to Create a ...
- Gantt charts for planning and scheduling projects | Gant Chart in ...
- Gantt charts for planning and scheduling projects | Swimlane ...
- How to Create Presentation of Your Project Gantt Chart | Gantt chart ...
- How to Create Presentation of Your Project Gantt Chart | How to ...
- Project — Assigning Resources | Construction Project Chart ...
- What is Gantt Chart (historical reference) | Critical Path Method in ...
- Gantt chart examples | Online Marketing Objectives | Gant Chart in ...
- Gantt Chart Software | How to Draw a Gantt Chart Using ...
- How to Draw a Gantt Chart | How to Create Presentation of Your ...
