Management
This is the Management area from the ConceptDraw.com Samples section.
Management diagrams are visualization tools for business communication, which help represent and explain complex qualitative information in an easy-to-understand visual form.
The ConceptDraw Solutions of the Management area provide you with the vector drawing tools for quick and simple designing the 16 types of management diagrams:
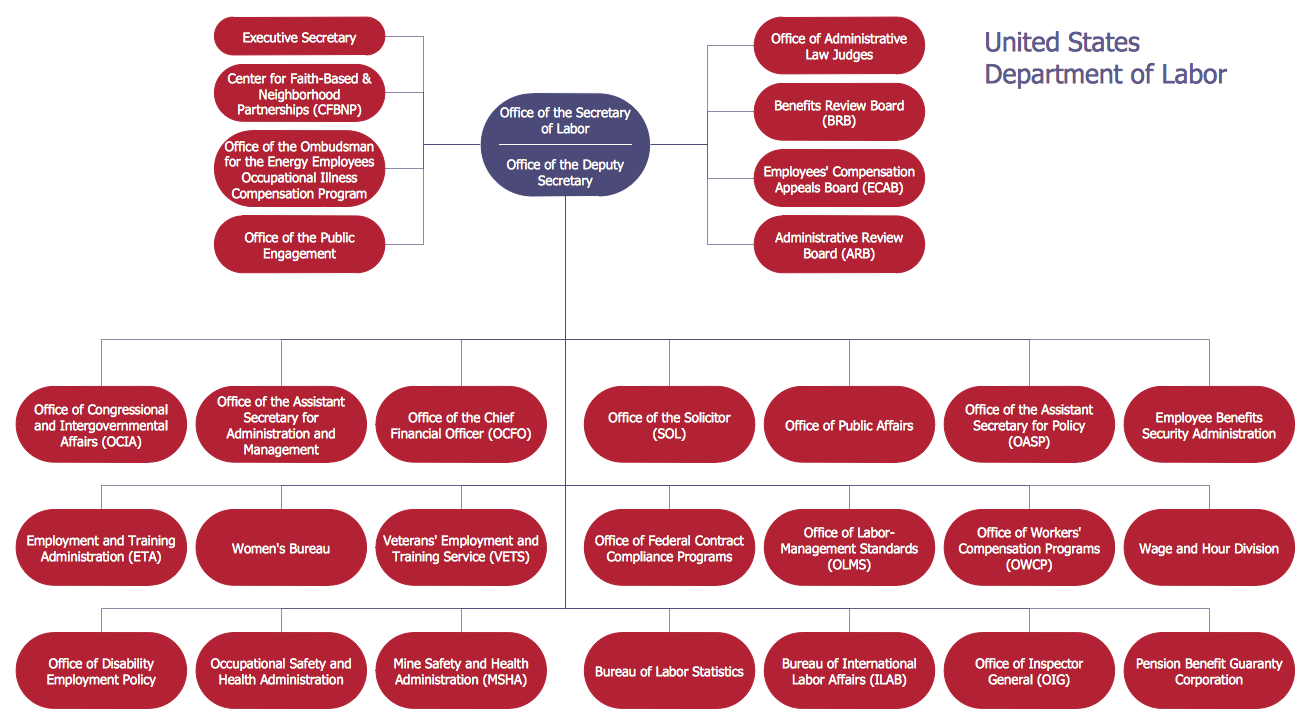
- organizational charts,
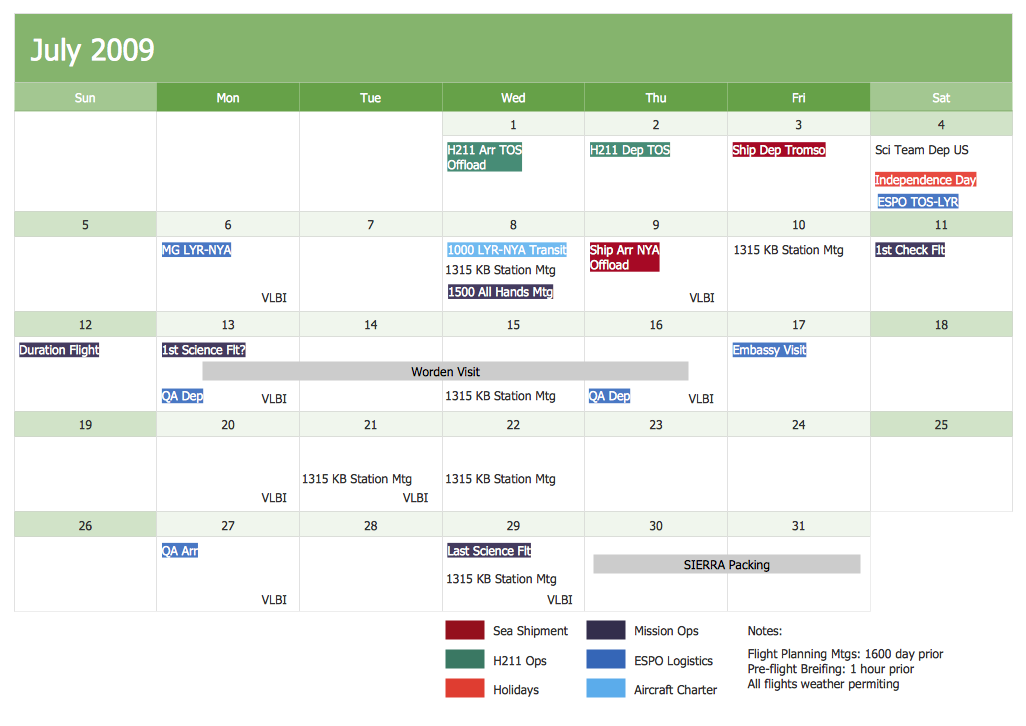
- business calendars and schedules,
- seven management and planning tools,
- affinity diagrams,
- relations diagram (interrelationship diagram, interrelationship diagraph),
- prioritization matrix diagram,
- root cause analysis tree diagram ,
- involvement matrix diagram ,
- PERT chart,
- risk diagram (process decision program chart, PDPC),
- cause-and-effect diagrams (fishbone diagrams, Ishikawa diagrams),
- human resources (HR) flowcharts,
- timeline diagrams,
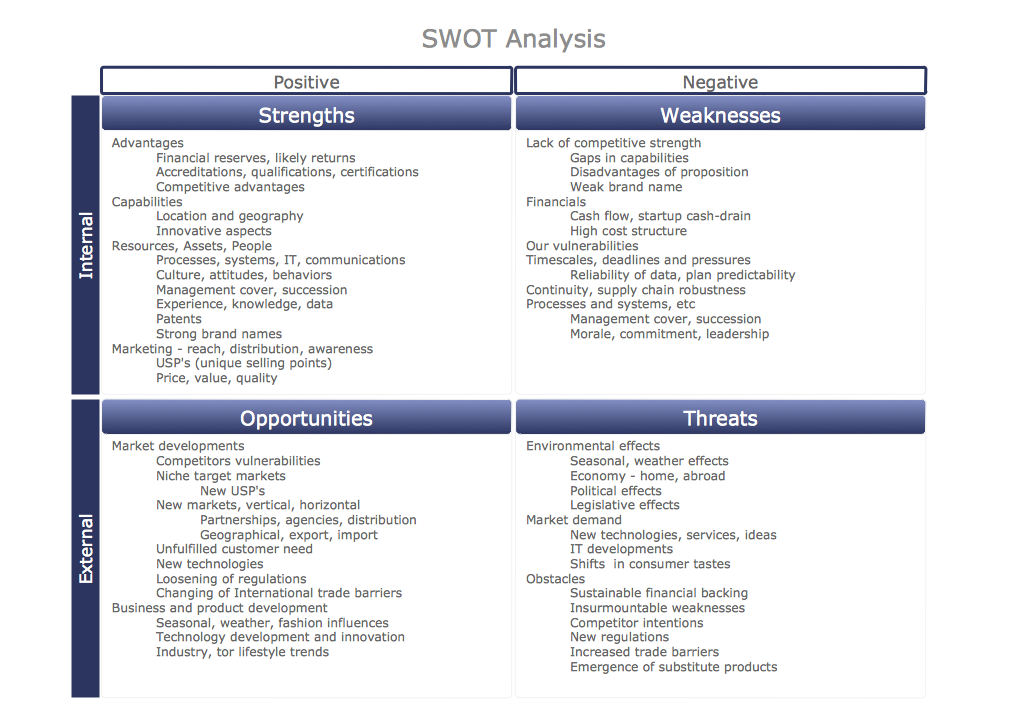
- SWOT and TOWS matrix diagrams,
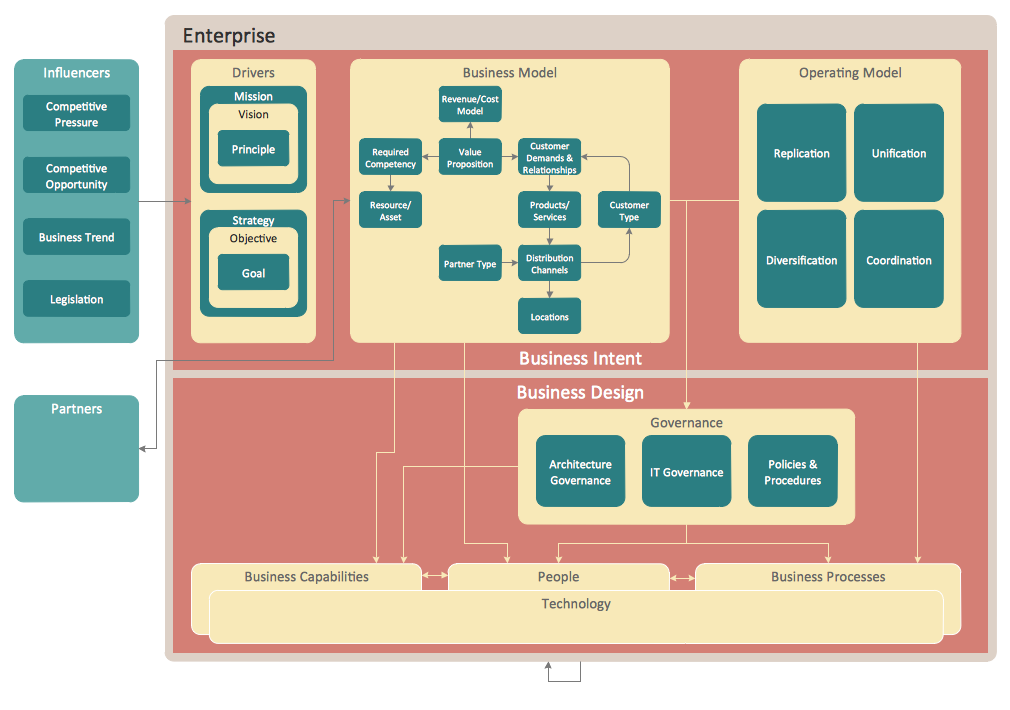
- enterprise architecture diagrams, and
- stakeholder onion diagrams.
ConceptDraw Solution Park provides the wide range of solutions for specific branches of business management:
- financial management — solutions from the Finance and Accounting area,
- human resource management — HR Flowcharts solution,
- information technology management — solutions from the Computer and Networks area,
- marketing management — Marketing Infographics solution and solutions from the Marketing area,
- production management — solutions from the Business Processes area and Quality Management area,
- project management — solutions from the Project Management area,
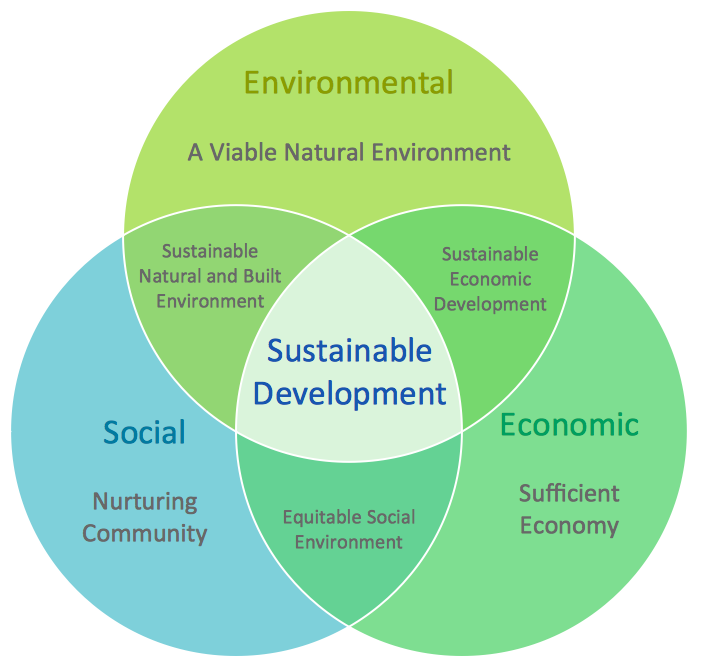
- strategic management — Management Infographics solution, solutions from the Management area.
This web page navigates you to the sample sets of all diagram types from the Management area at ConceptDraw Solution Park.


