 Agriculture Infographics
|
|
Use this solution to design agriculture and farming infographics, illustrate farm processes, agricultural practices, innovative techniques and concepts, natural cycles and ecosystem dynamics, and other knowledge to facilitate their use in education and training programs, practical agriculture, communication, marketing, and sales. |
|
 PDF Exchange
|
|
Use this solution for ConceptDraw Solution Park to create the framework for an illustrative book or article in Mind Map format using mindmapping tools from the ConceptDraw MINDMAP software and then create PDF document — create book in PDF format or the book's cover in PDF in seconds with just a simple click of the mouse. |
|
 Public Utilities
|
|
Success in development innovative strategies and technologies in public utility field, enhance their efficiency and availability. Design efficiently any technical drawing, infographics and diagrams about public utilities; create plumbing plan, heating plan, electrical diagram easily with public utility icons from the vector icons libraries. |
|
 Critical Infrastructure Sectors
|
|
Succeed in designing infographics and diagrams related to new technologies and newest equipment for critical infrastructure protection, energy sector, increasing equipment resilience, prevention physical, environmental, and cyber threats, communications, development of information technology and detection equipment, financial services, emergency services, homeland security, cybersecurity. |
|
 MindMap Diagrams
|
|
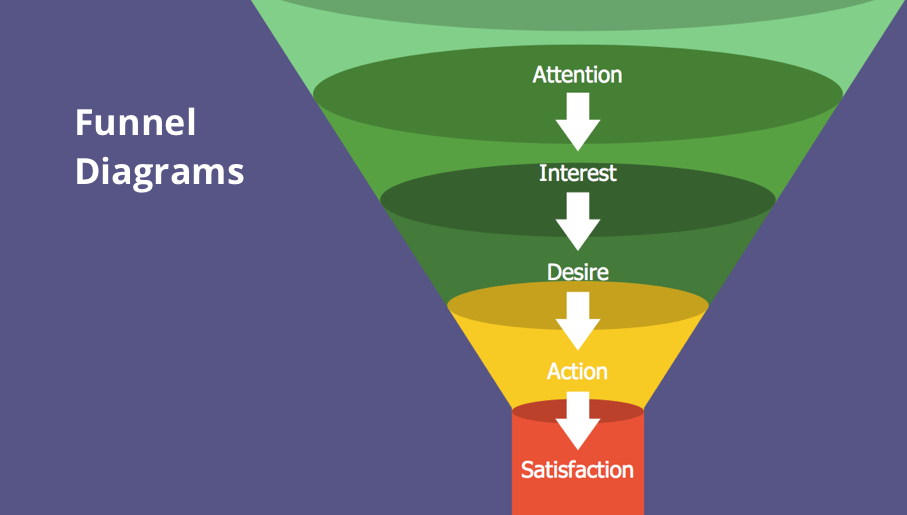
This solution offers a set of samples and templates, which you can use to create a Mind Map document with Funnel Diagram, PESTLE Analysis Diagram, Stakeholder Onion Diagram, Venn Diagram, or Matrix Diagram. |
|
 Medical Mycology
|
|
This solution contains tools effective for compiling an overview of fungal diseases, fungal pathogens, mold, fungal mycotoxins, their diagnosing, dangerous effects of fungi on humans and animals, ways to avoid infection including personal hygiene, antifungal therapy and immunotherapy, the latest advances in medical mycology, treating mycosis, fungal meningitis. |
|
 Environmental, Social, and Corporate Governance
|
|
Illustrate easily the key points of ESG, diversity of ESG criteria, risks, factors, principles of sustainability, waste management, supply chain management, and standards to protect the environment, avoid climate change and biodiversity loss. Outline policies of the companies that adhere to ESG standards to help investors assess risks and make profitable investments. |
|
 Sustainable Development
|
|
Design and implement effectively the principles of sustainable development and social sustainability, construction a smart city and introduction sustainable agriculture, depict the UN sustainable development goals, illustrate the sources of green energy and sustainable energy. |
|
 Green Energy
|
|
Apply solution tools to design colorful green energy infographics and illustrations about solar power, wind power, hydropower, tidal power, and more types of renewable energy and cleaner energy. Illustrate the principle of work of energy generation equipment including how do solar panels work. |
|
 Energy Industry Infographics
|
|
Easily create energy-related business infographics, diagrams, and illustrations using predesigned energy icons and industry symbols. Create professionally-designed electrical power industry diagrams, energy distribution schematics, electrical substation diagram, energy intelligence dashboards, electricity grid schematics for documents and presentations. Large collection of included industry icons is indispensable for all professionals working in energy industry. |
|
 Oil and Gas
|
|
Use this solution to design oil and gas industry infographics, illustrations, presentations, diagrams, reports. Construct oil and gas graphics, illustrate the growth strategies and trends in the oil industry, results of energy forums. Make analysis and generate forecasts in the energy industry using the pre-made oil and gas symbols. |
|
 Medical Virology
|
|
Design high-quality illustrations and diagrams on the medical virology and immunology topics, infographics and charts according infection and treatment the viral infection, vaccination against infectious diseases, immunization and obtaining herd immunity, presentation slides on microbiology researches, actual virology problems, and the development of effective vaccines. |
|
 Politics Infographics
|
|
Focus on the visuality in political science, make attractive, creative and effective politics infographics, diagrams, presentations, illustrations, outline the main points of programs of political parties, country's foreign policy, identity politics, illustrate and present political polls results, or depict political news easily with solution’s tools. |
|
 Project Diagrams
|
|
Succeed in implementation your projects and designing the Project Diagrams of different kinds, Hierarchical Charts, Influence Diagrams, Work Breakdown Structure, Organization Breakdown Structure, Resource Breakdown Structure, PERT Chart, PERT Diagram, Project Management Chart, Project Network Diagram, Network Diagram Project Management, Project Timeline, Precedence Diagram, Gantt Diagram, Gantt Chart with ConceptDraw’s Project Diagrams solution. |
|
 Kanban Board
|
|
Apply the Kanban Board solution to experience all advantages of the Kanban approach and Kanban board agile project management. Start with Kanban Board example, depict the Kanban flow on your own Kanban Task Board and improve your workflow efficiency and personal effectiveness. |
|
 Genogram
|
|
Use the ConceptDraw’s Genogram solution to construct the informative Genograms, family tree, genealogy schematics of any generations’ depth, which are going to become a perfect base for medical and psychology analytics and therapy. |
|
 Health Package
|
|
12 solutions, 105 libraries, 2 843 vector objects and pictograms, 134 examples and templates.
Graphics Package includes solutions:
Allergology, Immunology, Medical Virology, Human Anatomy, Pharmacy Illustrations, Health Sciences, Medical Illustrations, Biomedicine, Medical Mycology, Healthcare Management Workflow Diagrams, Health Food, Genogram.
$444 value for only $180 |
|
 Business Diagrams
|
|
Build and develop your business easily and with pleasure, describe the business processes, visualize the results of company’s work, compare and analyze the business characteristics and economic indicators, and track your business development in dynamics with the help of Business Diagrams Solution and Bubble Diagrams, Circle-Spoke Diagrams, Circular Arrows Diagrams, and Venn Diagrams that are designed with its help in just minutes. |
|
 Business Management Package
|
|
26 solutions, 182 libraries, 4 781 vector objects and pictograms, 353 examples and templates.
Graphics Package includes solutions:
Business Intelligence Dashboard, Management Infographics, Logistic Dashboard, Education Infographics, Landscape and Garden, Financial Infographics, Business Process Workflow Diagrams, Cooking Recipes, Health Food, Marketing Infographics, 25 Typical Orgcharts, HR Flowcharts, Stakeholder Onion Diagrams, CRM Center Dashboard, Funnel Diagrams, Scrum Workflow, Seven Basic Tools of Quality, HR Dashboard, Area Charts, Bar Graphs, Pie Charts, Line Graphs, Divided Bar Diagrams, Histograms, Picture Graphs, Scatter Diagrams.
$917 value for only $367 |
|
 Business Diagrams Package
|
|
20 solutions, 128 libraries, 3 590 vector objects and pictograms, 278 examples and templates.
Graphics Package includes solutions:
Management Infographics, Education Infographics, Financial Infographics, Business Process Workflow Diagrams, Marketing Infographics, 25 Typical Orgcharts, HR Flowcharts, Stakeholder Onion Diagrams, Funnel Diagrams, Seven Basic Tools of Quality, Cooking Recipes, Health Food, Area Charts, Bar Graphs, Pie Charts, Line Graphs, Divided Bar Diagrams, Histograms, Picture Graphs, Scatter Diagrams.
$573 value for only $230 |
|
 Education Package
|
|
11 solutions, 29 libraries, 599 vector object and icons, 151 examples and templates.
Graphics Package includes solutions:
Education Infographics, Business Intelligence Dashboard, Business Diagrams, Area Charts, Bar Graphs, Divided Bar Diagrams, Histograms, Line Graphs, Picture Graphs, Pie Charts, Scatter Diagrams.
$398 value for only $160 |
|
 Landscape & Garden
|
|
A solution for all budding horticulturalists. Before you start tearing up your lawn, use the Landscape & Garden solution to visualize a potential garden design or theme. |
|
 Cafe and Restaurant Floor Plans
|
|
Before you commit to a restaurant design, use ConceptDraw to visualize your dining area and kitchen. The best culinary experience comes from detailed planning. |
|
