- Electric and Telecom Plans Free
- Fire and Emergency Plans Free
- Floor Plans Free
- Plant Layout Plans Free
- School and Training Plans Free
- Seating Plans Free
- Security and Access Plans Free
- Site Plans Free
- Sport Field Plans Free
- Business Process Diagrams Free
- Business Process Mapping Free
- Classic Business Process Modeling Free
- Cross-Functional Flowcharts Free
- Event-driven Process Chain Diagrams Free
- IDEF Business Process Diagrams Free
- Logistics Flow Charts Free
- Workflow Diagrams Free
- ConceptDraw Dashboard for Facebook Free
- Mind Map Exchange Free
- MindTweet Free
- Note Exchange Free
- Project Exchange Free
- Social Media Response Free
- Active Directory Diagrams Free
- AWS Architecture Diagrams Free
- Azure Architecture Free
- Cisco Network Diagrams Free
- Cisco Networking Free
- Cloud Computing Diagrams Free
- Computer Network Diagrams Free
- Google Cloud Platform Free
- Interactive Voice Response Diagrams Free
- Network Layout Floor Plans Free
- Network Security Diagrams Free
- Rack Diagrams Free
- Telecommunication Network Diagrams Free
- Vehicular Networking Free
- Wireless Networks Free
- Comparison Dashboard Free
- Composition Dashboard Free
- Correlation Dashboard Free
- Frequency Distribution Dashboard Free
- Meter Dashboard Free
- Spatial Dashboard Free
- Status Dashboard Free
- Time Series Dashboard Free
- Basic Circle-Spoke Diagrams Free
- Basic Circular Arrows Diagrams Free
- Basic Venn Diagrams Free
- Block Diagrams Free
- Concept Maps Free
- Family Tree Free
- Flowcharts Free
- Basic Area Charts Free
- Basic Bar Graphs Free
- Basic Divided Bar Diagrams Free
- Basic Histograms Free
- Basic Line Graphs Free
- Basic Picture Graphs Free
- Basic Pie Charts Free
- Basic Scatter Diagrams Free
- Aerospace and Transport Free
- Artwork Free
- Audio, Video, Media Free
- Business and Finance Free
- Computers and Communications Free
- Holiday Free
- Manufacturing and Maintenance Free
- Nature Free
- People Free
- Presentation Clipart Free
- Safety and Security Free
- Analog Electronics Free
- Audio and Video Connectors Free
- Basic Circuit Diagrams Free
- Chemical and Process Engineering Free
- Digital Electronics Free
- Electrical Engineering Free
- Electron Tube Circuits Free
- Electronic Block Diagrams Free
- Fault Tree Analysis Diagrams Free
- GHS Hazard Pictograms Free
- Home Automation and Wiring Free
- Mechanical Engineering Free
- One-line Diagrams Free
- Power Сircuits Free
- Specification and Description Language (SDL) Free
- Telecom and AV Circuits Free
- Transport Hazard Pictograms Free
- Data-driven Infographics Free
- Pictorial Infographics Free
- Spatial Infographics Free
- Typography Infographics Free
- Calendars Free
- Decision Making Free
- Enterprise Architecture Diagrams Free
- Fishbone Diagrams Free
- Organizational Charts Free
- Plan-Do-Check-Act (PDCA) Free
- Seven Management and Planning Tools Free
- SWOT and TOWS Matrix Diagrams Free
- Timeline Diagrams Free
- Australia Map Free
- Continent Maps Free
- Directional Maps Free
- Germany Map Free
- Metro Map Free
- UK Map Free
- USA Maps Free
- Customer Journey Mapping Free
- Marketing Diagrams Free
- Matrices Free
- Pyramid Diagrams Free
- Sales Dashboard Free
- Sales Flowcharts Free
- Target and Circular Diagrams Free
- Cash Flow Reports Free
- Current Activities Reports Free
- Custom Excel Report Free
- Knowledge Reports Free
- MINDMAP Reports Free
- Overview Reports Free
- PM Agile Free
- PM Dashboards Free
- PM Docs Free
- PM Easy Free
- PM Meetings Free
- PM Planning Free
- PM Presentations Free
- PM Response Free
- Resource Usage Reports Free
- Visual Reports Free
- House of Quality Free
- Quality Mind Map Free
- Total Quality Management TQM Diagrams Free
- Value Stream Mapping Free
- Astronomy Free
- Biology Free
- Chemistry Free
- Language Learning Free
- Mathematics Free
- Physics Free
- Piano Sheet Music Free
- Android User Interface Free
- Class Hierarchy Tree Free
- Data Flow Diagrams (DFD) Free
- DOM Tree Free
- Entity-Relationship Diagram (ERD) Free
- EXPRESS-G data Modeling Diagram Free
- IDEF0 Diagrams Free
- iPhone User Interface Free
- Jackson Structured Programming (JSP) Diagrams Free
- macOS User Interface Free
- Object-Role Modeling (ORM) Diagrams Free
- Rapid UML Free
- SYSML Free
- Website Wireframe Free
- Windows 10 User Interface Free
Agriculture Infographics
Agriculture includes the entire chain of processes from cultivating soil, growing and harvesting crops, and raising animals to producing food, logistics, and supply for human consumption worldwide. It is crucial to human society, global economics, and environmental sustainability. Agriculture supports local economies and helps address global food security, environmental, and climate change issues. With a growing global population, these issues are particularly important because meeting nutritional needs and ensuring consistent and reliable food production are essential tasks.
Currently, agriculture combines both traditional farming methods and modern innovative techniques, biotechnology, and sustainable practices to meet the needs of current and future generations. It involves collaboration and coordination with other sectors to provide high-quality, safe, and nutritious products while simultaneously protecting the environment. Scientists are working on reducing waste and the negative environmental impact, using resources efficiently, conserving water and soil health, adapting to climate changes that create risks to agriculture and harvest yields, and promoting biodiversity for future generations.
Agricultural methods include organic farming, agroecological and biotechnology techniques, integrated pest management, crop rotation, selection of resistant varieties, reducing the use of harmful chemicals, optimizing fertilizer use, water-efficient practices like drip irrigation, climate-smart methods, digital farming, enhancing biodiversity, preserving natural habitats, and integrating renewable energy. These methods help ensure the long-term viability and sustainability of farming ecosystems and avoid soil degradation, water contamination, and loss of biodiversity.
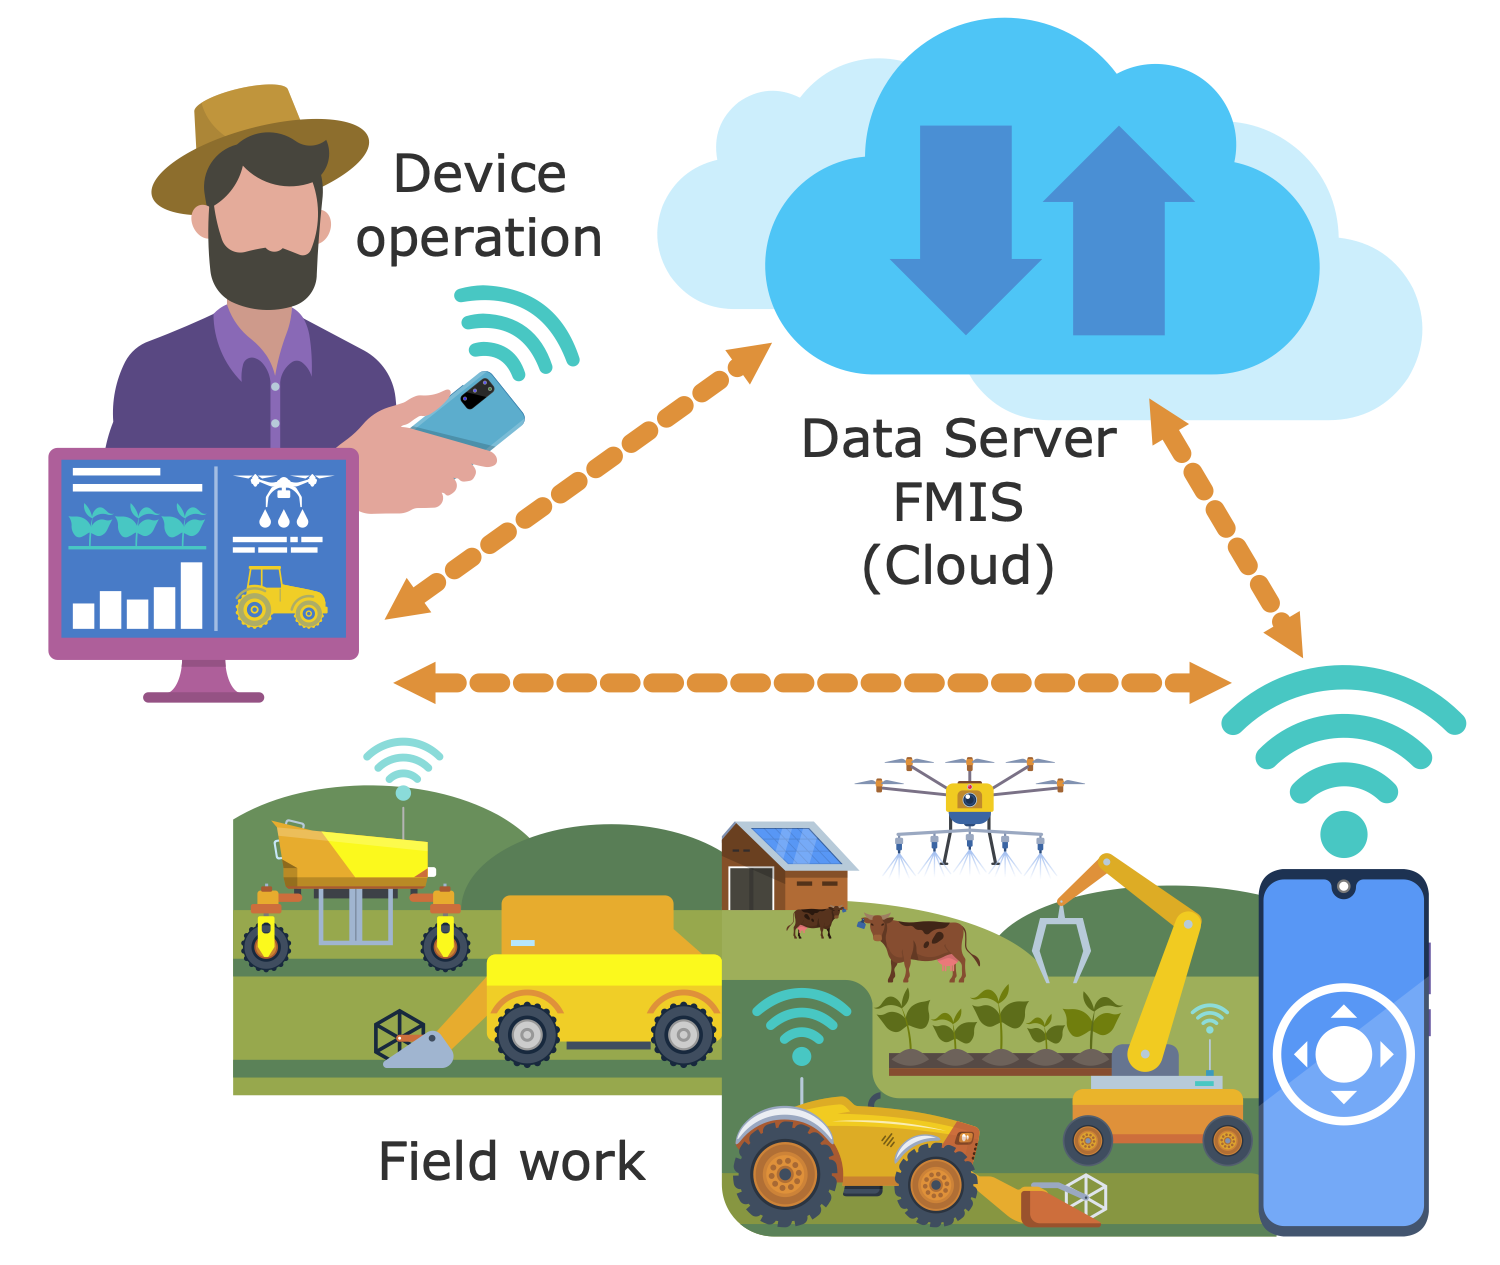
Infographics and diagrams are powerful tools for presenting agriculture-related information, outlining innovative sustainable technologies and methods, and producing safe and high-quality agricultural products that meet health standards and consumer preferences. They help minimize environmental impacts, optimize the use of natural resources in agricultural production, promote rural development, and support economic growth. Agriculture and farming infographics and diagrams simplify the representation and understanding of complex concepts for farmers, agronomists, educators, scientists, politicians, and other stakeholders. They can illustrate strategies for pest control and enhancing soil fertility, irrigation methods, evaluating the effectiveness of agricultural interventions, comparing organic and chemical treatments, and steps to select the right crops. Infographics and agriculture graphics are ideal for outlining essential concepts, the advantages and disadvantages of different technologies, and enhancing decision-making and implementation of innovative agricultural technologies.
ConceptDraw DIAGRAM enhanced with the Agriculture Infographics solution is a powerful agriculture design software and the best way to present complex information in a simple form, communicate knowledge, ideas, and critical information clearly and efficiently, and facilitate its use in education and training programs, practical agriculture, communication, marketing, and sales. It provides access to a large set of pre-made samples and numerous libraries with vector design elements and agriculture icons related to food, including fruits, berries, vegetables, grains, beans, herbs, spices, beekeeping and dairy products, and other items, as well as farming icons and icons for animals, birds, pests, farmers, industrial vehicles, and weather. This makes it simple to design agricultural infographics and illustrations, farming diagrams, and presentations. Use them to show step-by-step agricultural processes from crop planting to harvesting and post-harvest handling, outline the growth stages of crops, illustrate natural cycles and ecosystem dynamics, resource usage, crop distribution, food safety regulations, represent quantitative data and market trends, compare different agricultural practices, support farmers in selecting crop varieties by highlighting their advantages and disadvantages, and consider soil type and climate zone.
-
Buy this solution $49 -
Solution Requirements - This solution requires the following products to be installed:
ConceptDraw DIAGRAM v18 - This solution requires the following products to be installed:
-
Support for this Solution -
Helpdesk
This solution provides 18 stencil libraries containing 459 vector objects and 14 drawing examples is the best way to present complex information in a simple form, communicate knowledge, ideas, and critical information clearly.
Design Elements — Agriculture

Design Elements — Animal Husbandry

Design Elements — Agricultural Machinery

Design Elements — Beekeeping

Design Elements — Berry Farming

Design Elements — Dairy Farm

Design Elements — Environmental Factors

Design Elements — Farm

Design Elements — Farmers

Design Elements — Grain Crop

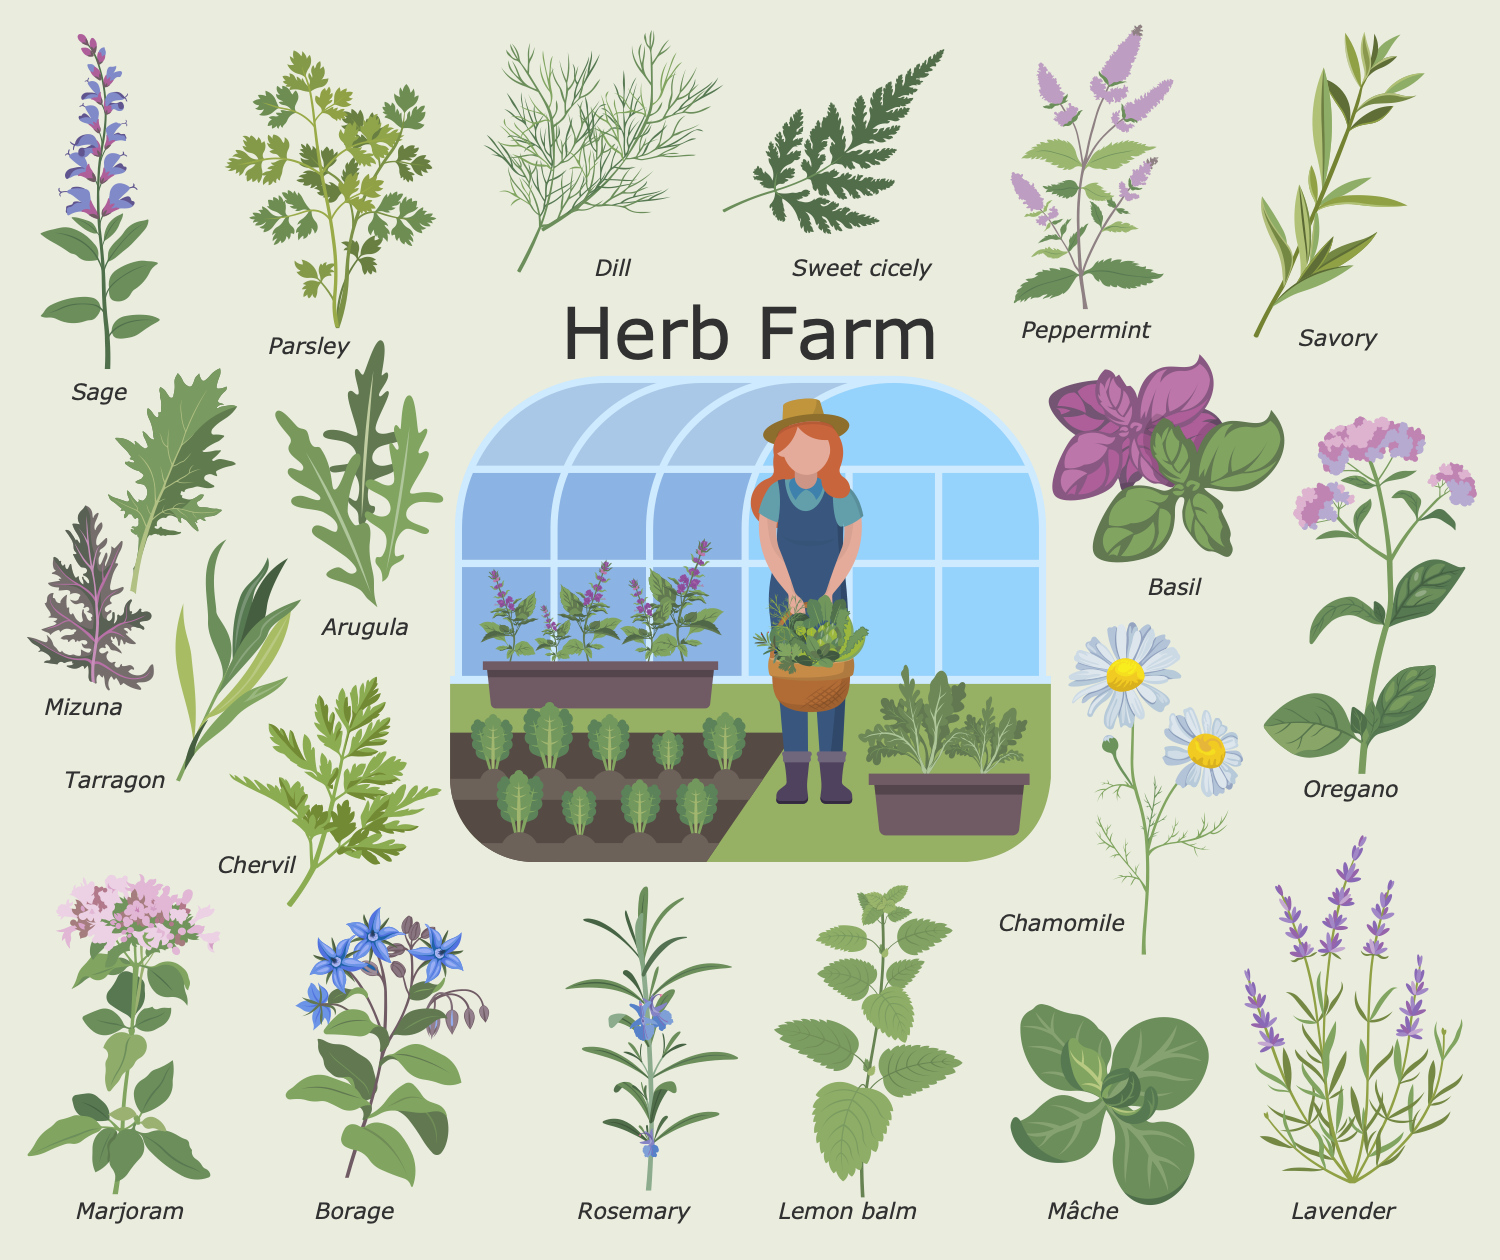
Design Elements — Herb Farm

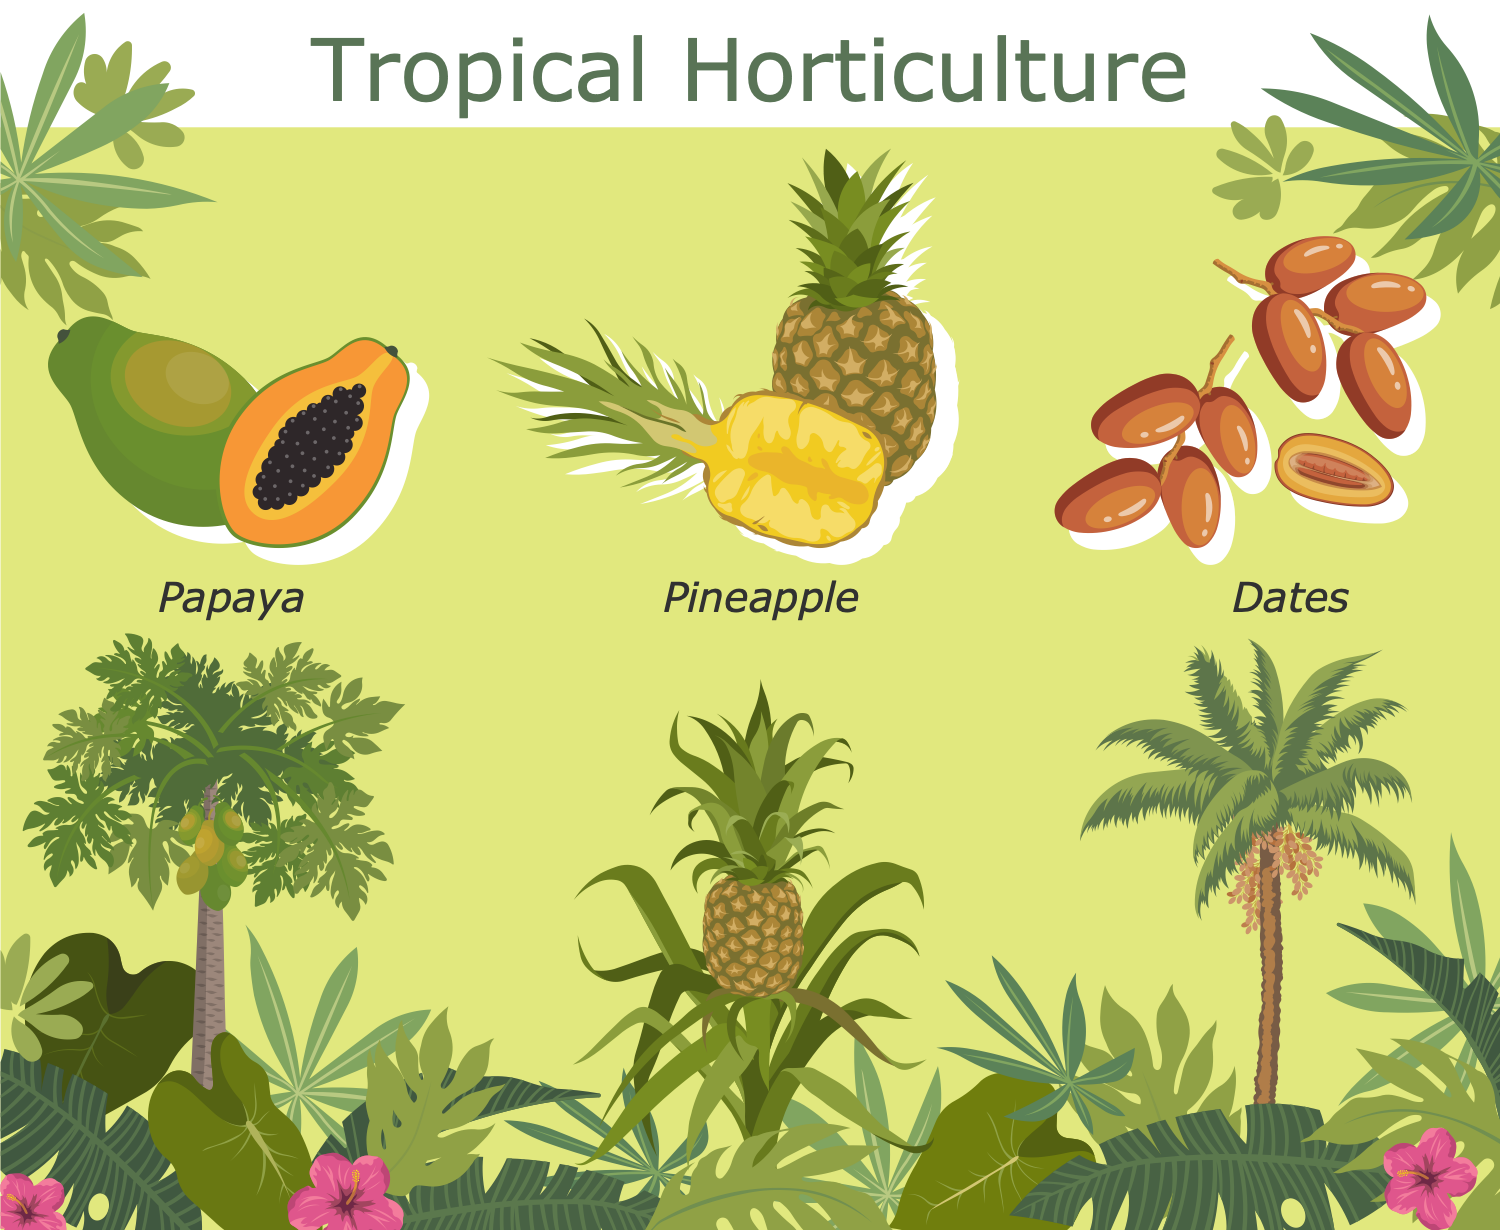
Design Elements — Horticulture

Design Elements — Land Cultivation

Design Elements — Leguminous Crop

Design Elements — Pest Control

Design Elements — Poultry Farming

Design Elements — Tropical Agriculture

Design Elements — Vegetable Farming

Agriculture Infographics Examples
There are a few samples that you see on this page which were created in the ConceptDraw DIAGRAM application by using the Agriculture Infographics solution. Some of the solution's capabilities as well as the professional results which you can achieve are all demonstrated here on this page.
All source documents are vector graphic documents which are always available for modifying, reviewing and/or converting to many different formats, such as MS PowerPoint, PDF file, MS Visio, and many other graphic ones from the ConceptDraw Solution Park or ConceptDraw STORE. The Agriculture Infographics solution is available to all ConceptDraw DIAGRAM users to get installed and used while working in the ConceptDraw DIAGRAM.
Example 1: Aeroponics and Hydroponics
This diagram was created in ConceptDraw DIAGRAM using the combination of libraries from the Agriculture Infographics Solution. An experienced user spent 10 minutes creating this sample.
Aeroponics and hydroponics are two innovative technologies for planting without soil, using nutrient-rich water and air instead. These methods have gained popularity due to their efficiency, sustainability, and ability to produce crops year-round and in diverse environments, even when traditional farming is impossible due to unsuitable or nutrient-poor soil. Vertical aeroponic systems are ideal for space-limited environments and urban agriculture. Plants are placed so that their roots hang freely in the air and are misted with a nutrient-rich solution through nozzles or atomizers at regular intervals. In hydroponics, plants are grown in a solid medium like perlite, rock wool, clay pellets, or coconut coir, and their roots are regularly exposed to a nutrient solution using drip, ebb, flow, or wicking systems. Both systems ensure rapid plant growth by providing an optimal balance of nutrients directly to the roots. Hydroponics is more widespread, universal, and accessible even for beginners, while aeroponics requires more technical expertise, equipment, and a controlled environment; however, it is more water-efficient.

Example 2: Beekeeping Products
This diagram was created in ConceptDraw DIAGRAM using the combination of libraries from the Agriculture Infographics Solution. An experienced user spent 5 minutes creating this sample.
Beekeeping is an ancient practice of maintaining bee colonies to collect various products of their lives and hard work. The history of beekeeping began thousands of years ago. Currently, artificial beehives are most commonly used. This agriculture diagram shows some of the diverse beekeeping products resulting from pollination, including honey, propolis, bee pollen, bee bread, beeswax, and royal jelly. These are natural and incredibly useful products for different industries: food, health, medicine, pharmaceuticals, cosmetics, and others. Honey is the most well-known and used beekeeping product, a nourishing natural sweet made by bees from flower nectar and valued for its medicinal properties. However, other beekeeping products are also valuable. Propolis is antibacterial, antifungal, and antiviral. Bee pollen helps support the immune system, improve digestion, and boost energy. Royal jelly supports the immune system and provides anti-aging properties when used in skincare products. Beeswax is used in candle-making, and in the cosmetic and pharmaceutical industries.

Example 3: Berry Farm
This diagram was created in ConceptDraw DIAGRAM using the combination of libraries from the Agriculture Infographics Solution. An experienced user spent 5 minutes creating this sample.
This example is one of the agriculture diagrams easily designed in ConceptDraw DIAGRAM agriculture design application. It shows a wide range of berries. These are small edible fruits of different colors and textures, typically with many tiny seeds. Here, you can see some of them, including strawberries, blueberries, blackberries, raspberries, cranberries, gooseberries, blackcurrants, lingonberries, red currants, white currants, bog bilberries, and rosehips. All of them are delicious, and their flavors and tastes differ, offering people a choice for their preferences. Berries are juicy, sweet, sour, or tart. They are rich in nutrients, vitamins, minerals, and antioxidants, making them a popular choice for healthy nutrition and a valuable addition to any diet. Berries are consumed fresh, dried, and cooked. They combine well with other products and are suitable for a wide variety of dishes, including desserts, sauces, meat, fish, and vegetable dishes. Berries are also juiced and fermented into wine.

Example 4: Concentrated Animal Feeding Operations
This diagram was created in ConceptDraw DIAGRAM using the combination of libraries from the Agriculture Infographics Solution. An experienced user spent 5 minutes creating this sample.
This sample illustrates the system of concentrated animal feeding operations (CAFOs), which is an alternative to traditional grazing systems. The main products of the industry are meat, milk, and eggs for human consumption. It is a high-input, high-output system of animal husbandry, which causes many disputes about efficiency, benefits, health risks, environmental impact, animal welfare, and ethics, as these animals are kept confined for over 45 days a year. Proper waste management is also crucial because CAFOs generate millions of tons of manure annually, and harmful pollutants pose substantial risks to the environment, water quality, and public health. The waste includes soluble nitrogen compounds and phosphorus, pathogens and bacteria, salts, pesticides, hormones, antibiotics, organic matter, solids, harmful trace elements, and odorous or volatile compounds such as methane, hydrogen sulfide, carbon dioxide, ammonia, and arsenic.

Example 5: Dairy Animals
This diagram was created in ConceptDraw DIAGRAM using the combination of libraries from the Agriculture Infographics Solution. An experienced user spent 5 minutes creating this sample.
This farm diagram example shows cattle such as cows, sheep, goats, yaks, water buffaloes, camels, horses, reindeer, and the dairy products manufactured from their milk. Dairy farming is a large field of agriculture involved in raising cattle, collecting raw milk, and processing it into various dairy products for commercial sale. Dairy products are consumed daily worldwide and include milk, butter, cream, cheese, yogurt, and other country-specific products. The milk-producing animals were domesticated thousands of years ago. Currently, dairy manufacturing is extensive, with numerous mechanized dairy plants equipped with milking machines and milk-storage facilities. These facilities heat-treat raw milk to ensure its safety for human consumption and extend its shelf life. Special processes and technologies are implemented in dairy product production. The structure of the dairy industry may vary slightly in different countries, but the key principles are the same, and strict control is executed at each step to ensure high-quality production.

Example 6: Grain Crops
This diagram was created in ConceptDraw DIAGRAM using the combination of libraries from the Agriculture Infographics Solution. An experienced user spent 5 minutes creating this sample.
The grain market is a major global commodity market because grain crops are essential agricultural products and basic food for billions of people worldwide. They also serve as raw materials for numerous other products, including animal feed. Grain crops are cultivated for their edible grains or seeds, which are rich in nutrients, carbohydrates, and proteins. Grain crops can be eaten as whole grains or ground and processed in various ways. They are milled into flour, pressed for oil, and fermented into alcoholic drinks such as beer. This example shows a selection of significant grain crops, including wheat, barley, oat, rice, sunflower, maize, buckwheat, quinoa, sorghum, amaranth, emmer, millet, foxtail millet, rape, and rye. Most cereals are annuals, produce one crop, are highly adaptable to different environments, and can be stored long-term after harvesting. Each farm crop icon used in this sample is taken as-is from pre-made libraries of the Agriculture Infographics solution.

Example 7: Integrated Farming
This diagram was created in ConceptDraw DIAGRAM using the combination of libraries from the Agriculture Infographics Solution. An experienced user spent 5 minutes creating this sample.
This sample describes key points of the integrated farming approach, a holistic, balanced, and sustainable agriculture and farm management system. Integrated farming relates to organic and bio farms and combines innovative methods, tools, practices, and technologies with traditional agricultural techniques to ensure a more efficient, productive, high-quality, and environmentally friendly farm. A key focus is on a holistic approach, considering the farm and its environmental surroundings as a single whole. The approach aims to maximize resource use, increase farm capacity and resilience, ensure high-quality agricultural products, preserve and enhance soil fertility, improve biodiversity, and account for the individual characteristics of the site and other factors. Integrated farming adapts to the demands of specific crops and includes good organization and management, crop protection, rotation and variety selection, precision agriculture, waste management, organic farming, and integrating renewable energy sources, all while maintaining a focus on economic feasibility and efficiency.

Example 8: Nitrogen Cycle
This diagram was created in ConceptDraw DIAGRAM using the combination of libraries from the Agriculture Infographics Solution. An experienced user spent 10 minutes creating this sample.
Nitrogen is an essential component for both animals and plants. It exists in living organisms being a component of proteins and nucleic acids. The atmosphere comprises 78 percent of inorganic nitrogen gas. This sustainable agriculture infographic shows the nitrogen cycle — the process of circulation of nitrogen from the atmosphere to the soil and organisms and back into the atmosphere, which includes the steps of fixation, assimilation, ammonification, nitrification, and denitrification. When passing these steps, nitrogen undergoes various types of transformation and is converted into many forms. During the nitrogen fixation process, nitrogen is converted into ammonia. Then, at the nitrification step, ammonia is converted into nitrate with the help of Nitrosomonas bacteria in the soil. At the assimilation stage, plants absorb the nitrogen compounds from the soil by roots and use them to build proteins, amino acids, and nucleic acids. Ammonification refers to the release of organic nitrogen from dead plants, animals, and waste products back into the soil, where it is converted into ammonium and ammonia by bacteria and fungi present in the soil. At the final stage of denitrification, nitrate is converted into gaseous nitrogen by bacterial species Clostridium and Pseudomonas and is released back into the atmosphere.

Example 9: Pathways of Pesticide Movement in the Hydrologic Cycle
This diagram was created in ConceptDraw DIAGRAM using the combination of libraries from the Agriculture Infographics Solution. An experienced user spent 10 minutes creating this sample.
Pesticides are chemicals used in agriculture to protect crops from various pests that can damage and decrease yield. These include insects, fungi, rodents, and weeds as well. This sample shows the pathways of pesticide movement in the hydrologic cycle. Currently, this is a really important issue because using pesticides can cause significant environmental problem. In addition, the overuse of these strong chemicals can lead to pest resistance. Unintentional diffusion or drift of pesticides in the hydrologic cycle contaminates soil, water, and air, and is harmful to the environment, crops, biodiversity, beneficial insects, birds, animals, fish, and human health. Pesticides can cause a range of health problems, such as respiratory and skin diseases, neurological disorders, and others. Therefore, the key aim of sustainable practices and pest management is to reduce pesticide use and improve control of their application. Agriculture diagrams and farm graphics are an illustrative way to show complex environmental issues and concepts, helping to solve them.

Example 10: Transformation of Calcium Cyanamide
This diagram was created in ConceptDraw DIAGRAM using the combination of libraries from the Agriculture Infographics Solution. An experienced user spent 10 minutes creating this sample.
This sample shows the process of transformation of calcium cyanamide to plant-available forms of nitrogen as a result of contact with water in the soil. Calcium cyanamide is an inorganic compound with properties of both effective slow-release nitrogen fertilizer and herbicide. When used as a fertilizer in agriculture, calcium cyanamide passes several stages. When it contacts with water, it hydrolyses into calcium hydroxide increasing soil pH and makes it more alkaline. Through hydrolysis in the presence of carbon dioxide, cyanamide is produced. It has both herbicide and pest-deterrent properties, and its further hydrolysis leads to forming urea, which in its turn is converted by soil bacteria into ammonium, oxidized by nitrifying bacteria into nitrite and nitrate, and in this form is easily absorbed by plants and supports their growth. Illustrate any agriculture infographics ideas, facts and concepts easily in ConceptDraw DIAGRAM agriculture drawing app.

More Examples and Templates

Inside

What I Need to Get Started
After ConceptDraw DIAGRAM is installed, the Agriculture Infographics solution can be purchased either from the Business Infographics area of ConceptDraw STORE itself or from our online store. Thus, you will be able to use the Agriculture Infographics solution straight after.

How to install
First of all, make sure that both ConceptDraw STORE and ConceptDraw DIAGRAM applications are downloaded and installed on your computer. Next, install the Agriculture Infographics solution from the ConceptDraw STORE to use it in the ConceptDraw DIAGRAM application.

Start using
Start using the Agriculture Infographics solution to make the professionally looking illustrations by adding the design elements taken from the stencil libraries and editing the pre-made examples that can be found there.
