- Electric and Telecom Plans Free
- Fire and Emergency Plans Free
- Floor Plans Free
- Plant Layout Plans Free
- School and Training Plans Free
- Seating Plans Free
- Security and Access Plans Free
- Site Plans Free
- Sport Field Plans Free
- Business Process Diagrams Free
- Business Process Mapping Free
- Classic Business Process Modeling Free
- Cross-Functional Flowcharts Free
- Event-driven Process Chain Diagrams Free
- IDEF Business Process Diagrams Free
- Logistics Flow Charts Free
- Workflow Diagrams Free
- ConceptDraw Dashboard for Facebook Free
- Mind Map Exchange Free
- MindTweet Free
- Note Exchange Free
- Project Exchange Free
- Social Media Response Free
- Active Directory Diagrams Free
- AWS Architecture Diagrams Free
- Cisco Network Diagrams Free
- Cisco Networking Free
- Cloud Computing Diagrams Free
- Computer Network Diagrams Free
- Google Cloud Platform Free
- Interactive Voice Response Diagrams Free
- Network Layout Floor Plans Free
- Network Security Diagrams Free
- Rack Diagrams Free
- Telecommunication Network Diagrams Free
- Vehicular Networking Free
- Wireless Networks Free
- Comparison Dashboard Free
- Composition Dashboard Free
- Correlation Dashboard Free
- Frequency Distribution Dashboard Free
- Meter Dashboard Free
- Spatial Dashboard Free
- Status Dashboard Free
- Time Series Dashboard Free
- Basic Circle-Spoke Diagrams Free
- Basic Circular Arrows Diagrams Free
- Basic Venn Diagrams Free
- Block Diagrams Free
- Concept Maps Free
- Family Tree Free
- Flowcharts Free
- Basic Area Charts Free
- Basic Bar Graphs Free
- Basic Divided Bar Diagrams Free
- Basic Histograms Free
- Basic Line Graphs Free
- Basic Picture Graphs Free
- Basic Pie Charts Free
- Basic Scatter Diagrams Free
- Aerospace and Transport Free
- Artwork Free
- Audio, Video, Media Free
- Business and Finance Free
- Computers and Communications Free
- Holiday Free
- Manufacturing and Maintenance Free
- Nature Free
- People Free
- Presentation Clipart Free
- Safety and Security Free
- Audio and Video Connectors Free
- Basic Circuit Diagrams Free
- Chemical and Process Engineering Free
- Digital Electronics Free
- Electrical Engineering Free
- Electron Tube Circuits Free
- Fault Tree Analysis Diagrams Free
- GHS Hazard Pictograms Free
- Home Automation and Wiring Free
- Mechanical Engineering Free
- Specification and Description Language (SDL) Free
- Transport Hazard Pictograms Free
- Data-driven Infographics Free
- Pictorial Infographics Free
- Spatial Infographics Free
- Typography Infographics Free
- Calendars Free
- Decision Making Free
- Enterprise Architecture Diagrams Free
- Fishbone Diagrams Free
- Organizational Charts Free
- Plan-Do-Check-Act (PDCA) Free
- Seven Management and Planning Tools Free
- SWOT and TOWS Matrix Diagrams Free
- Timeline Diagrams Free
- Australia Map Free
- Continent Maps Free
- Directional Maps Free
- Germany Map Free
- Metro Map Free
- UK Map Free
- USA Maps Free
- Customer Journey Mapping Free
- Marketing Diagrams Free
- Matrices Free
- Pyramid Diagrams Free
- Sales Dashboard Free
- Sales Flowcharts Free
- Target and Circular Diagrams Free
- Cash Flow Reports Free
- Current Activities Reports Free
- Custom Excel Report Free
- Knowledge Reports Free
- MINDMAP Reports Free
- Overview Reports Free
- PM Agile Free
- PM Dashboards Free
- PM Docs Free
- PM Easy Free
- PM Meetings Free
- PM Planning Free
- PM Presentations Free
- PM Response Free
- Resource Usage Reports Free
- Visual Reports Free
- House of Quality Free
- Quality Mind Map Free
- Total Quality Management TQM Diagrams Free
- Value Stream Mapping Free
- Android User Interface Free
- Data Flow Diagrams (DFD) Free
- Entity-Relationship Diagram (ERD) Free
- EXPRESS-G data Modeling Diagram Free
- IDEF0 Diagrams Free
- iPhone User Interface Free
- Jackson Structured Programming (JSP) Diagrams Free
- macOS User Interface Free
- Object-Role Modeling (ORM) Diagrams Free
- Rapid UML Free
- SYSML Free
- Website Wireframe Free
- Windows 10 User Interface Free
Medical Virology
Virology is a branch of microbiology dedicated to the study of viruses, which are the submicroscopic intracellular molecular parasites that reproduce only inside the cells of living organisms, as well as the virus-like agents, such as prions and viroids. It explores the structure of virions, types of viruses, classification, evolution, pathogenic properties, cultivation, genetics, methods of infection, interactions with the host organism, the ability to destroy host cells and to reproduce exploiting them, methods of diagnosis and therapy.
Virology is a science of great interest and is actively developing together with such modern sciences as microbiology, gene therapy, vaccinology, due to many human diseases caused by viruses. The number of viruses is increasing day by day, and new previously unknown viruses appear and require researching, finding medicines and vaccines against them.
The virology science is built literally entirely on images, illustrations, drawings, diagrams, sketches, snapshots, and pictures. These are the snapshots at a large magnification of a microscope, diagrams of viruses structure, schematics showing the ways in which viruses enter a living organism, visual representations of the connections between these microorganisms, environment and hosts which they infiltrated, illustrations depicting ways they enter living organisms, the stages that the microorganisms go through in their life cycle, diagrams devoted to the variety of viruses and methods of protection against them, protocols for diagnosis and treatment of virus infection, visuals describing methods of self-tracking, graphics reflecting forecasts and trends in medicine, newest digital technologies in microbiology, virology, and immunology. Being well designed and carefully thought-out medical and virology infographics are a powerful tool of spreading awareness, learning and marketing.
Medical Virology solution extends the functionality of ConceptDraw DIAGRAM with a large collection of medicine and virology vector design objects for designing high-quality illustrations, diagrams, infographics, charts on the medical virology, immunology, healthcare, epidemiology and virus pandemic topics, infection and treatment the viral infection and infectious diseases, vaccination and obtaining herd immunity, presentation slides, web pages and blog posts on microbiology researches, actual virology problems, developing effective vaccines, and immunization. The set of professionally designed samples is included and shows the solution’s power and its ease of use in medical and healthcare illustration design. It is the best solution for medical workers, virologists, microbiologists, immunity specialists, biotechnologists, viruses researchers, medical consultants, professors of medical sciences, lecturers of the medical institutions, health science specialists, marketers in medicine and healthcare field, journalists and editors of medical journals, and other people of medicine-related specialties.
-
Buy this solution $49 -
Solution Requirements - This solution requires the following products to be installed:
ConceptDraw DIAGRAM v18 - This solution requires the following products to be installed:
-
Compatibility - Sonoma (14), Sonoma (15)
MS Windows 10, 11 - Sonoma (14), Sonoma (15)
-
Support for this Solution -
Helpdesk
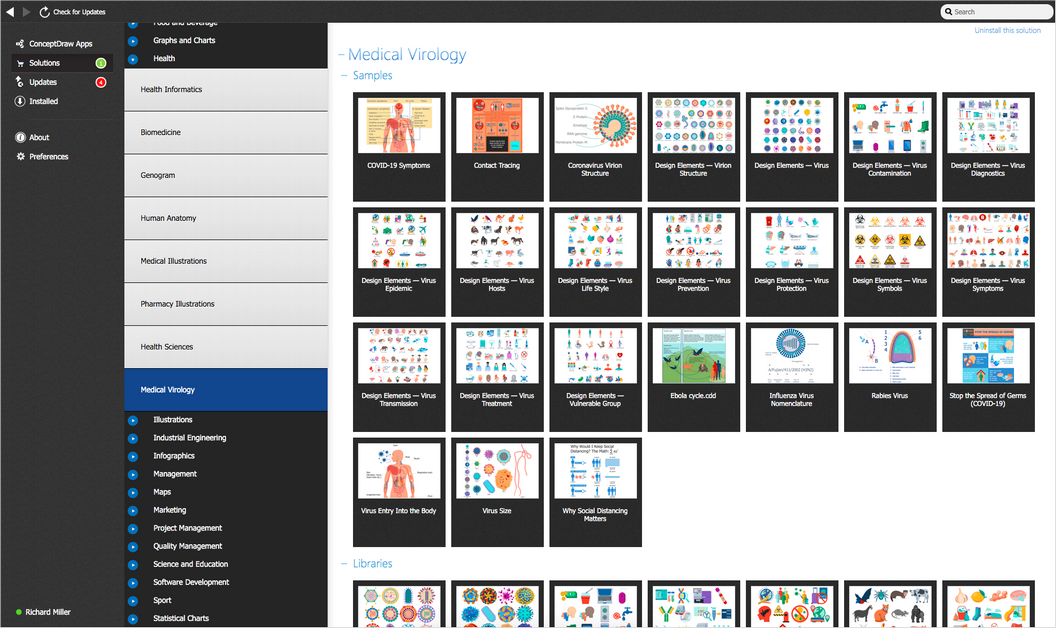
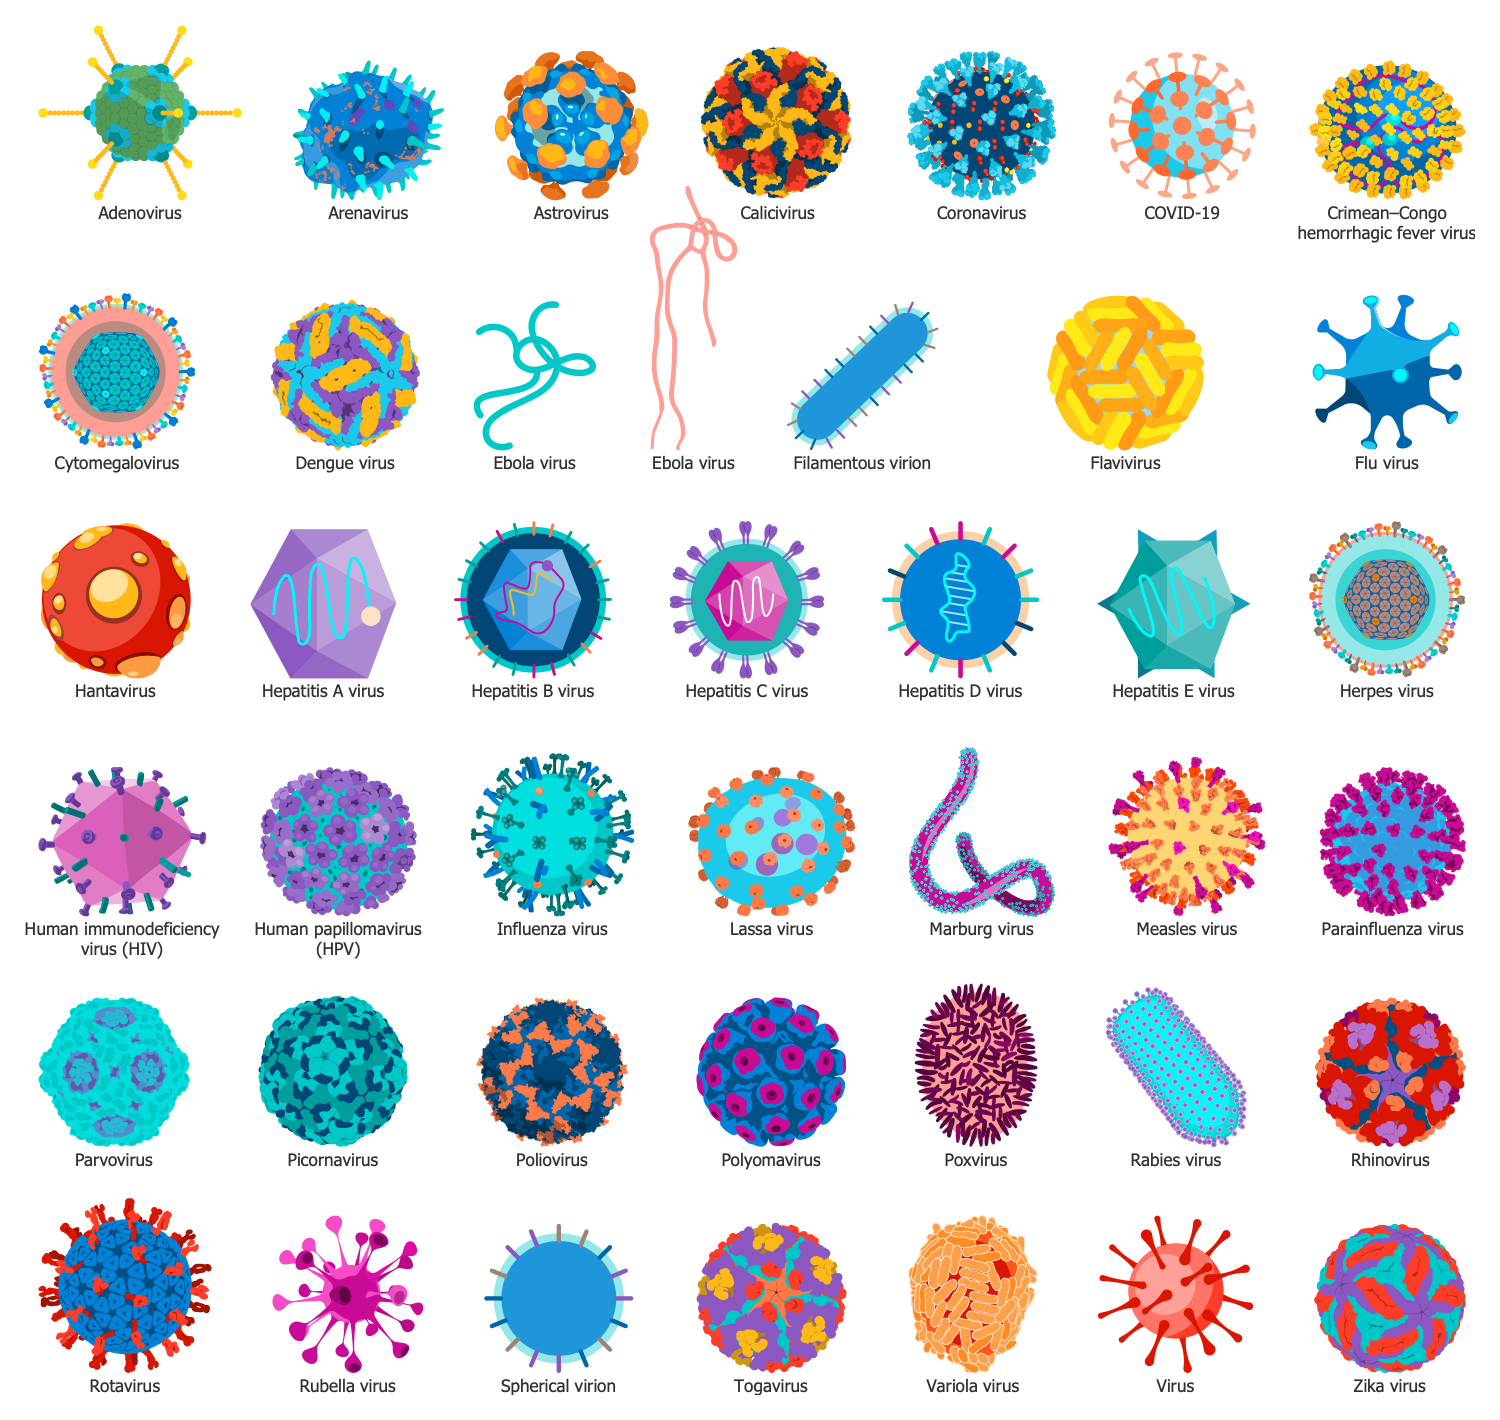
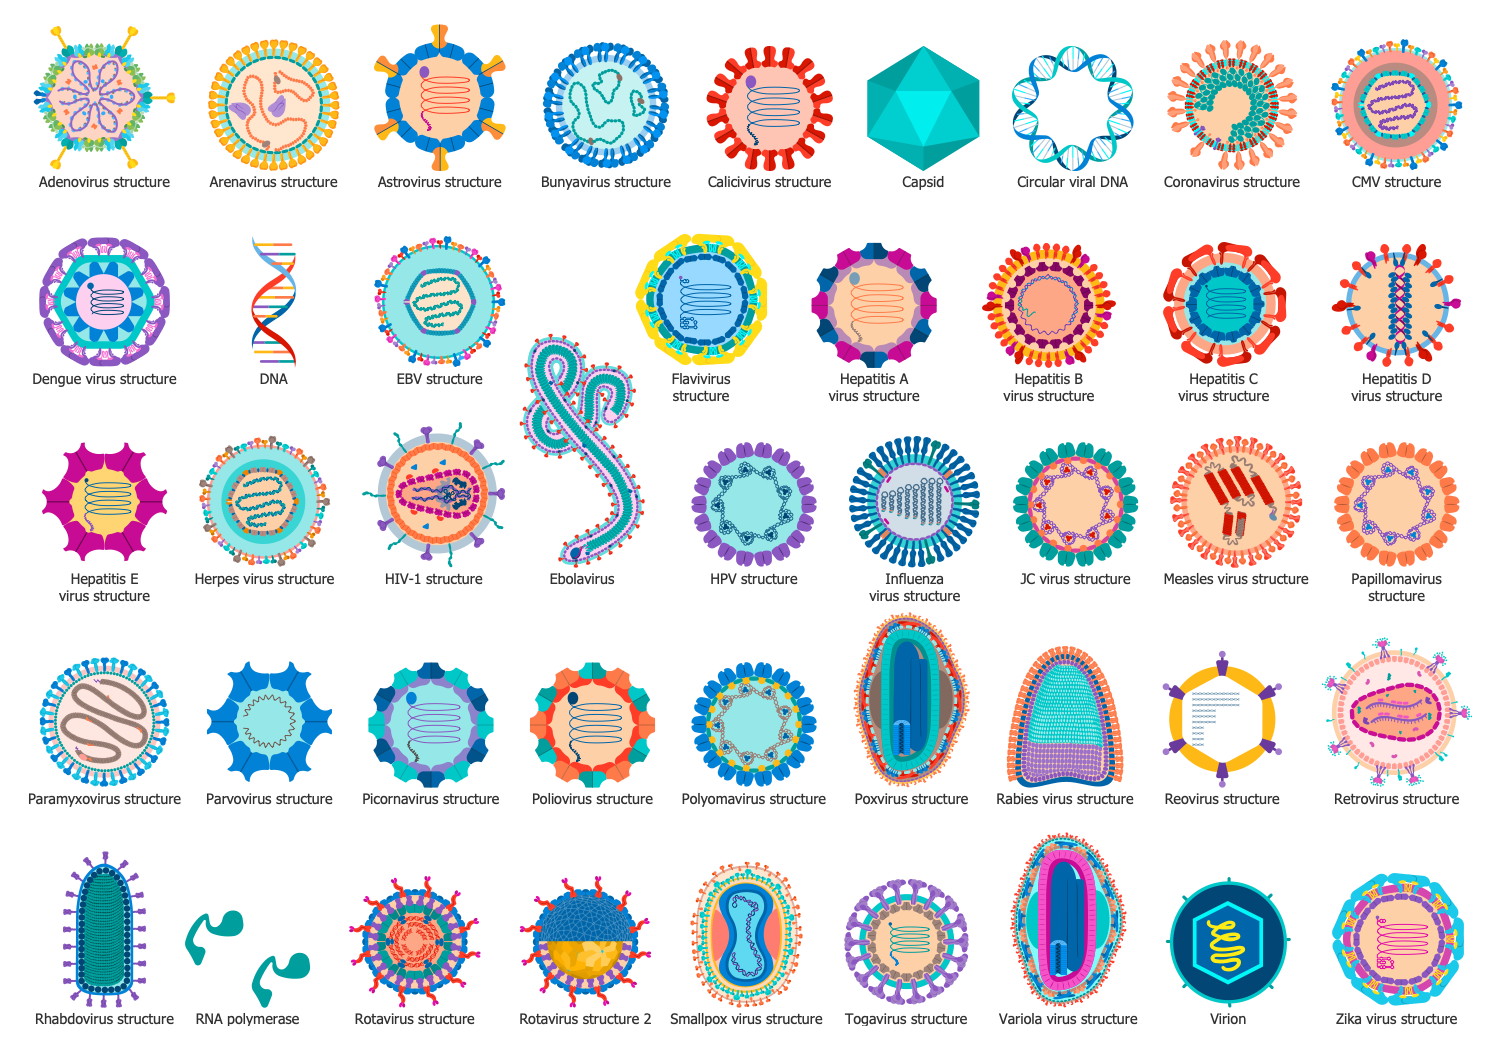
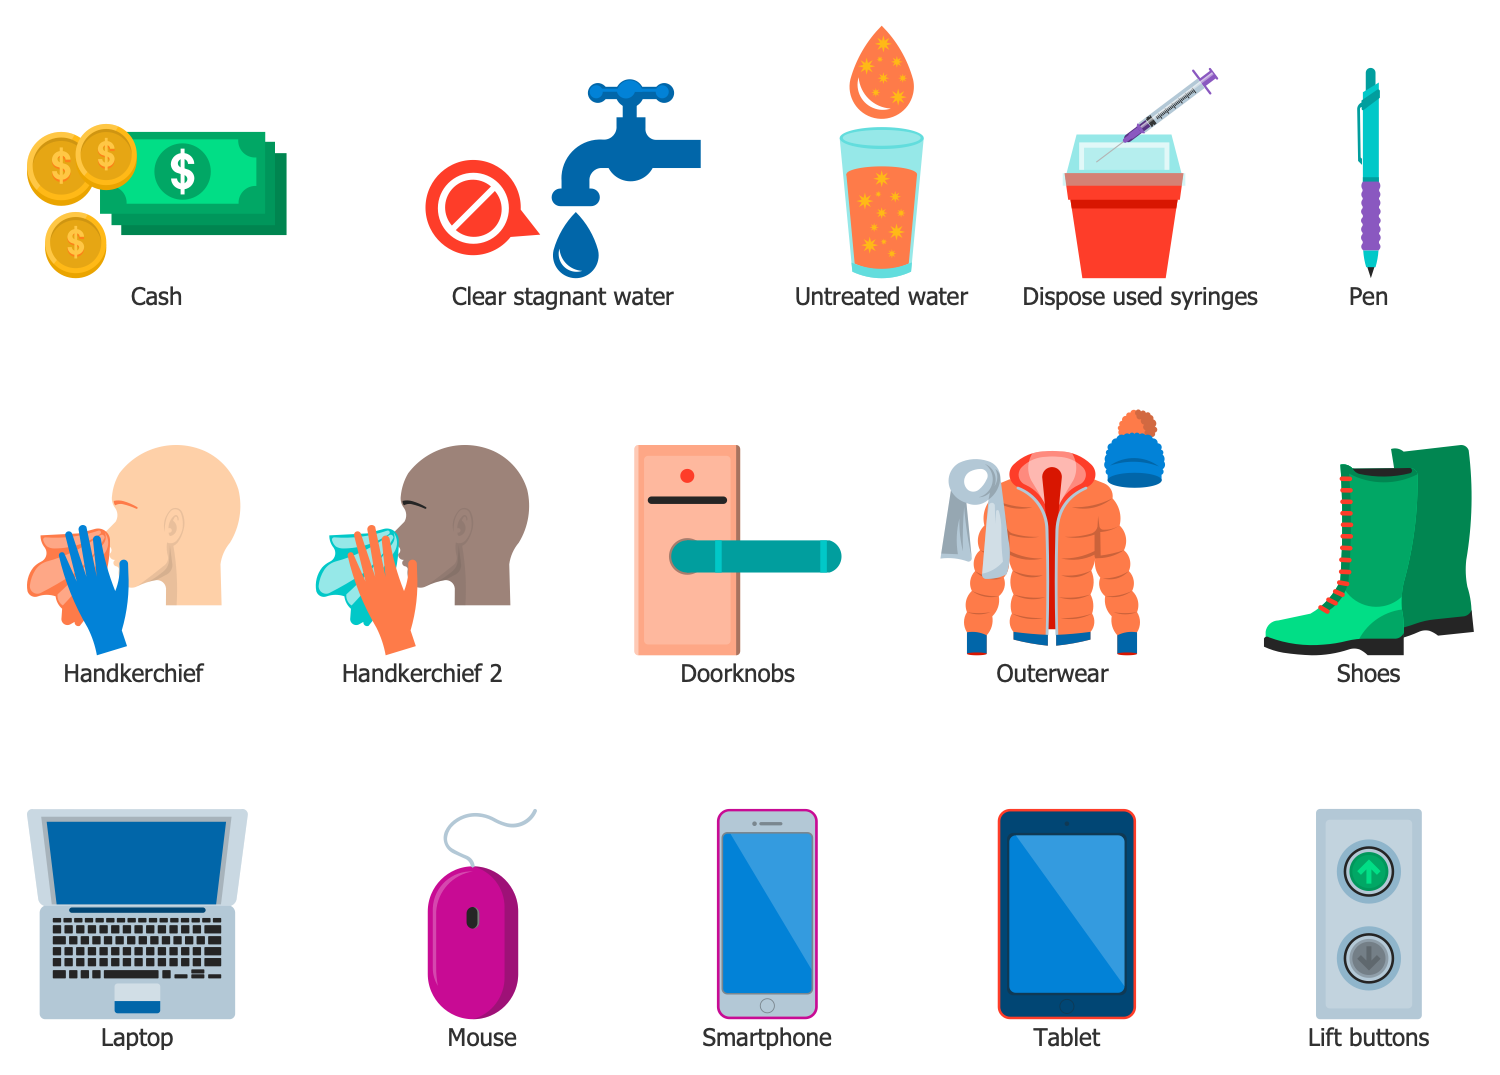
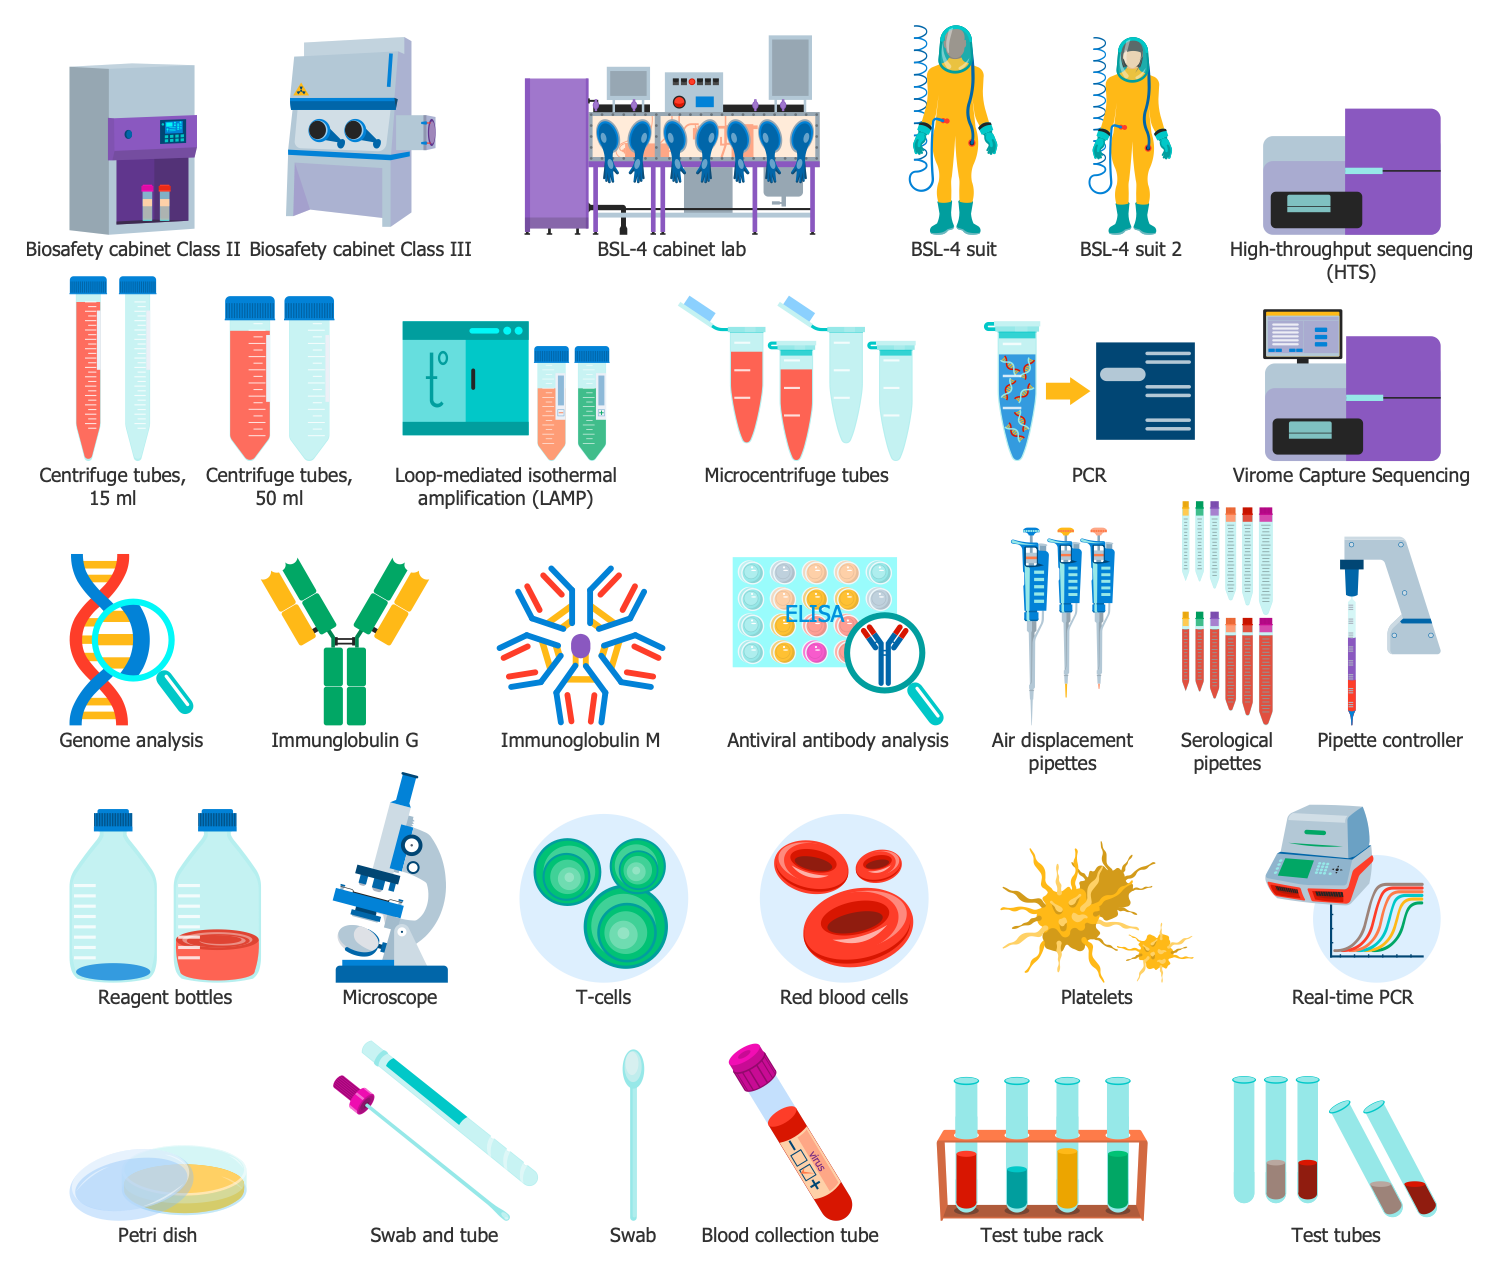
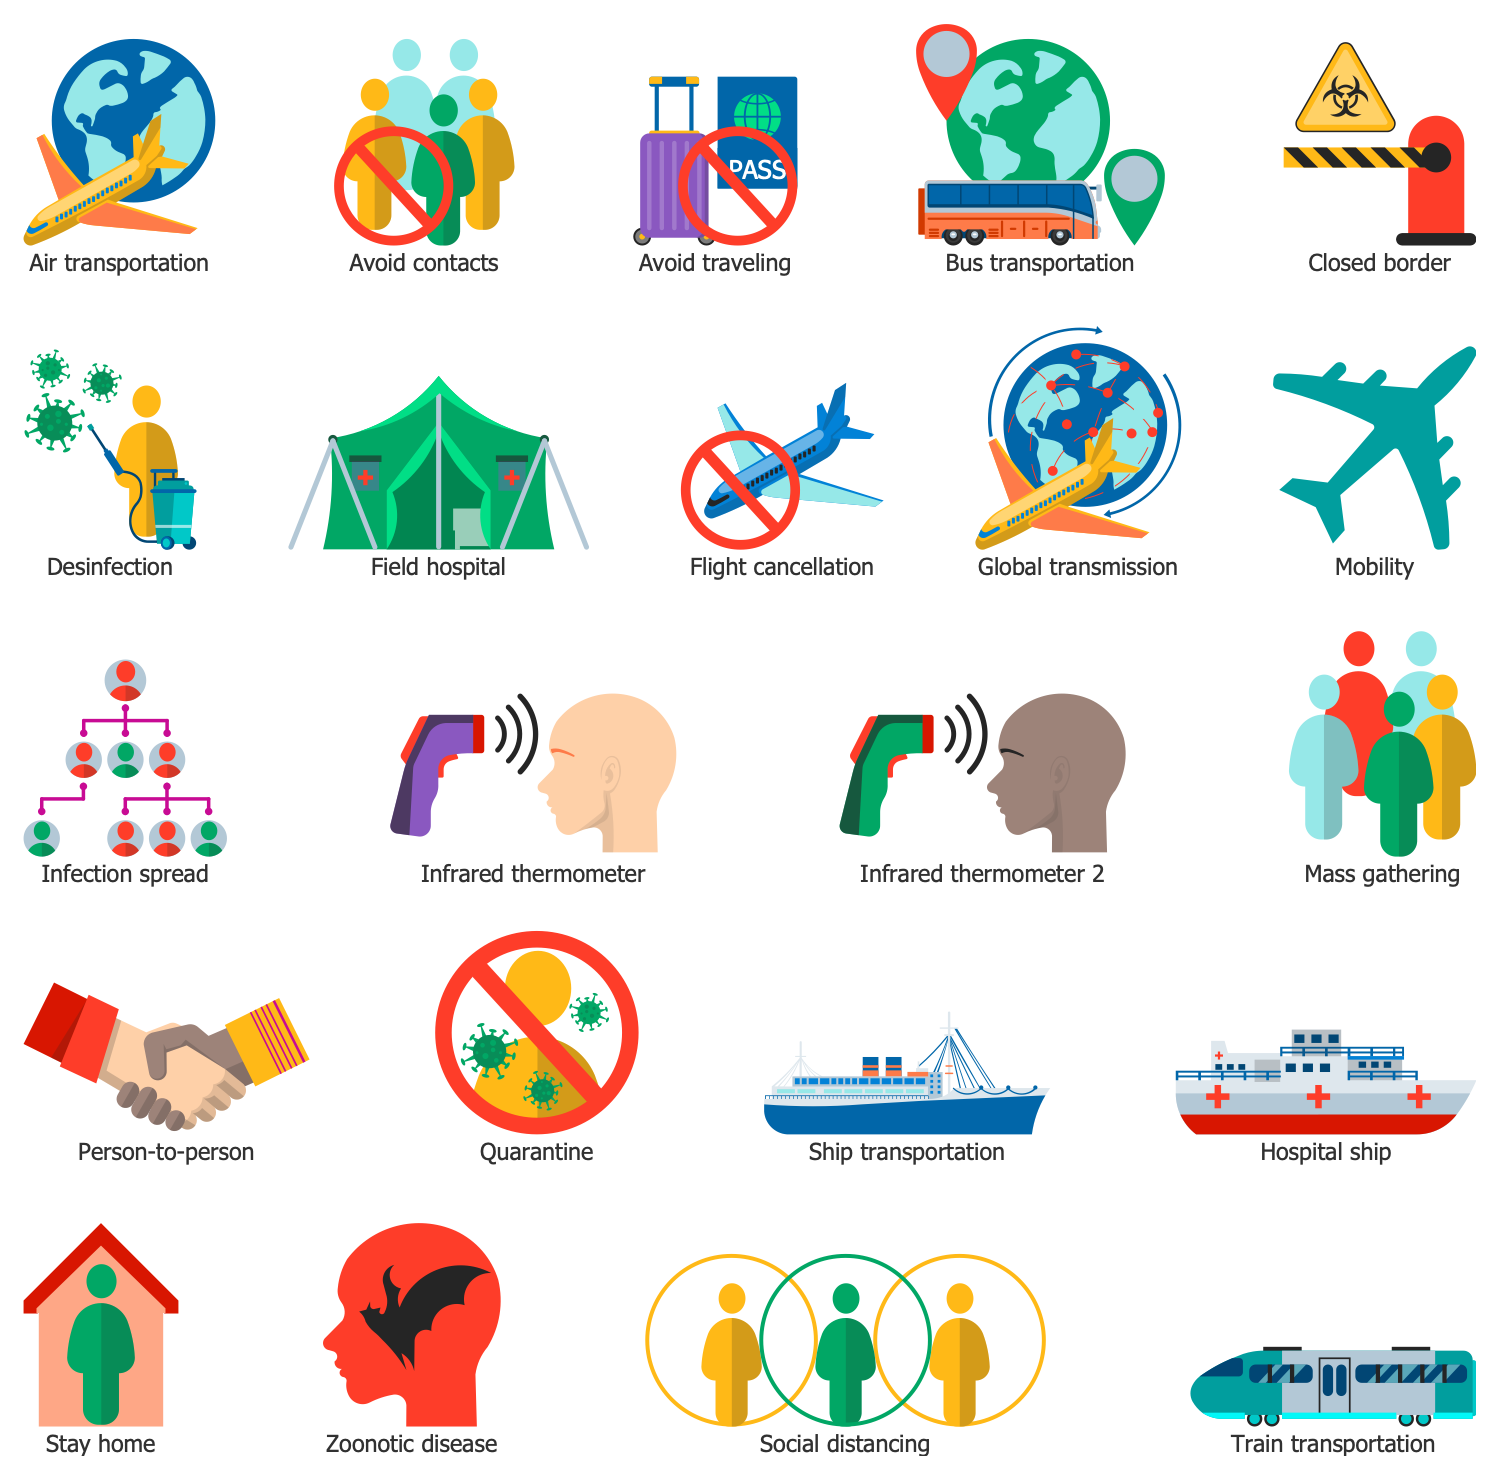
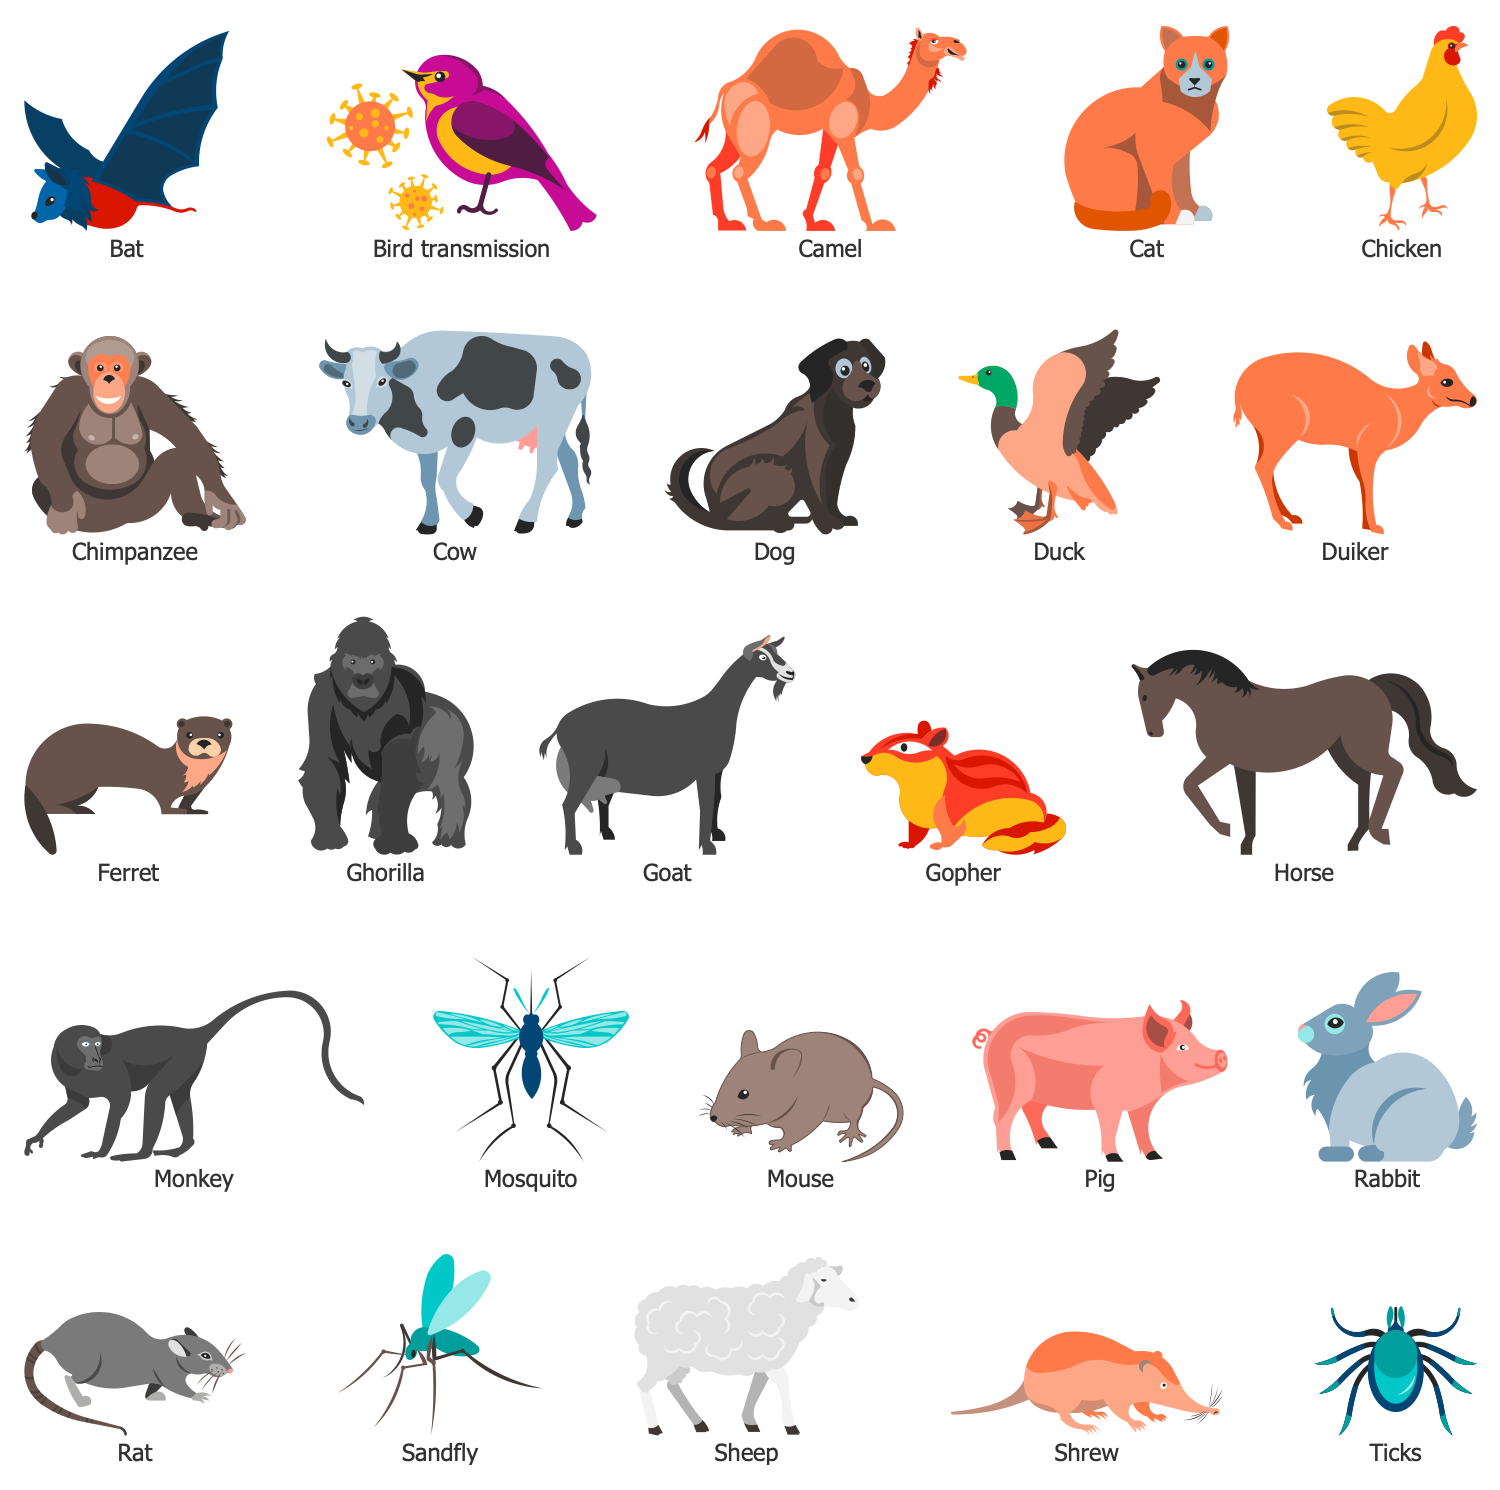
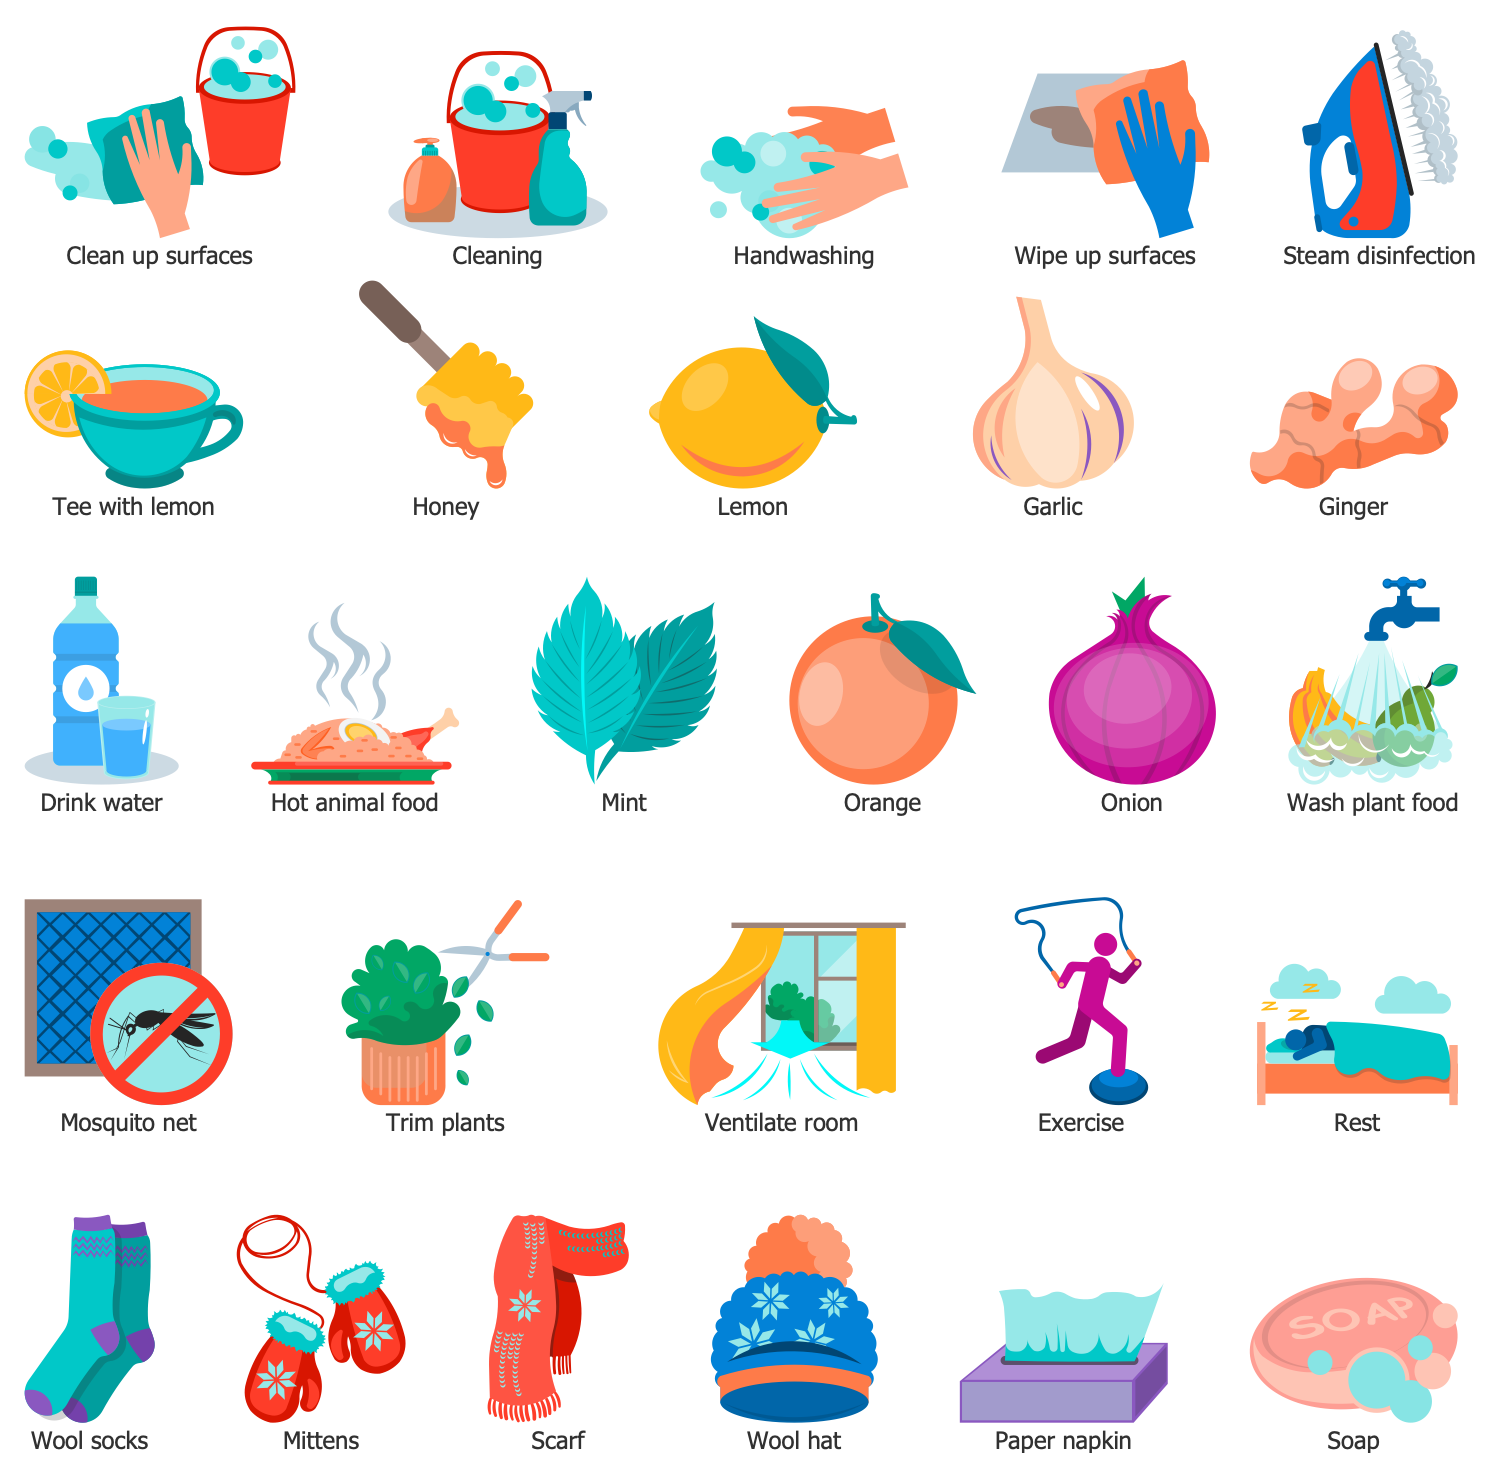
The Medical Virology solution contains 10 examples and 14 libraries containing 420 vector graphics and icons, to allow you to create professional-looking documents.
Design Elements — Virus
Design Elements — Virion Structure
Design Elements — Virus Contamination
Design Elements — Virus Diagnostics
Design Elements — Virus Epidemic
Design Elements — Virus Hosts
Design Elements — Virus Life Style
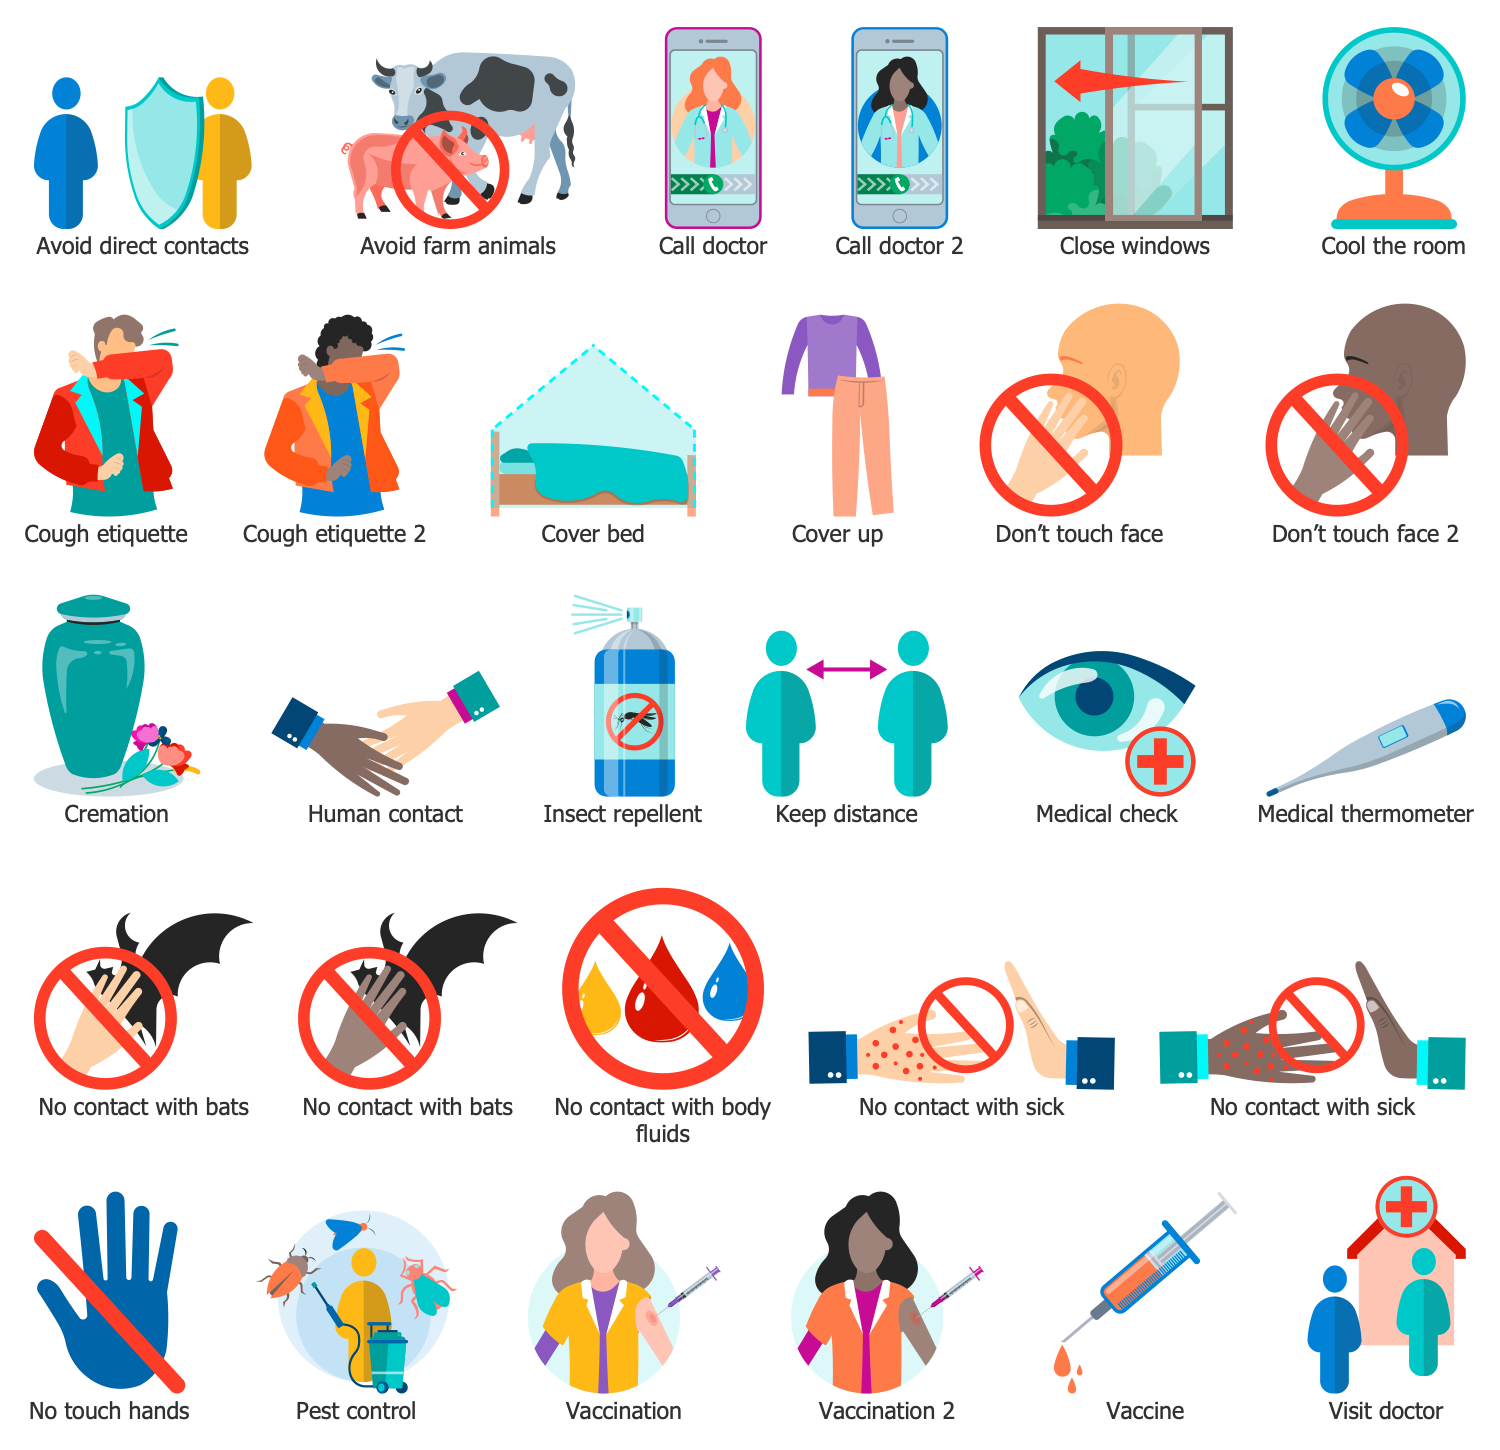
Design Elements — Virus Prevention
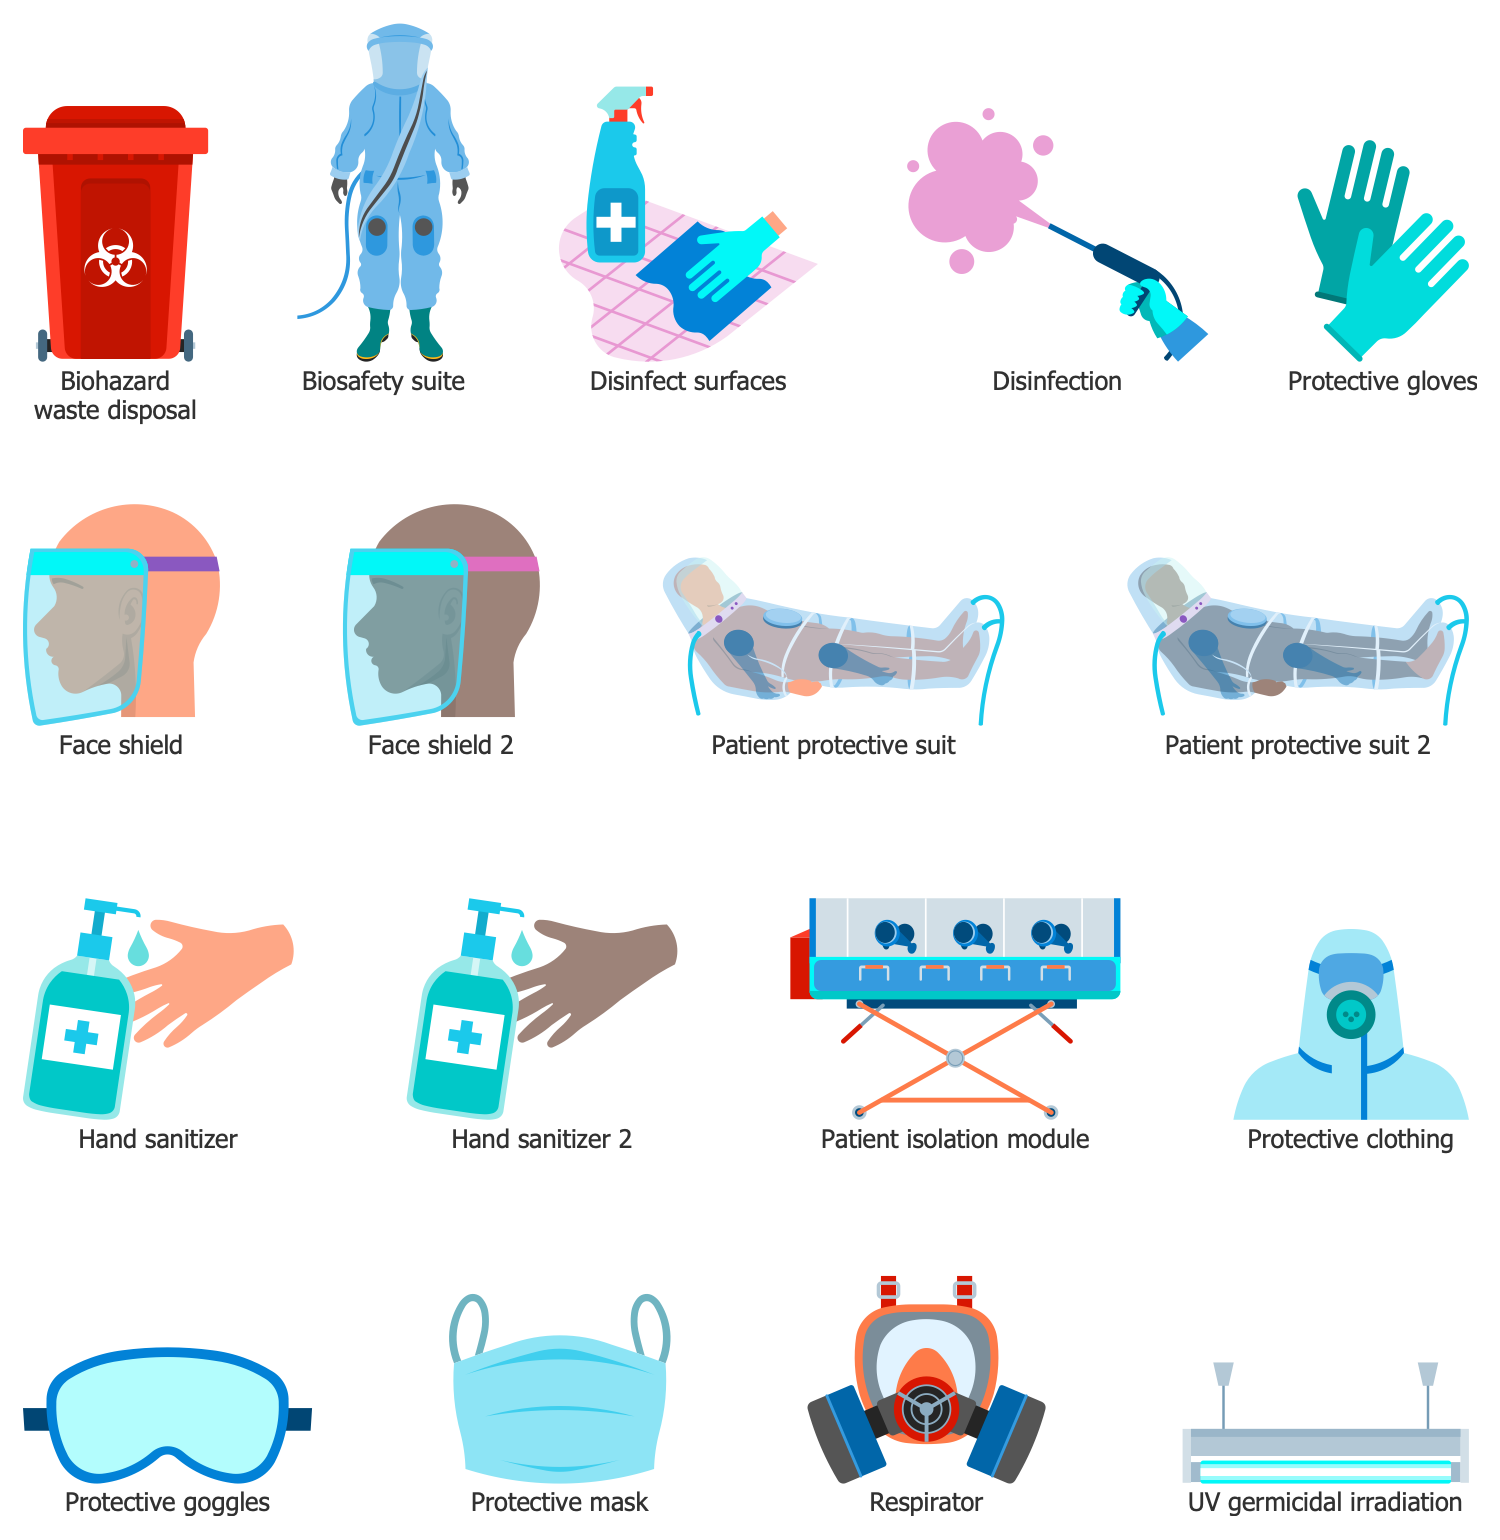
Design Elements — Virus Protection
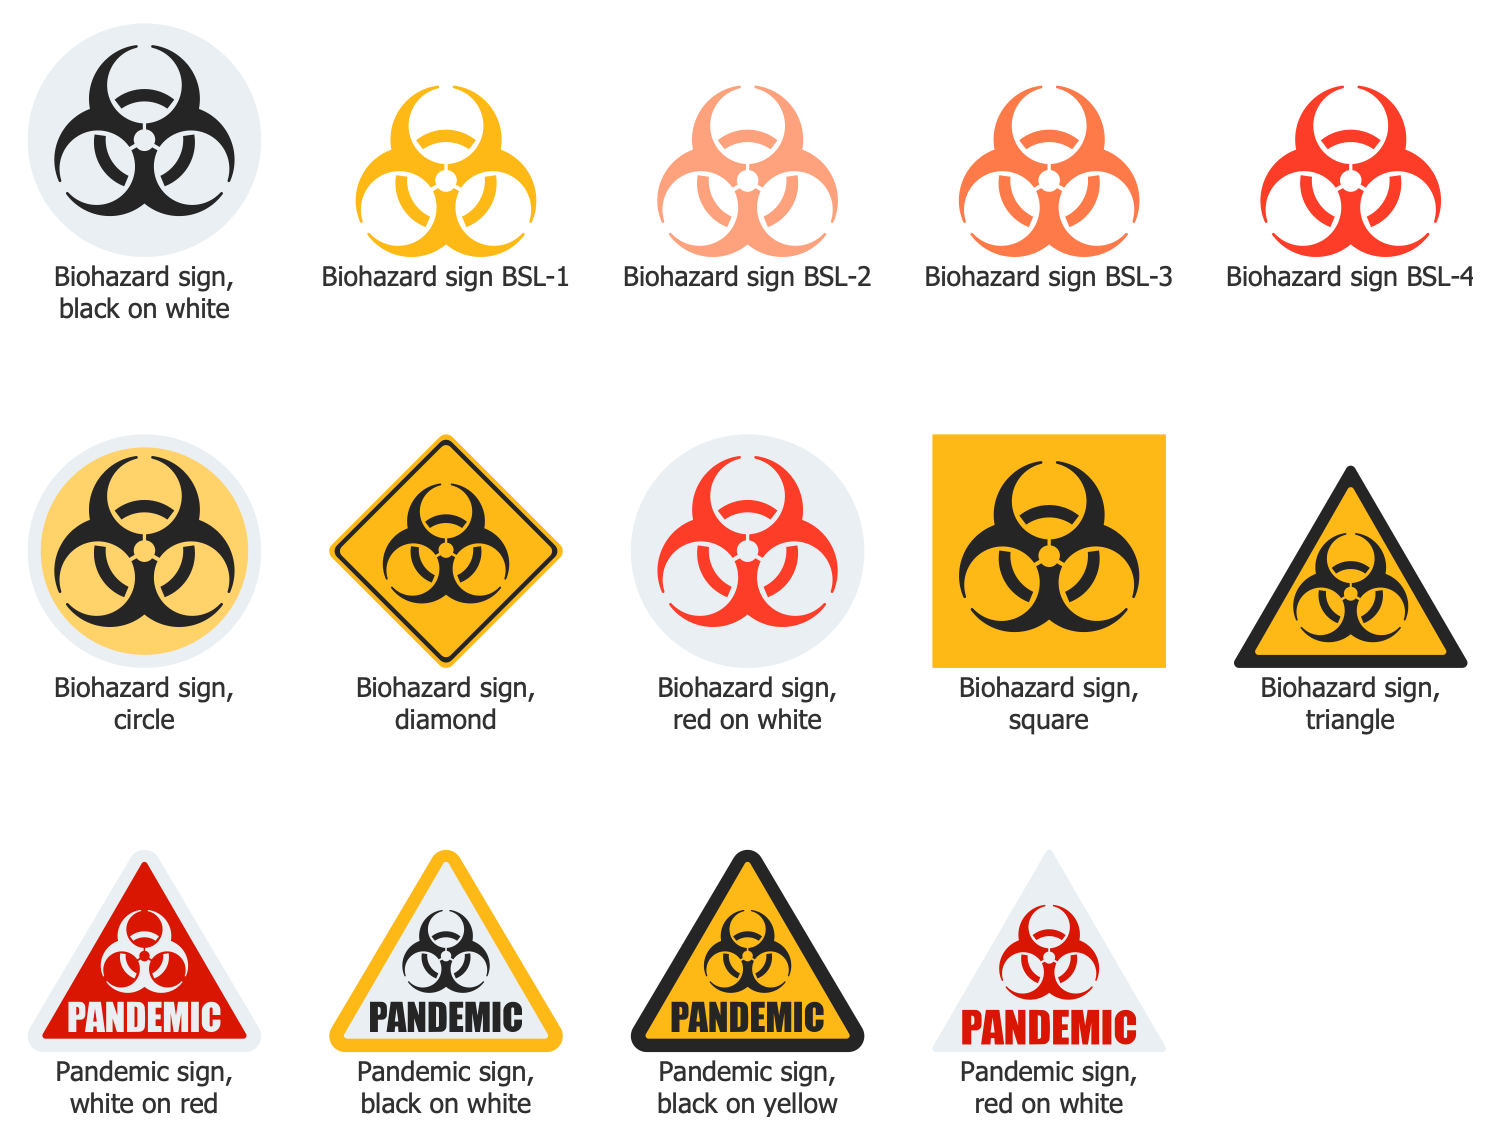
Design Elements — Virus Symbols
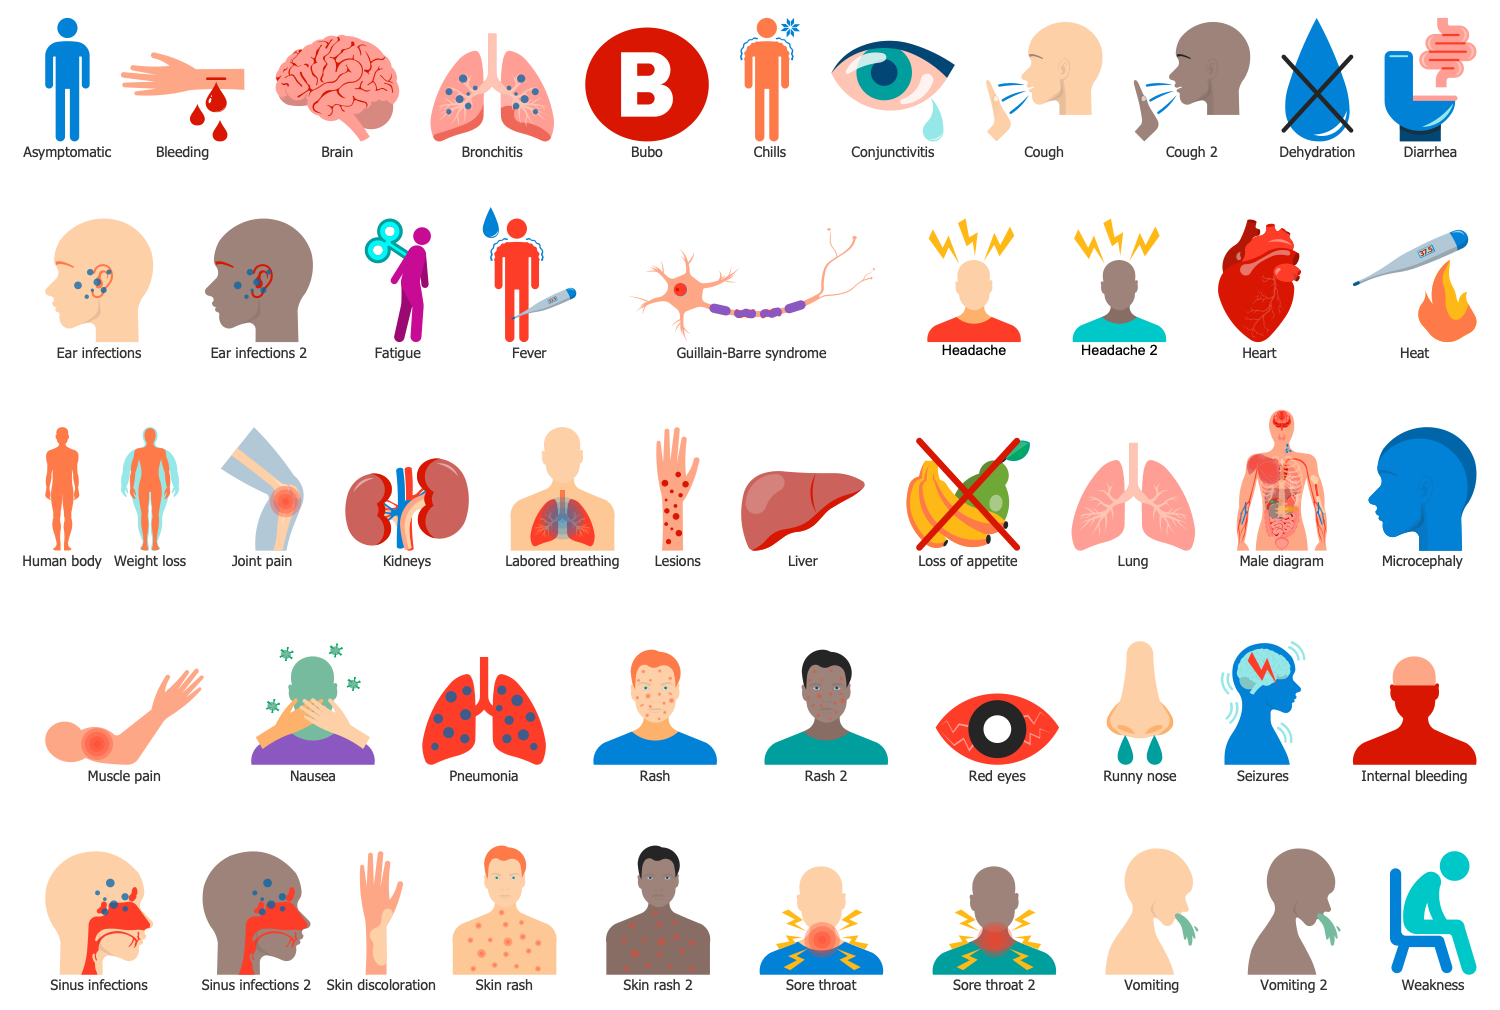
Design Elements — Virus Symptoms
Design Elements — Virus Treatment
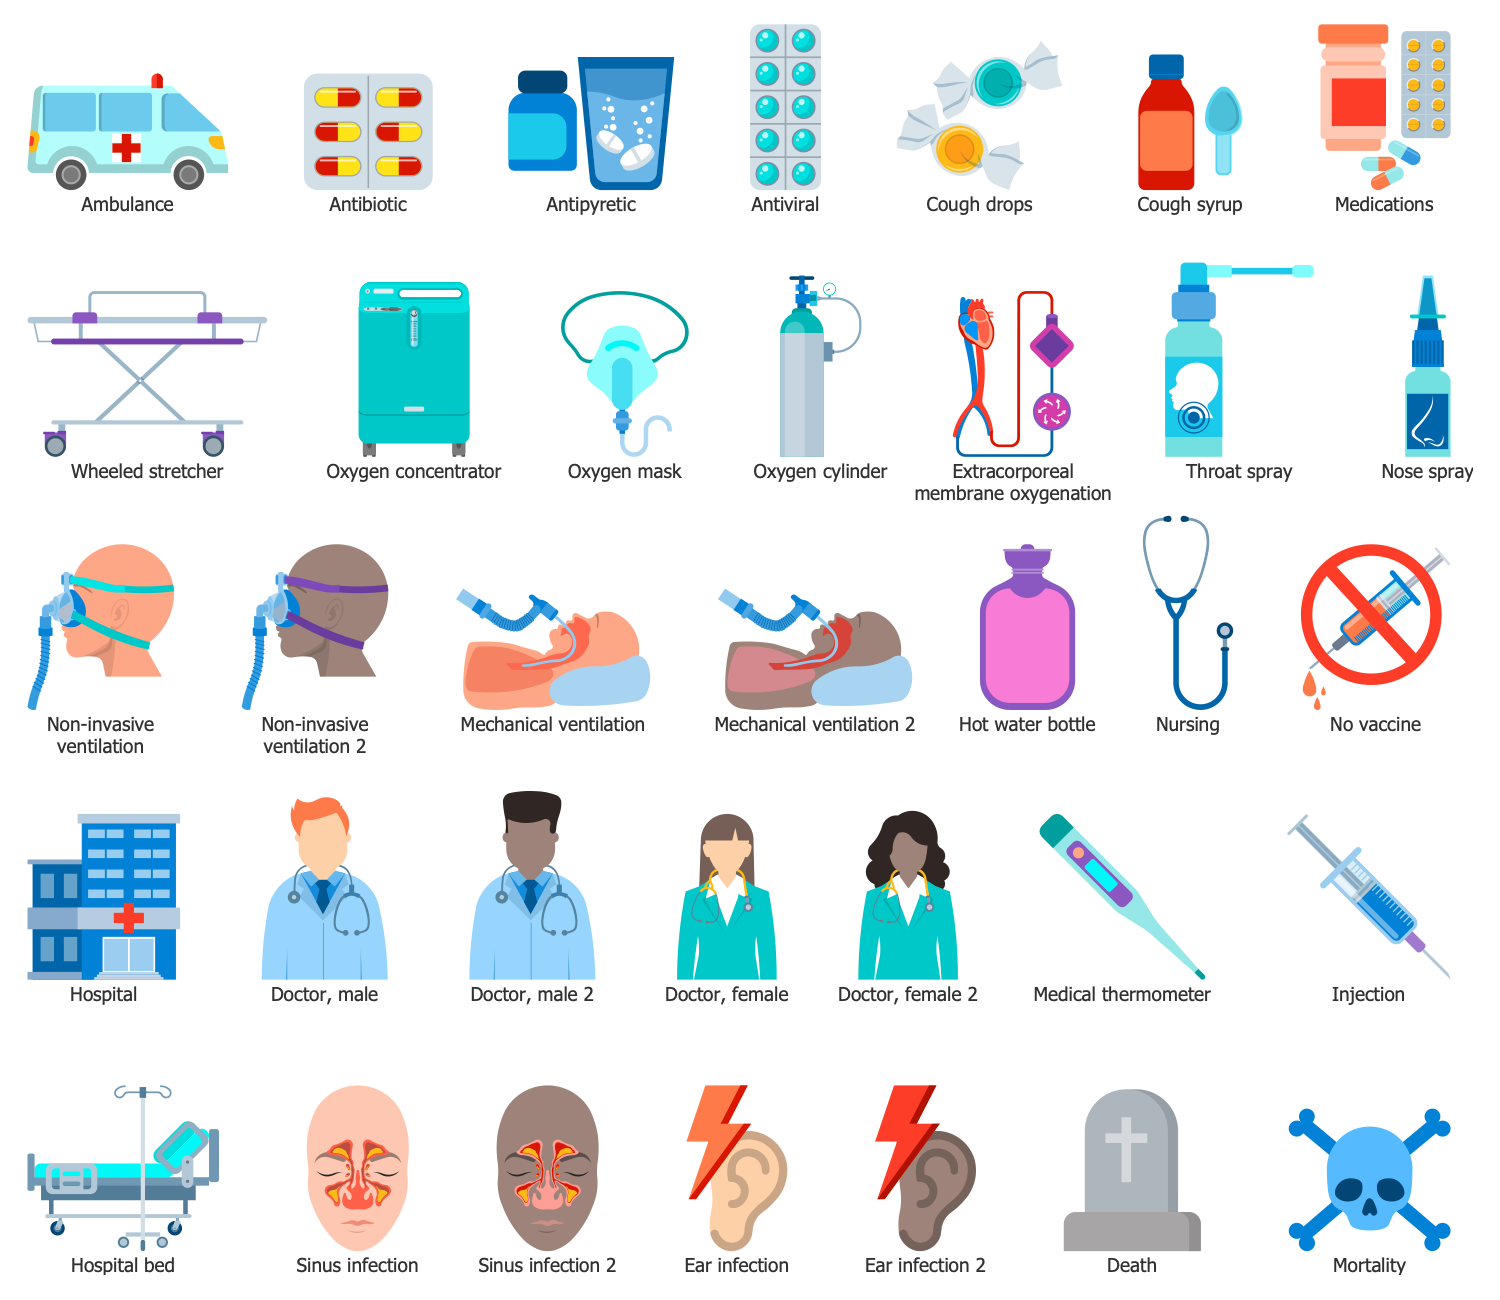
Design Elements — Virus Transmission
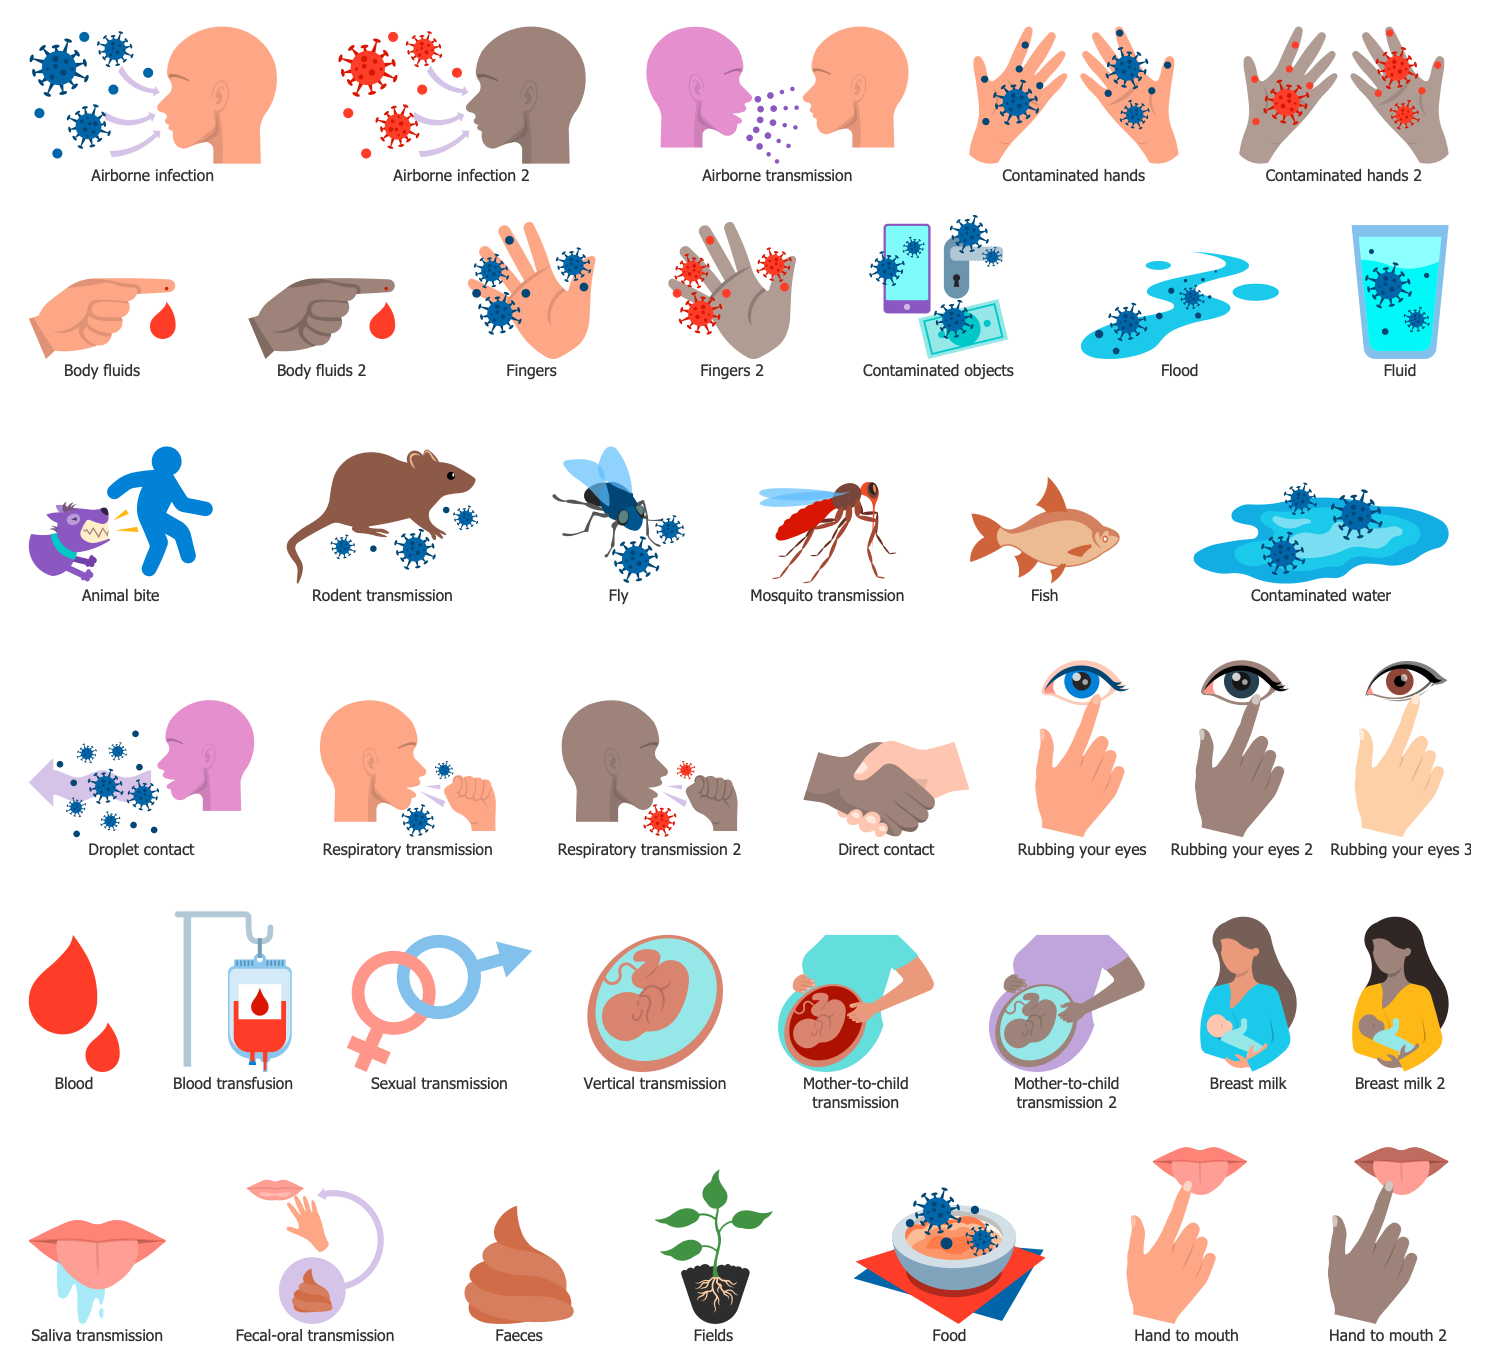
Design Elements — Vulnerable Group
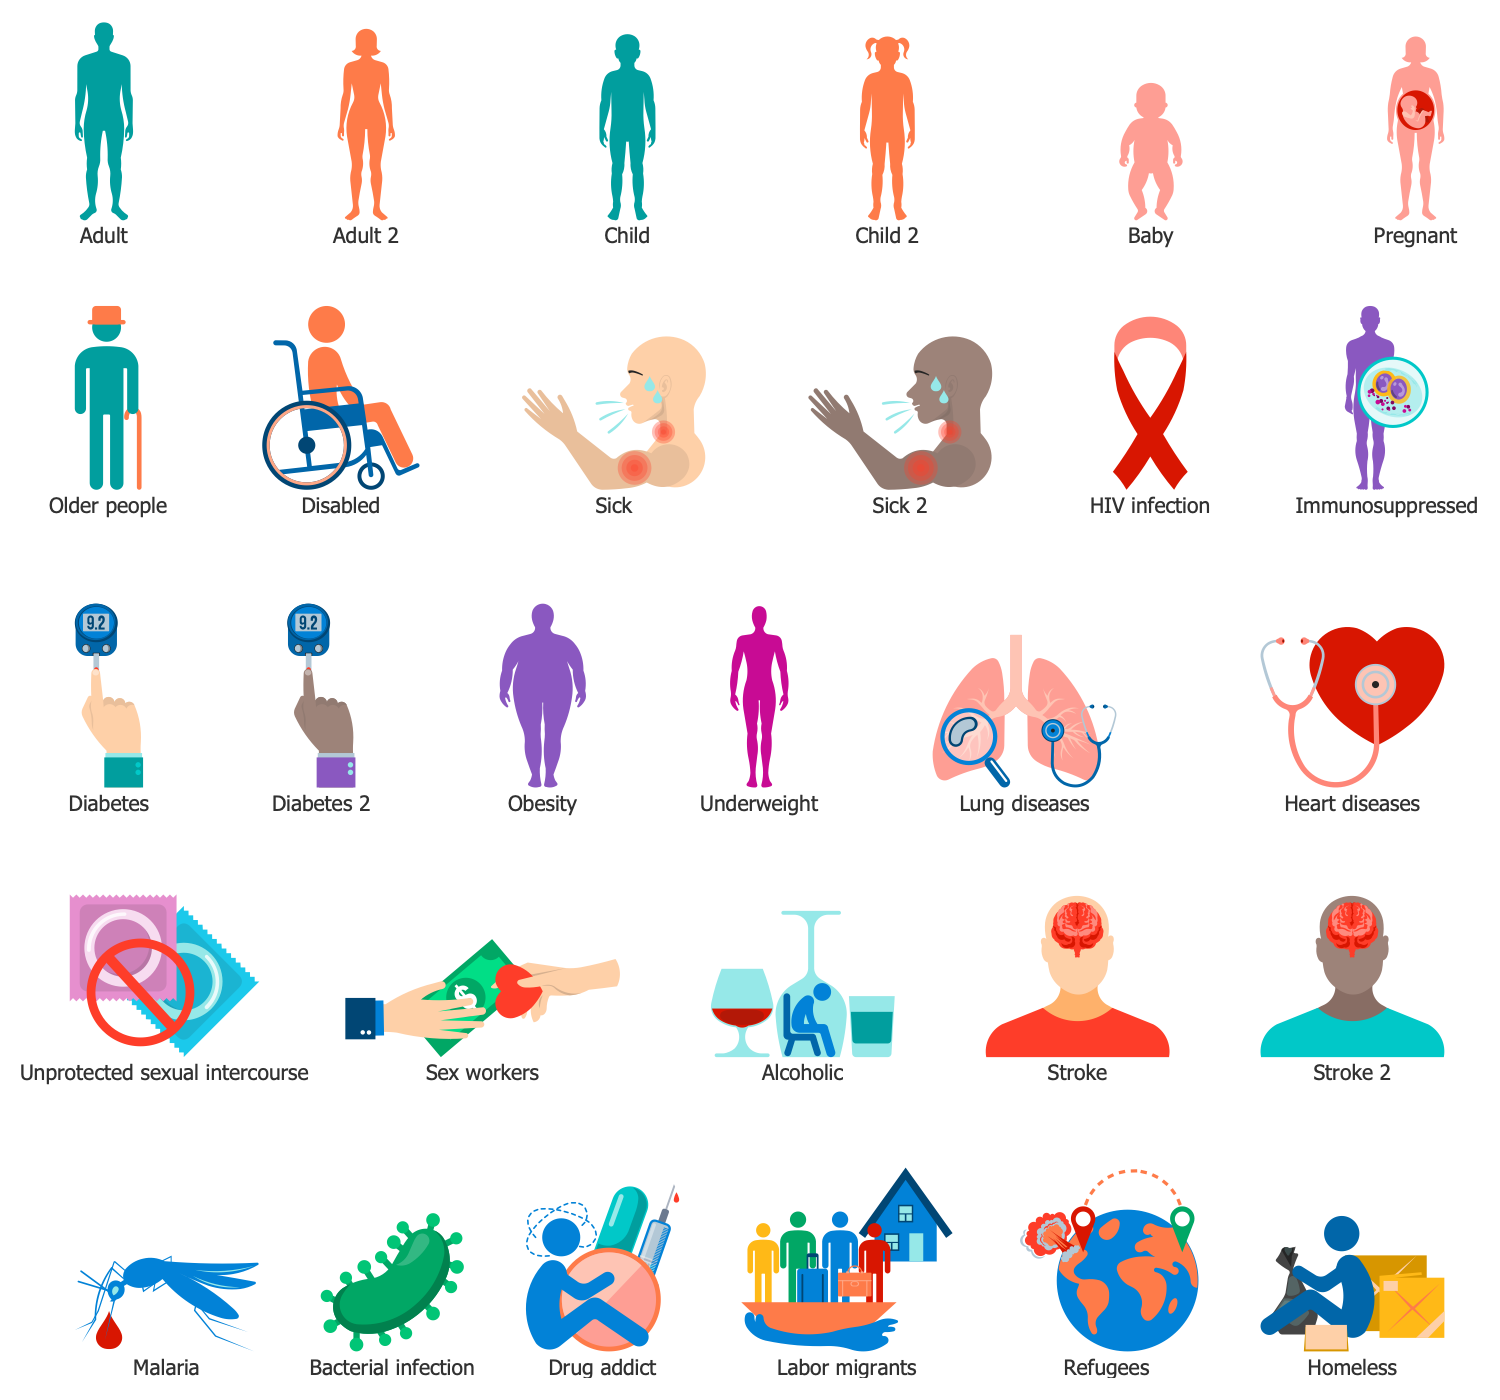
Examples
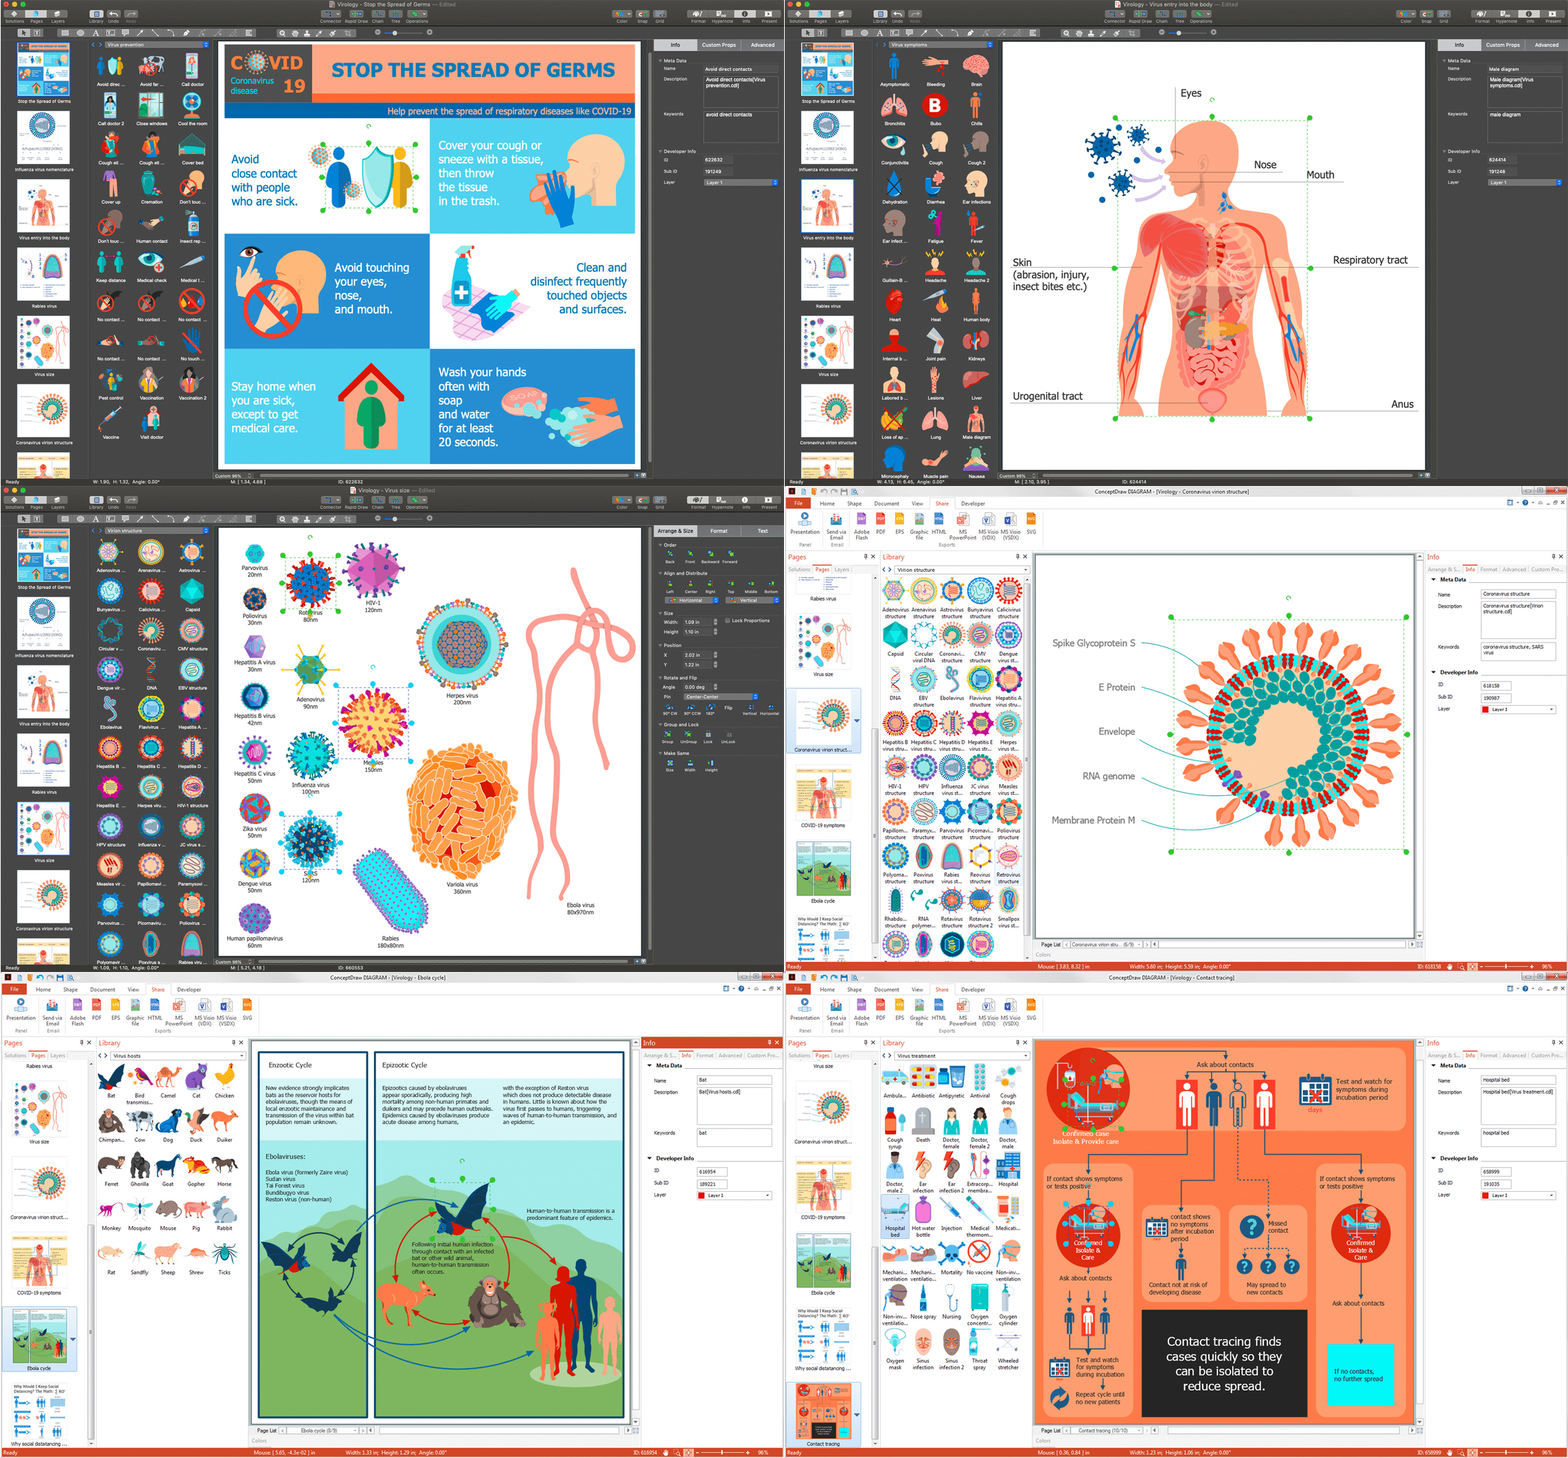
There are a few samples that you see on this page which were created in the ConceptDraw DIAGRAM application by using the Medical Virology solution. Some of the solution's capabilities as well as the professional results which you can achieve are all demonstrated here on this page.
All source documents are vector graphic documents which are always available for modifying, reviewing and/or converting to many different formats, such as MS PowerPoint, PDF file, MS Visio, and many other graphic ones from the ConceptDraw Solution Park or ConceptDraw STORE. The Medical Virology solution is available to all ConceptDraw DIAGRAM users to get installed and used while working in the ConceptDraw DIAGRAM diagramming and drawing software.
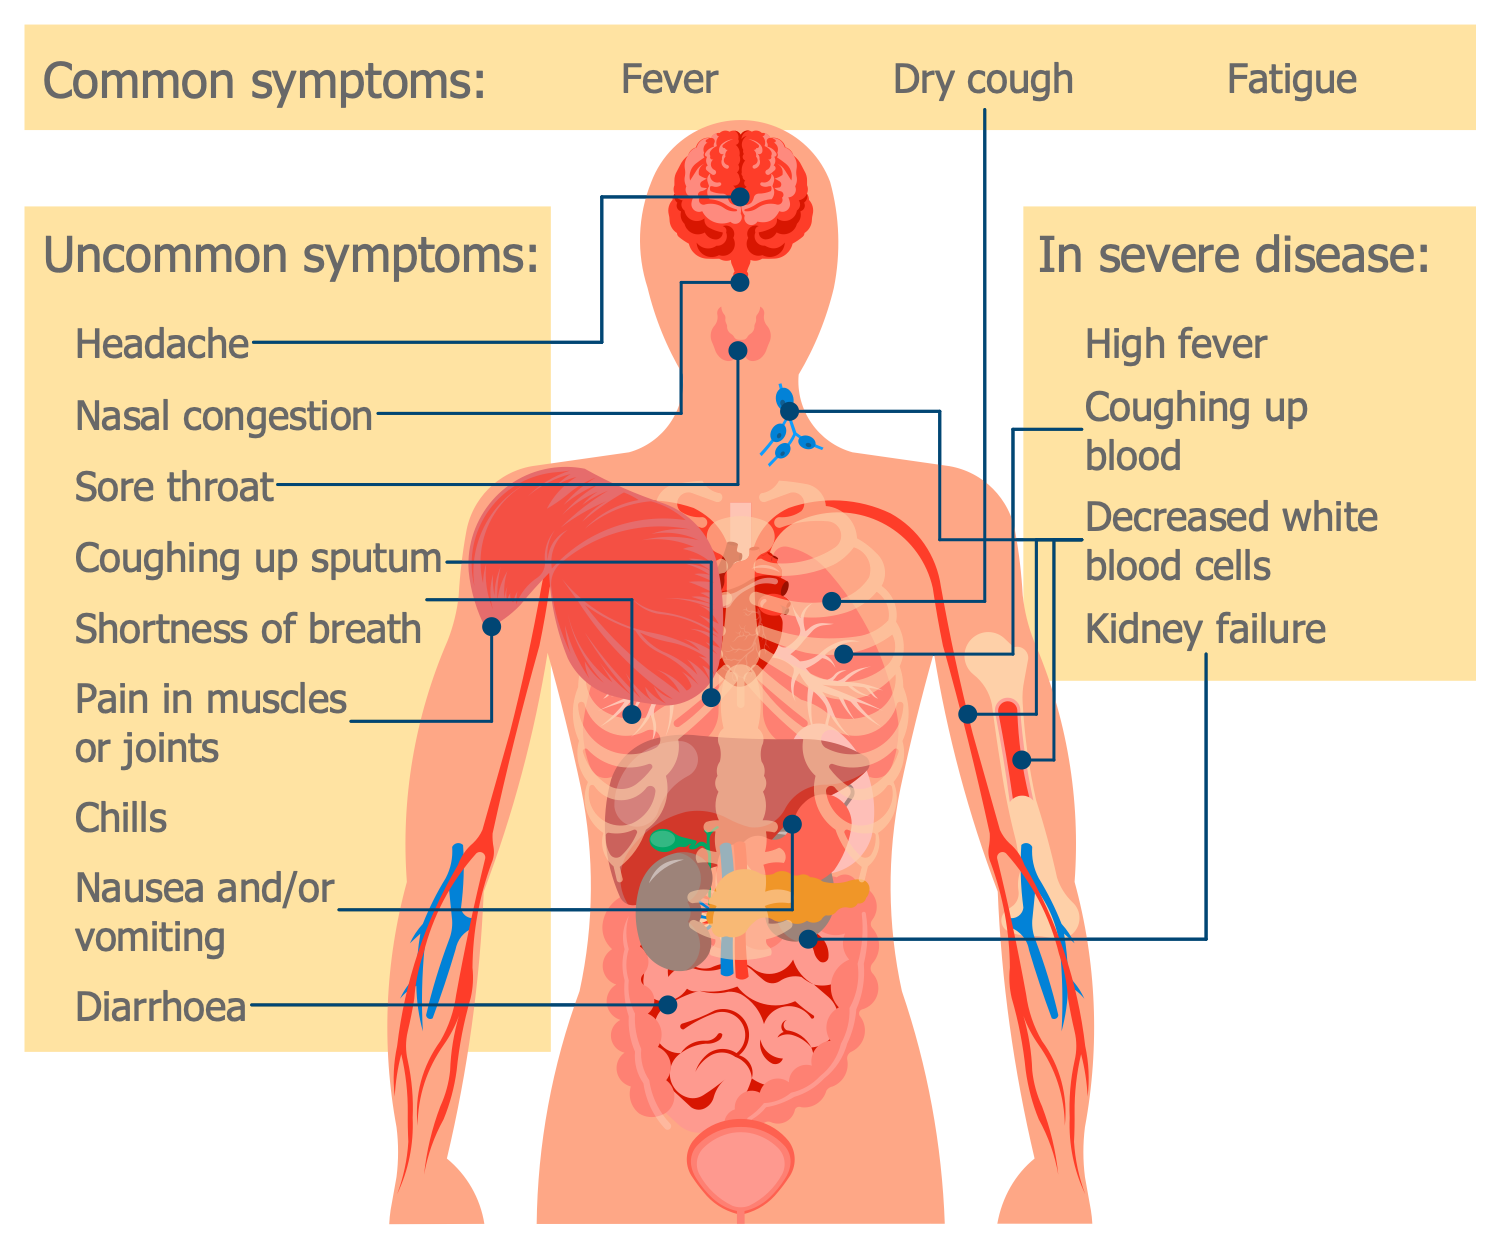
Example 1: COVID-19 Symptoms
This diagram was created in ConceptDraw DIAGRAM using the combination of libraries from the Medical Virology Solution. An experienced user spent 10 minutes creating this sample.
COVID-19 or Coronavirus disease 2019 is an infectious disease first identified in December 2019 in Wuhan, China. It was caused by severe acute respiratory syndrome coronavirus 2 (SARS-CoV-2) and resulted the worldwide pandemic. The symptoms of COVID-19 are listed in this visual sample. Among the most common are fever, dry cough, and fatigue. However were also noticed some uncommon symptoms, like headache, nasal congestion, sore throat, coughing up sputum, shortness of breath, pain in muscles or joints, chills, nausea and/or vomiting, diarrhea (diarrhoea). The disease may proceed with different degrees of gravity, in severe disease cases were fixed high fever, coughing up blood, decreased white blood cells, and kidney failure. The use of clipart representing a human's internal structure allows reflecting the correspondence of specific symptoms to the organs where they occur. This diagram clearly explains all the symptoms of CoV and is easy to understand, so it is ideal for informing people, it can be used to immediately identify a disease and make a correct diagnosis.
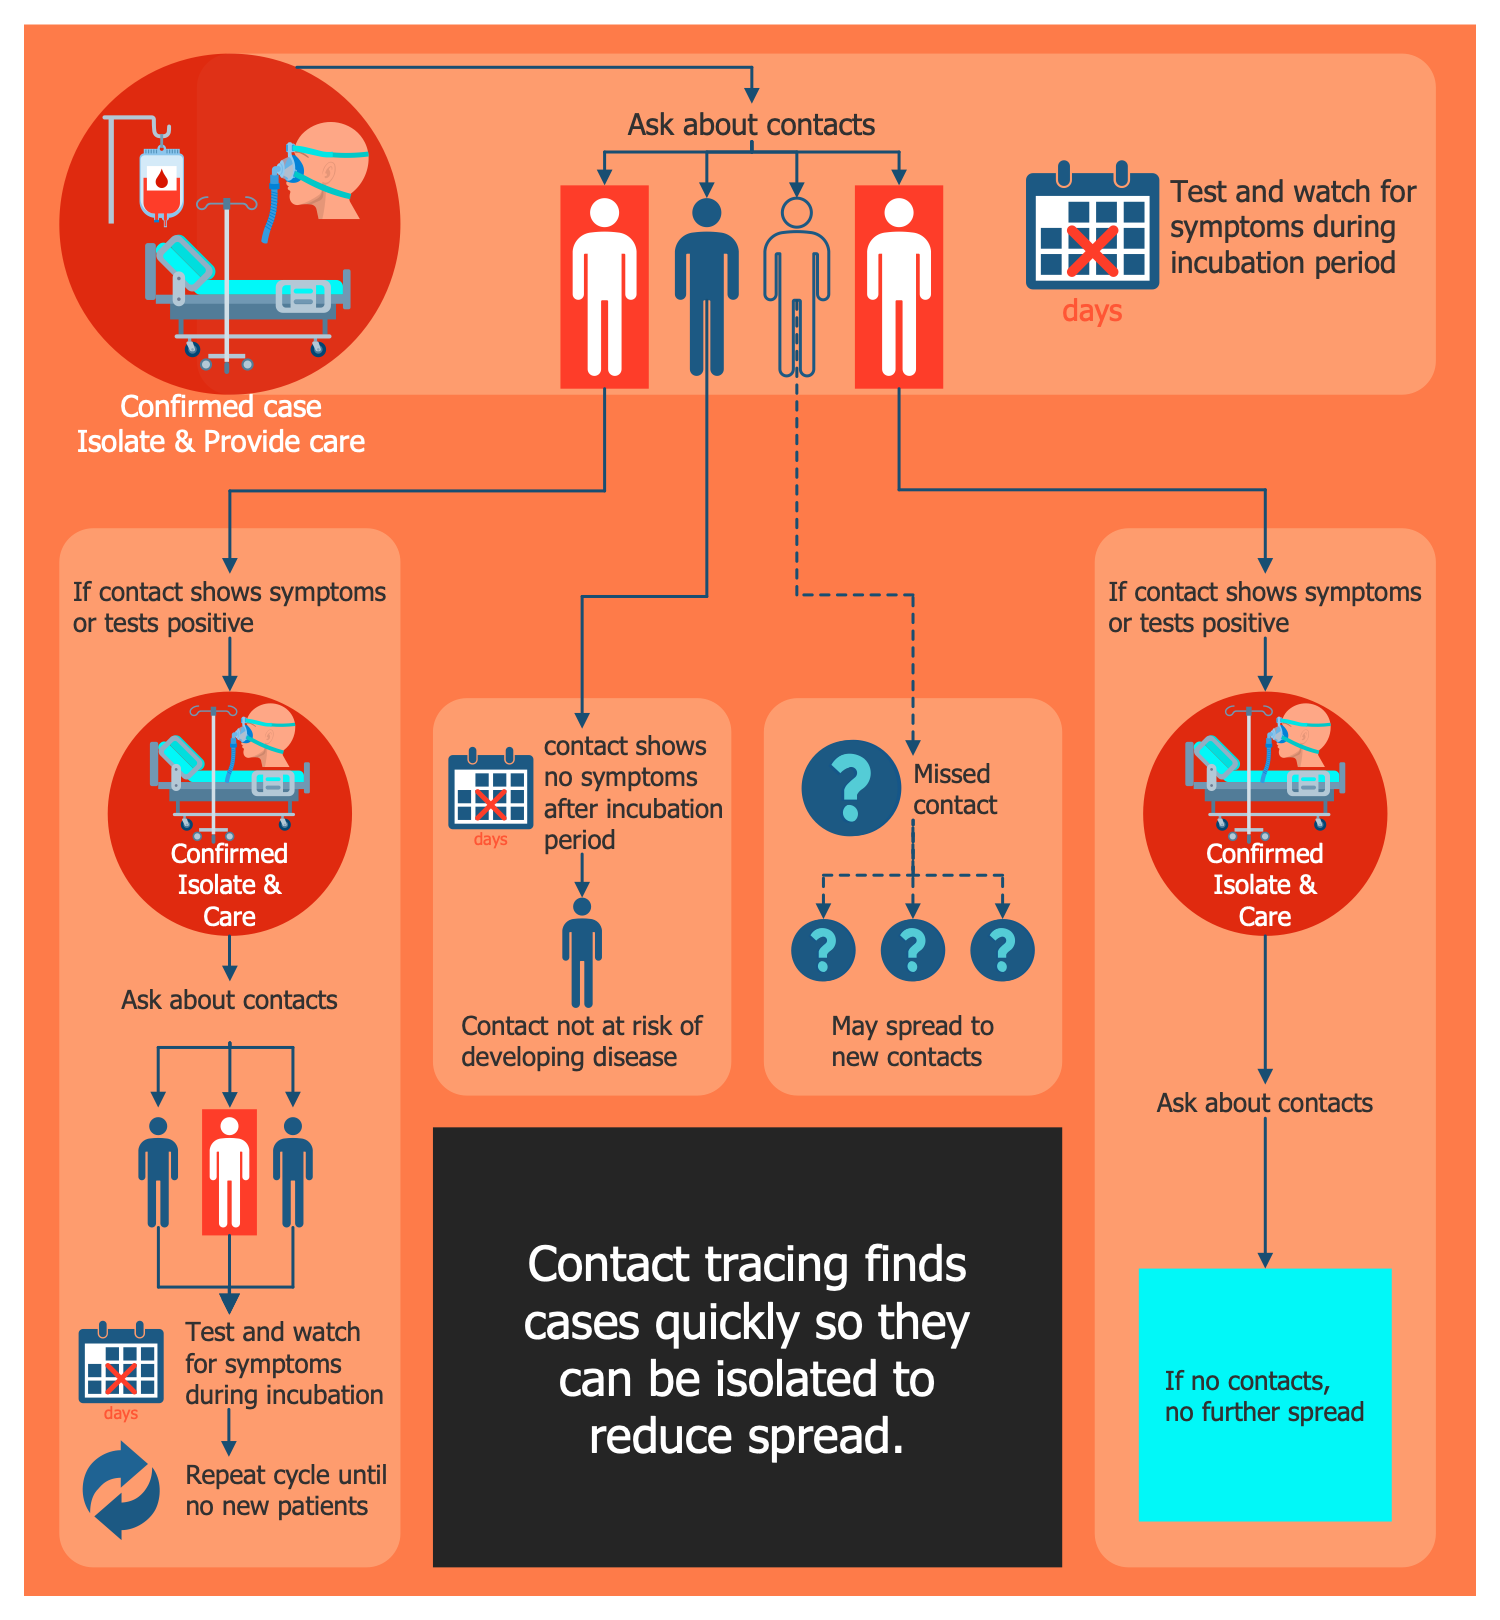
Example 2: Contact Tracing
This diagram was created in ConceptDraw DIAGRAM using the combination of libraries from the Medical Virology Solution. An experienced user spent 15 minutes creating this sample.
This sample diagram is dedicated to tracing the contacts of a person with confirmed disease. The goal of this activity is to stop the spread of a disease by finding people that have recently been in contact with an infected person, testing them for infection, as well as isolating, monitoring them for symptoms during the incubation period, and simultaneously treating the infected ones. If contact symptoms were discovered among the contacts of the infected person, then, in turn, tracking of the contacts of the new patient begins and this cycle is repeated until there are no new patients and no contacts with other people. And correspondingly at this moment, the further spread of disease will stop. Contact tracing is typically used for diseases such as tuberculosis, measles, blood and sexually transmitted infections, serious bacterial infections, and new airborne infections such as H1N1, SARS-CoV, COVID-19.
Example 3: Coronavirus Virion Structure
This diagram was created in ConceptDraw DIAGRAM using the combination of libraries from the Medical Virology Solution. An experienced user spent 5 minutes creating this sample.
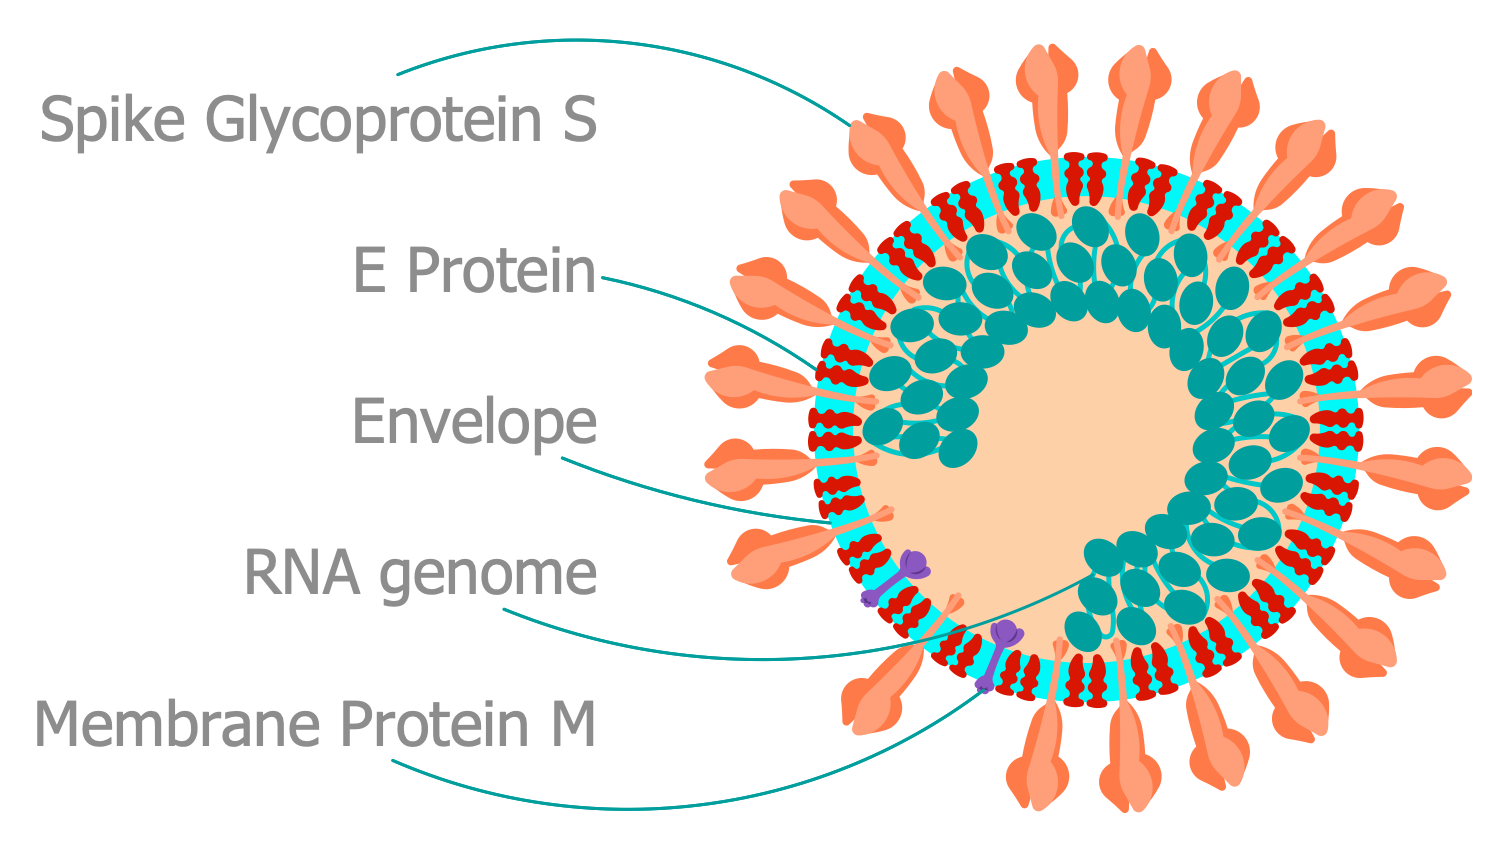
This example was designed based on the Wikimedia Commons file "Coronavirus virion structure.svg" and shows the Coronavirus virion structure. Five structural proteins are encoded by Coronaviruses in their genomes. These are the Spike glycoprotein (S), Envelope protein (E), Membrane protein (M), Hemagglutinin Esterase protein (HE), and Nucleocapsid protein (N), which plays an essential role in the structure of CoV. Most of listed proteins are presented in all virions but Hemagglutinin Esterase is contained only in some beta coronaviruses. The interactions between these proteins allow several virus particles to organize together. Coronaviruses are a group of related RNA viruses, they contain a positive-sense, single-stranded RNA viral genome consisting of seven genes, via interactions with which the replication and transcription of CoV are realized. Coronaviruses bind to the receptors on the host cell surface via the spike proteins, the replication occurs in the cell cytoplasm.
Example 4: Ebola Cycle
This diagram was created in ConceptDraw DIAGRAM using the combination of libraries from the Medical Virology Solution. An experienced user spent 15 minutes creating this sample.
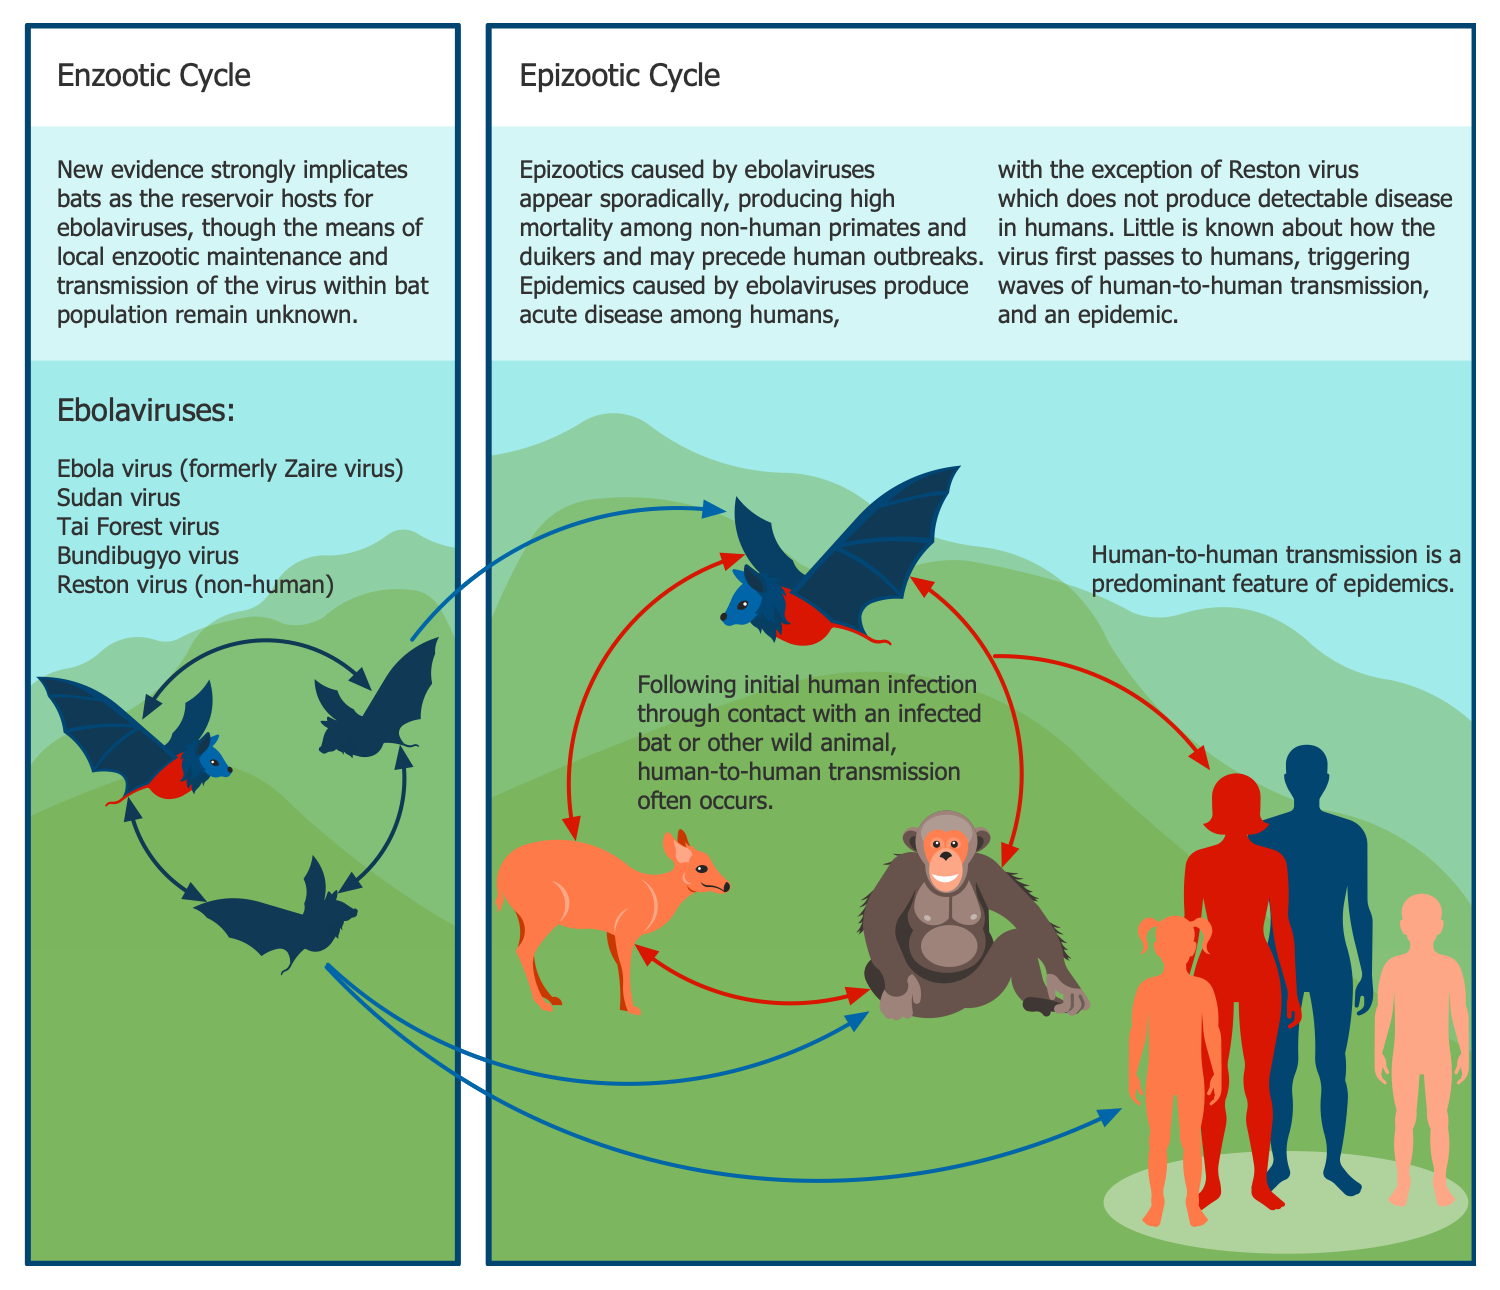
This sample diagram shows the life cycles of the Ebola viral infection, which causes a viral hemorrhagic fever named Ebola virus disease (EVD). It is based on the illustration from the website of the Centers for Disease Control and Prevention. Ebola Virus Disease is a rare and deadly zoonotic disease first discovered in 1976 near the Ebola River in the current Democratic Republic of Congo. The risk of death is 25-90%. Ebola virus most commonly affects people and nonhuman primates, such as monkeys, gorillas, chimpanzees. Five species of Ebola virus were researched: Ebola virus (Zaire virus), Sudan virus, Taï Forest virus, Bundibugyo virus, and Reston virus. The last one causes disease only in nonhuman primates and pigs, not in people. The disease symptoms can reveal in a term from two days to three weeks after contracting with a virus. These are fever, muscular pain, sore throat, headaches, vomiting, diarrhea, rash, decrease of the liver and kidneys functions, internal or external bleeding. One can easily add information about modern researches and vaccines against the Ebola virus in this diagram.
Example 5: Influenza Virus Nomenclature
This diagram was created in ConceptDraw DIAGRAM using the combination of libraries from the Medical Virology Solution. An experienced user spent 5 minutes creating this sample.
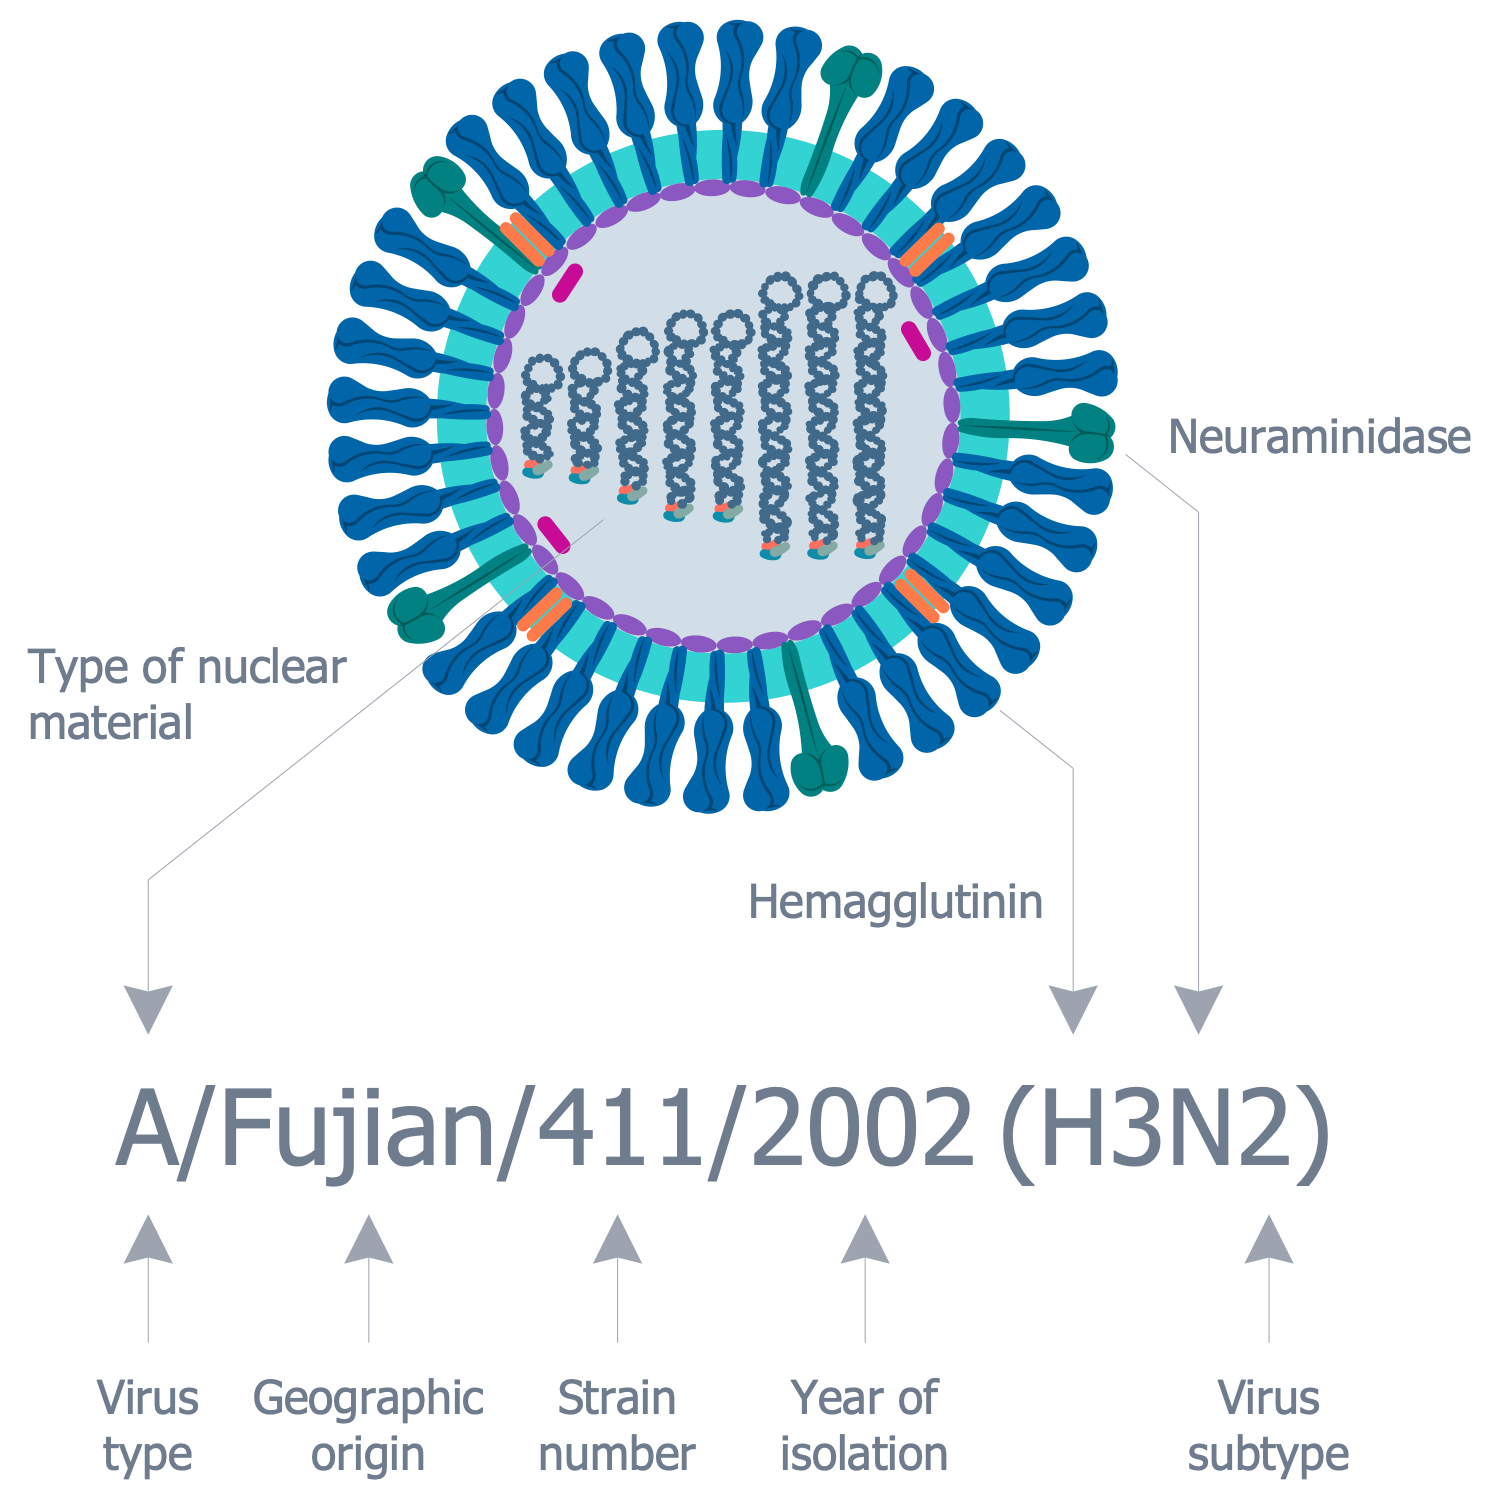
This sample was designed based on the Wikimedia Commons file "InfluenzaNomenclatureDiagram.svg" and illustrates the influenza A virus nomenclature system and the virion structure. The type A viruses cause the most severe diseases and are the most virulent human pathogens. The virion of the influenza A virus is 80–120 nm in diameter and produces ellipsoidal, bacilliform, and filamentous particles. Each detected influenza virus is identified by the virus type, geographic origin where it was first isolated, strain number, year of isolation, and virus subtype (HA and NA). The influenza virion includes the hemagglutinin (HA or H) and neuraminidase (NA or N) proteins on the surface of the particle. Based on these proteins the Influenza A viruses were classified and sixteen H serotypes and nine N serotypes have been identified. This sample shows one of the influenza A viruses — A/Fujian/411/2002 (H3N2). Use Medical Virology solution to succeed in health science and virology illustration.
Example 6: Rabies Virus
This diagram was created in ConceptDraw DIAGRAM using the combination of libraries from the Medical Virology Solution. An experienced user spent 5 minutes creating this sample.
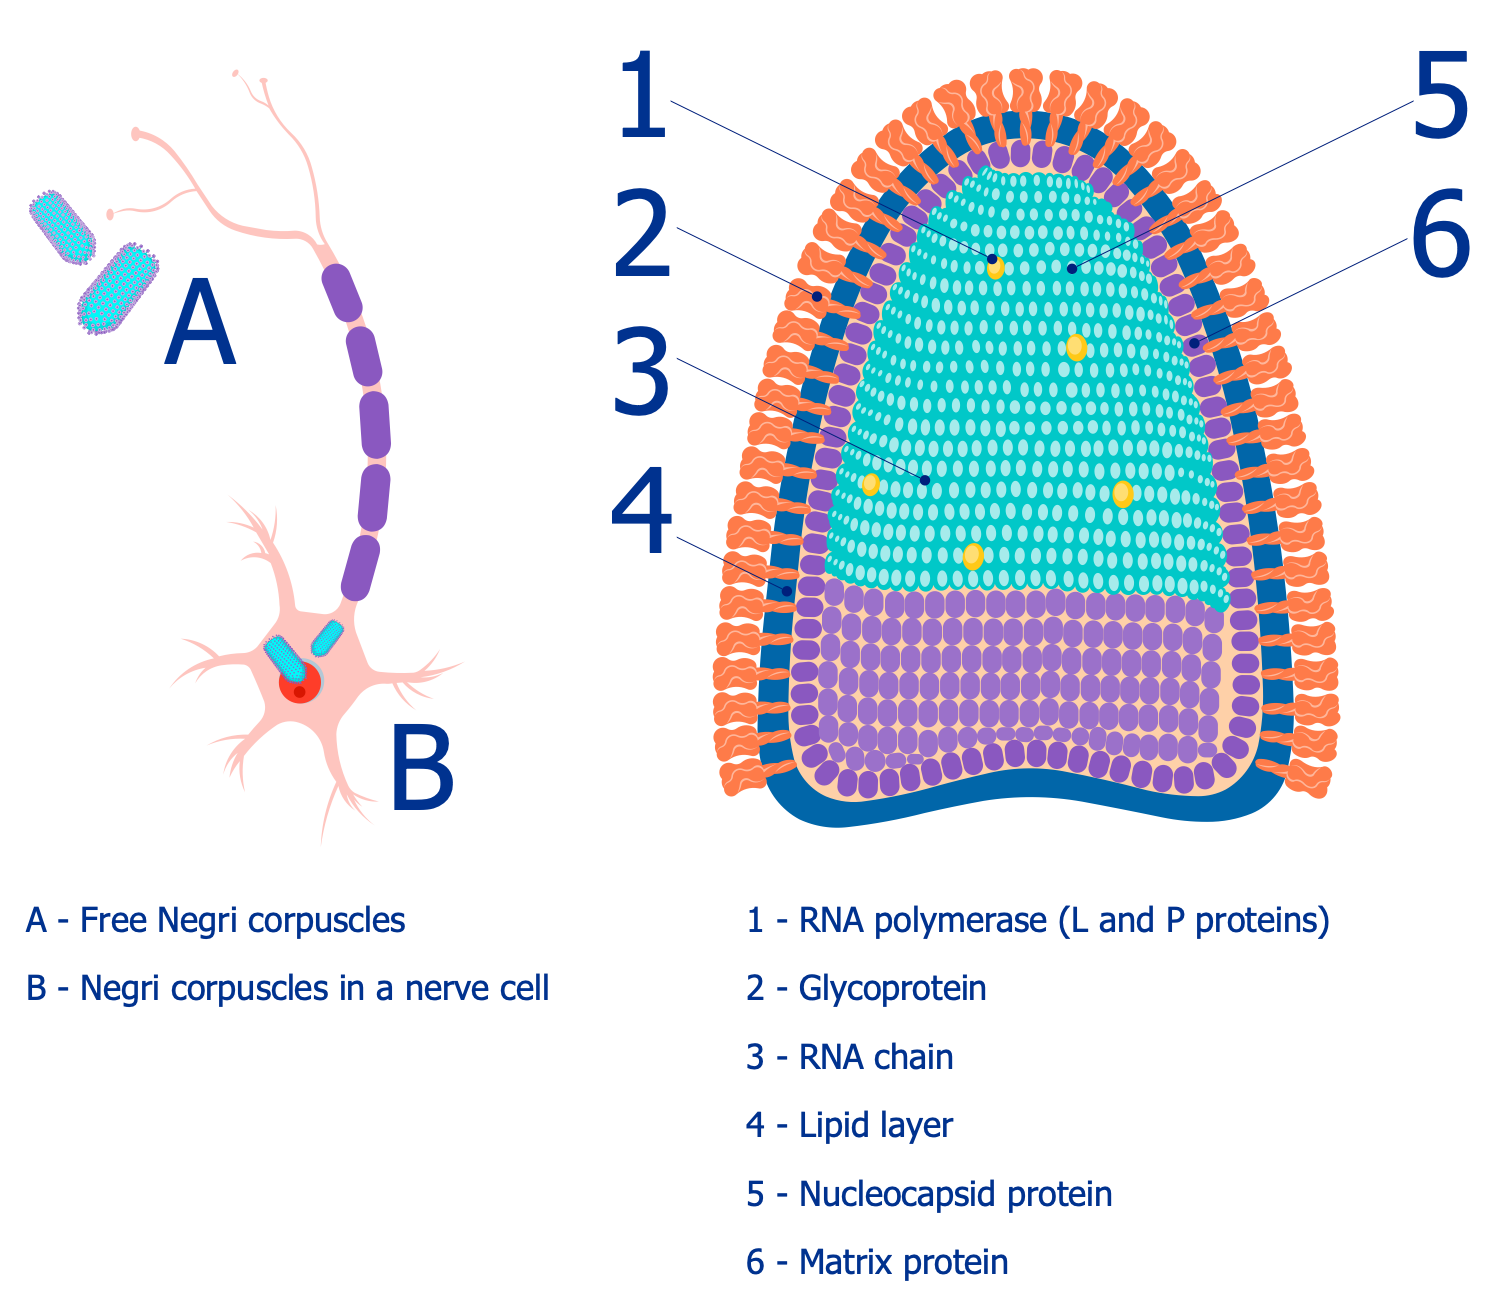
This sample shows the Rabies virus structure and was designed based on the Wikimedia Commons file "Rabid virus schema.png". It is a neurotropic virus that causes rabies in humans and animals. The saliva of animals is the main path of this virus transmission. The Rabies virus is 2–10 µm in diameter, has helical symmetry and cylindrical morphology, is enveloped and has a single-stranded RNA genome with negative-sense. The genetic information is contained in a ribonucleoprotein core (RNP). The RNA genome of the virus encodes five proteins: nucleoprotein (N), glycoprotein (G), phosphoprotein (P), matrix protein (M), and viral RNA polymerase (L). The genomic RNA is tightly encased by the nucleoprotein, the phosphoprotein and polymerase are associated with the RNP, the glycoprotein forms the spikes on the virus surface, M protein is associated with both RNP and the envelope. The transcription and replication occur in the cytoplasm inside the Negri body.
Example 7: Stop the Spread of Germs COVID-19
This diagram was created in ConceptDraw DIAGRAM using the combination of libraries from the Medical Virology Solution. An experienced user spent 10 minutes creating this sample.
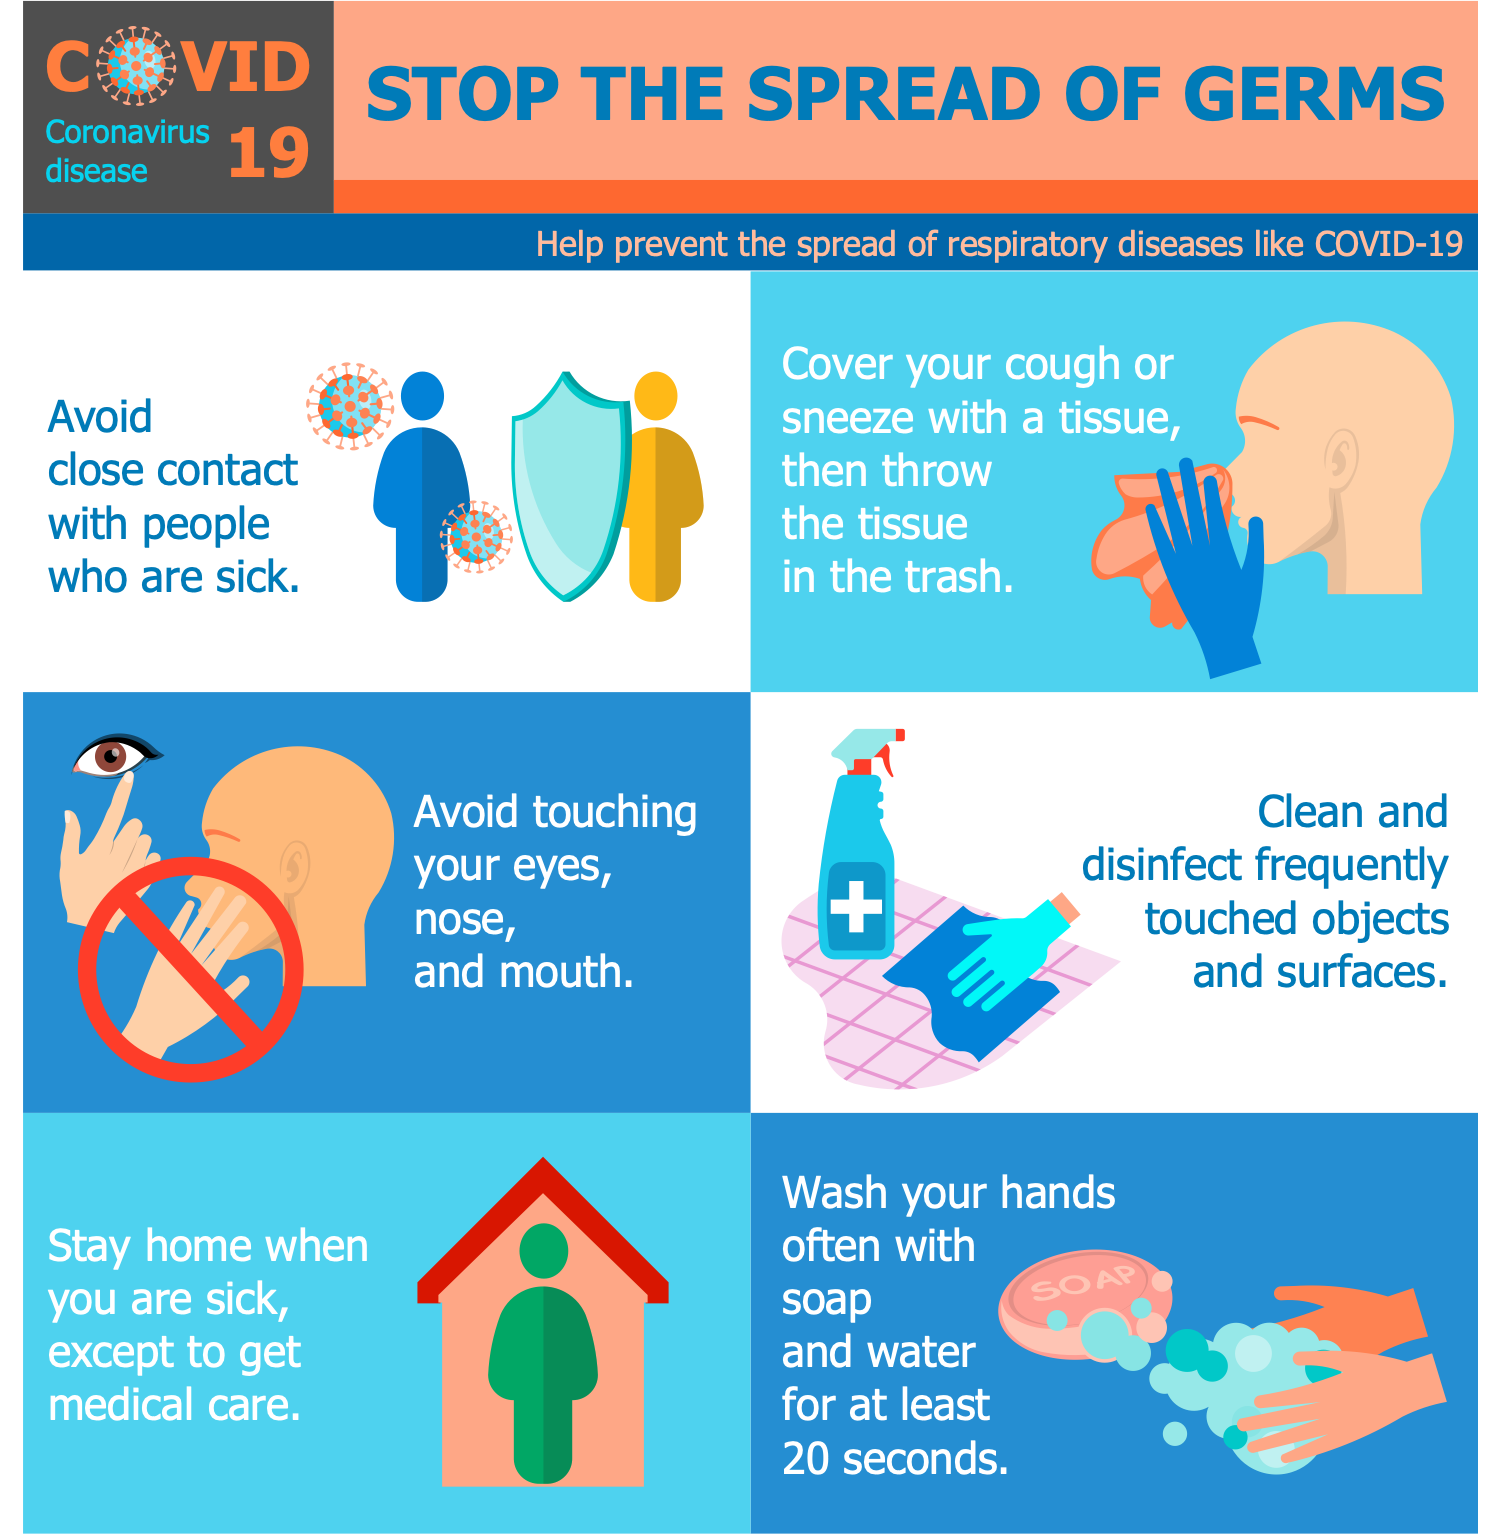
The main way to stop the COVID-19 pandemic is to prevent the spread of the infection. This infographic sample describes all ways how to stop the transmission of respiratory infections like COVID-19. The main points include the compliance of precaution, the use of protection tools and careful observance of personal hygiene rules. It is required to often wash hands with soap and water for at least 20 seconds, use the antiseptics, control yourself to avoid touching the eyes, nose, and mouth with unwashed hands because these are the straight ways of infection penetration. Use the tissues when cough or sneeze and then dispose them directly into a waste container. Increase your immunity and strive to avoid close contact with infected people, if it is absolutely necessary, then use special protective equipment. Stay home when you are sick, except the need to get medical attention, with the obligatory wearing of surgical masks in public to prevent transmission of microbes to people around.
Example 8: Virus Entry Into the Body
This diagram was created in ConceptDraw DIAGRAM using the combination of libraries from the Medical Virology Solution. An experienced user spent 10 minutes creating this sample.
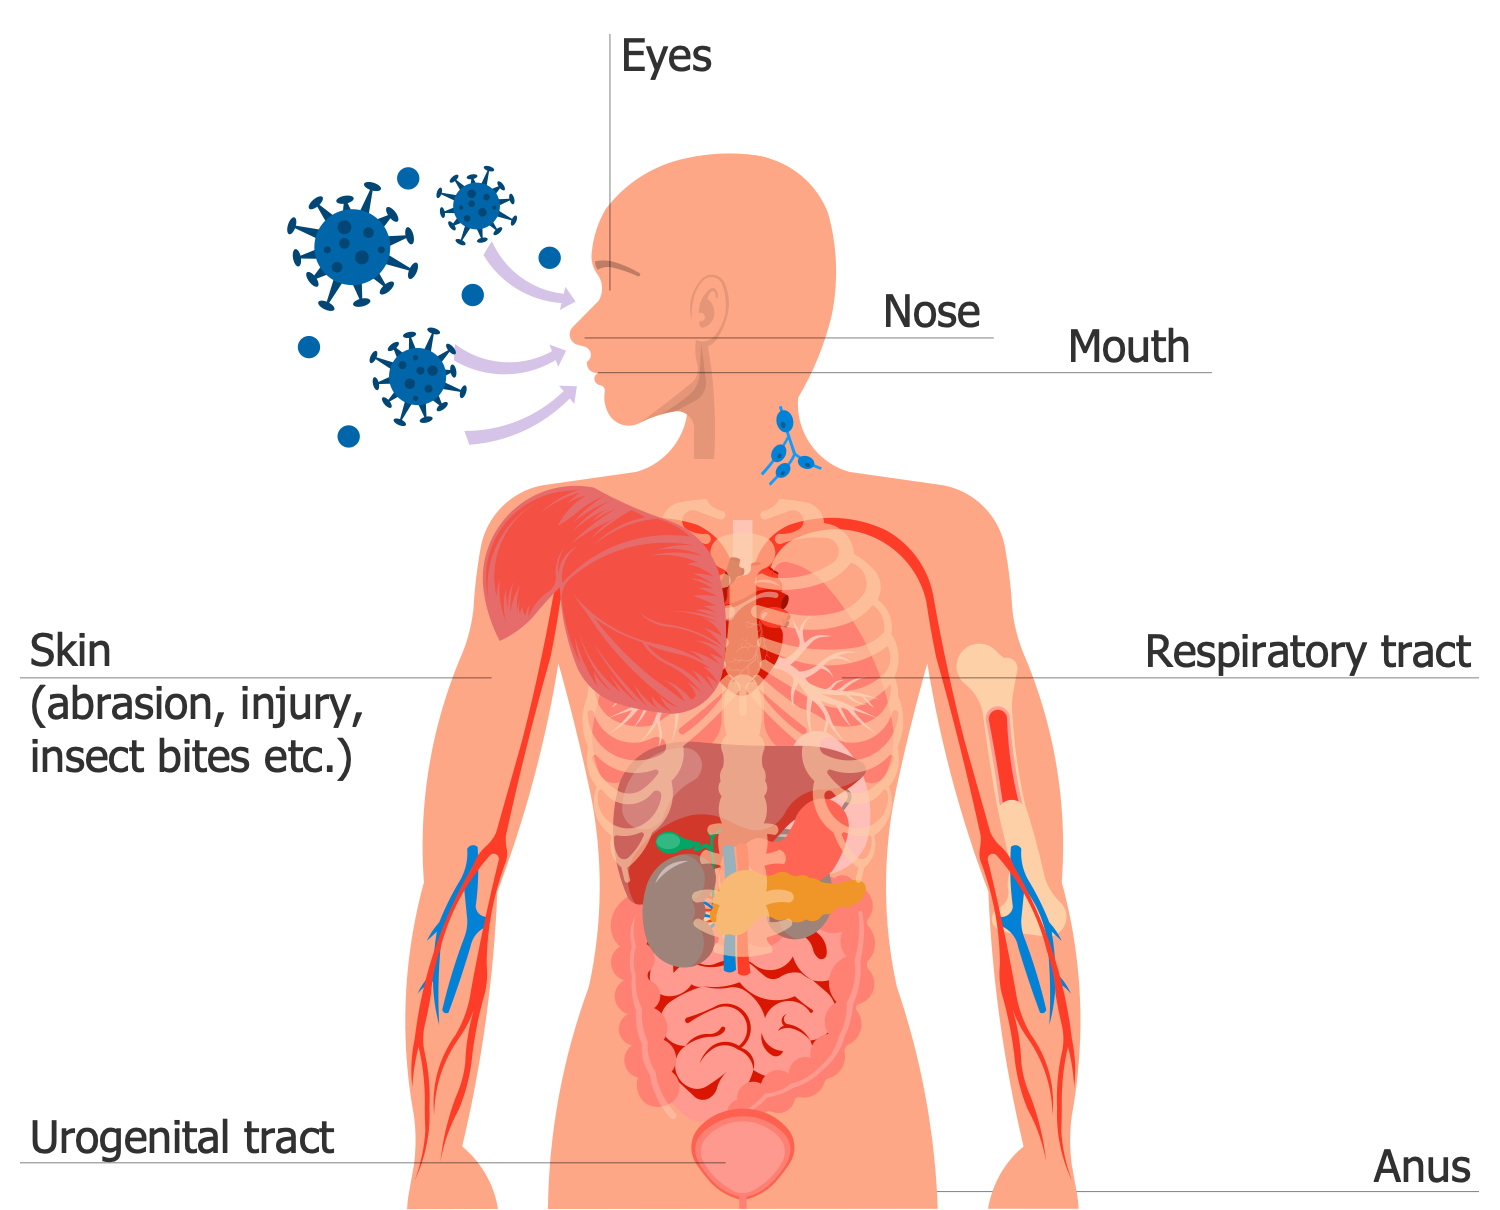
This sample infographic shows the typical pathways for viruses to enter the human body before they multiply, causing harm and destroying the body. The sample was designed based on the Wikimedia Commons file "Typical sites of virus entry into the body.png". The whole set of sites where the virus can be implanted into the body is determined, including damaged areas of the skin, such as various abrasion, cuts, injury, insect bites, and various organs — nose, mouth, eyes, respiratory tract, urogenital system. The vector clipart of the upper part of the human body was used for this visual diagram from the solution's libraries. If needed, this infographic can be easily supplemented with the names of viruses that enter through the listed parts of a body and infect them, information about the stages the viruses pass after the entering the host cells and processes they provoke, immunization, and herd immunity formation.
Example 9: Virus Size
This diagram was created in ConceptDraw DIAGRAM using the combination of libraries from the Medical Virology Solution. An experienced user spent 10 minutes creating this sample.
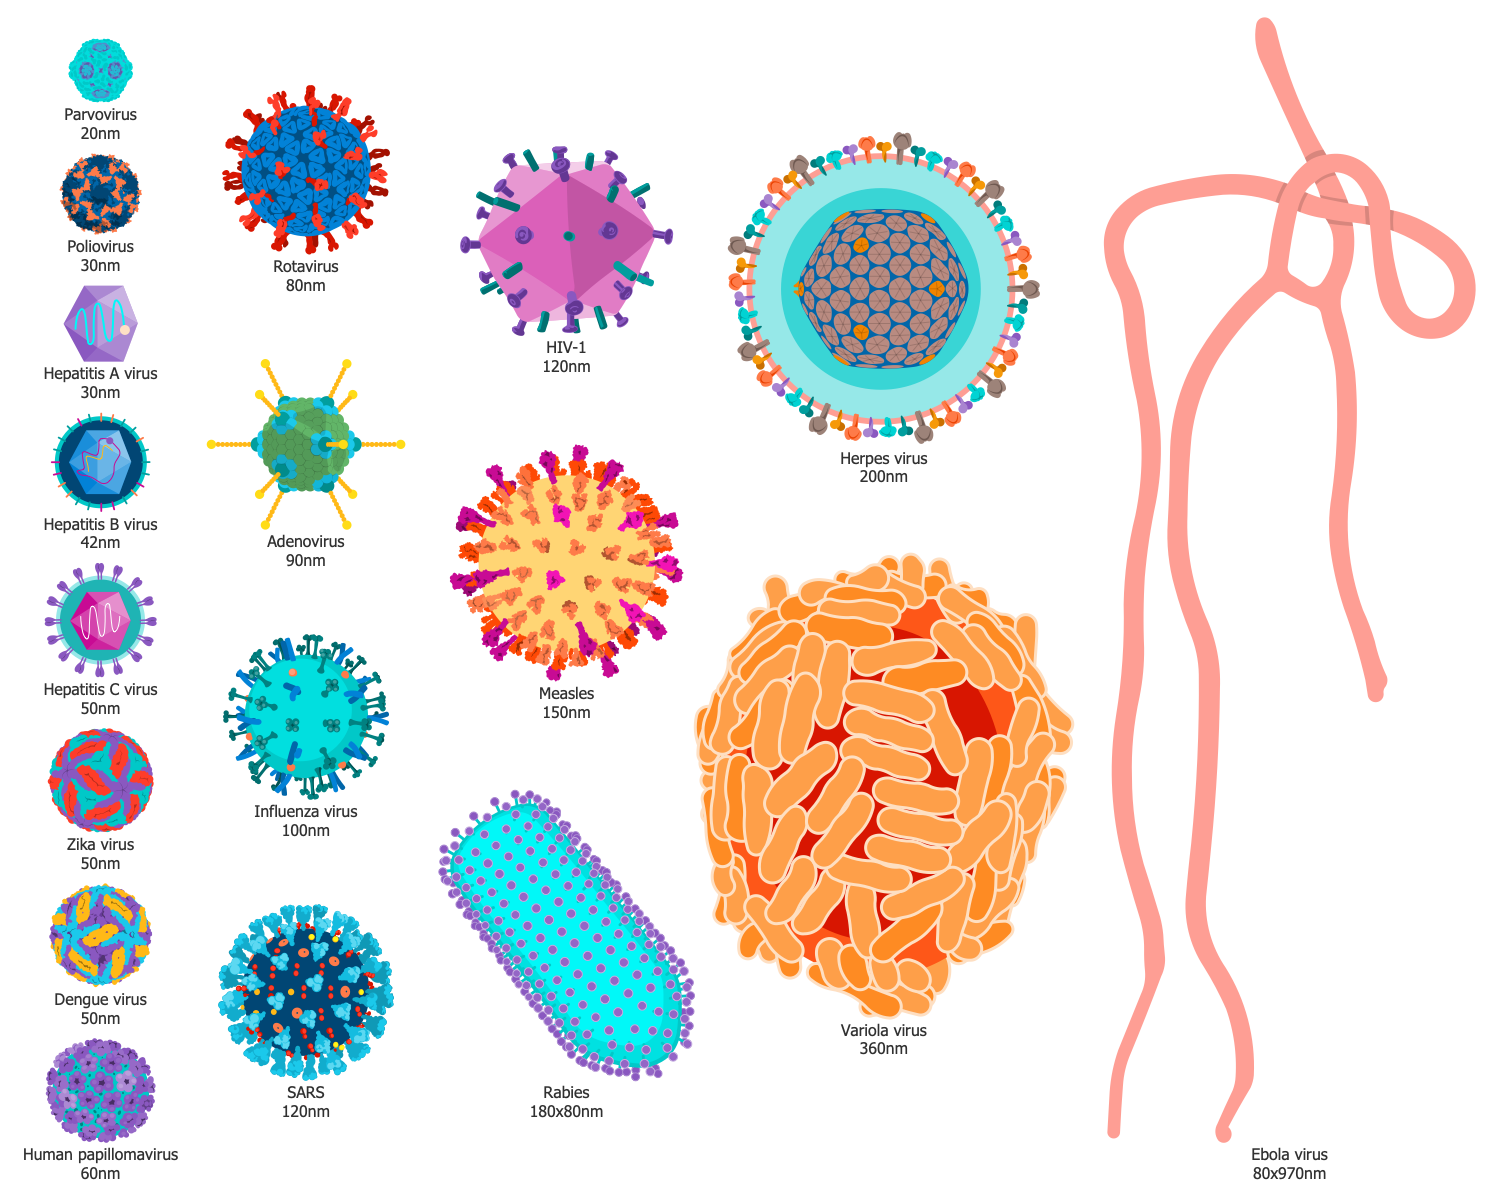
The viruses are the most common living organisms on the planet, tiny intracellular microbes-parasites that live and reproduce only inside a host. Viruses are so small that pass through membrane filters that trap common bacteria. Their sizes range from 15-18 to 300-350 nm. One drop of water can contain about a million viruses. The viral particles are elusive for a human eye and can be seen only with an electron microscope. This informative infographic sample shows the sizes of the most common human viruses. As you see, the size range is great, from 20 nm to 80x970 nm. Parvovirus is the smallest among the presented viruses and the Ebola virus is the largest one. Also pay attention to various forms of viruses, which can be completely different — cubic, spherical, filamentous, rod-shaped, etc. If you wish, less common viruses can also be added to this diagram in just a few seconds, simply drag them from the solution libraries and add the characteristics.
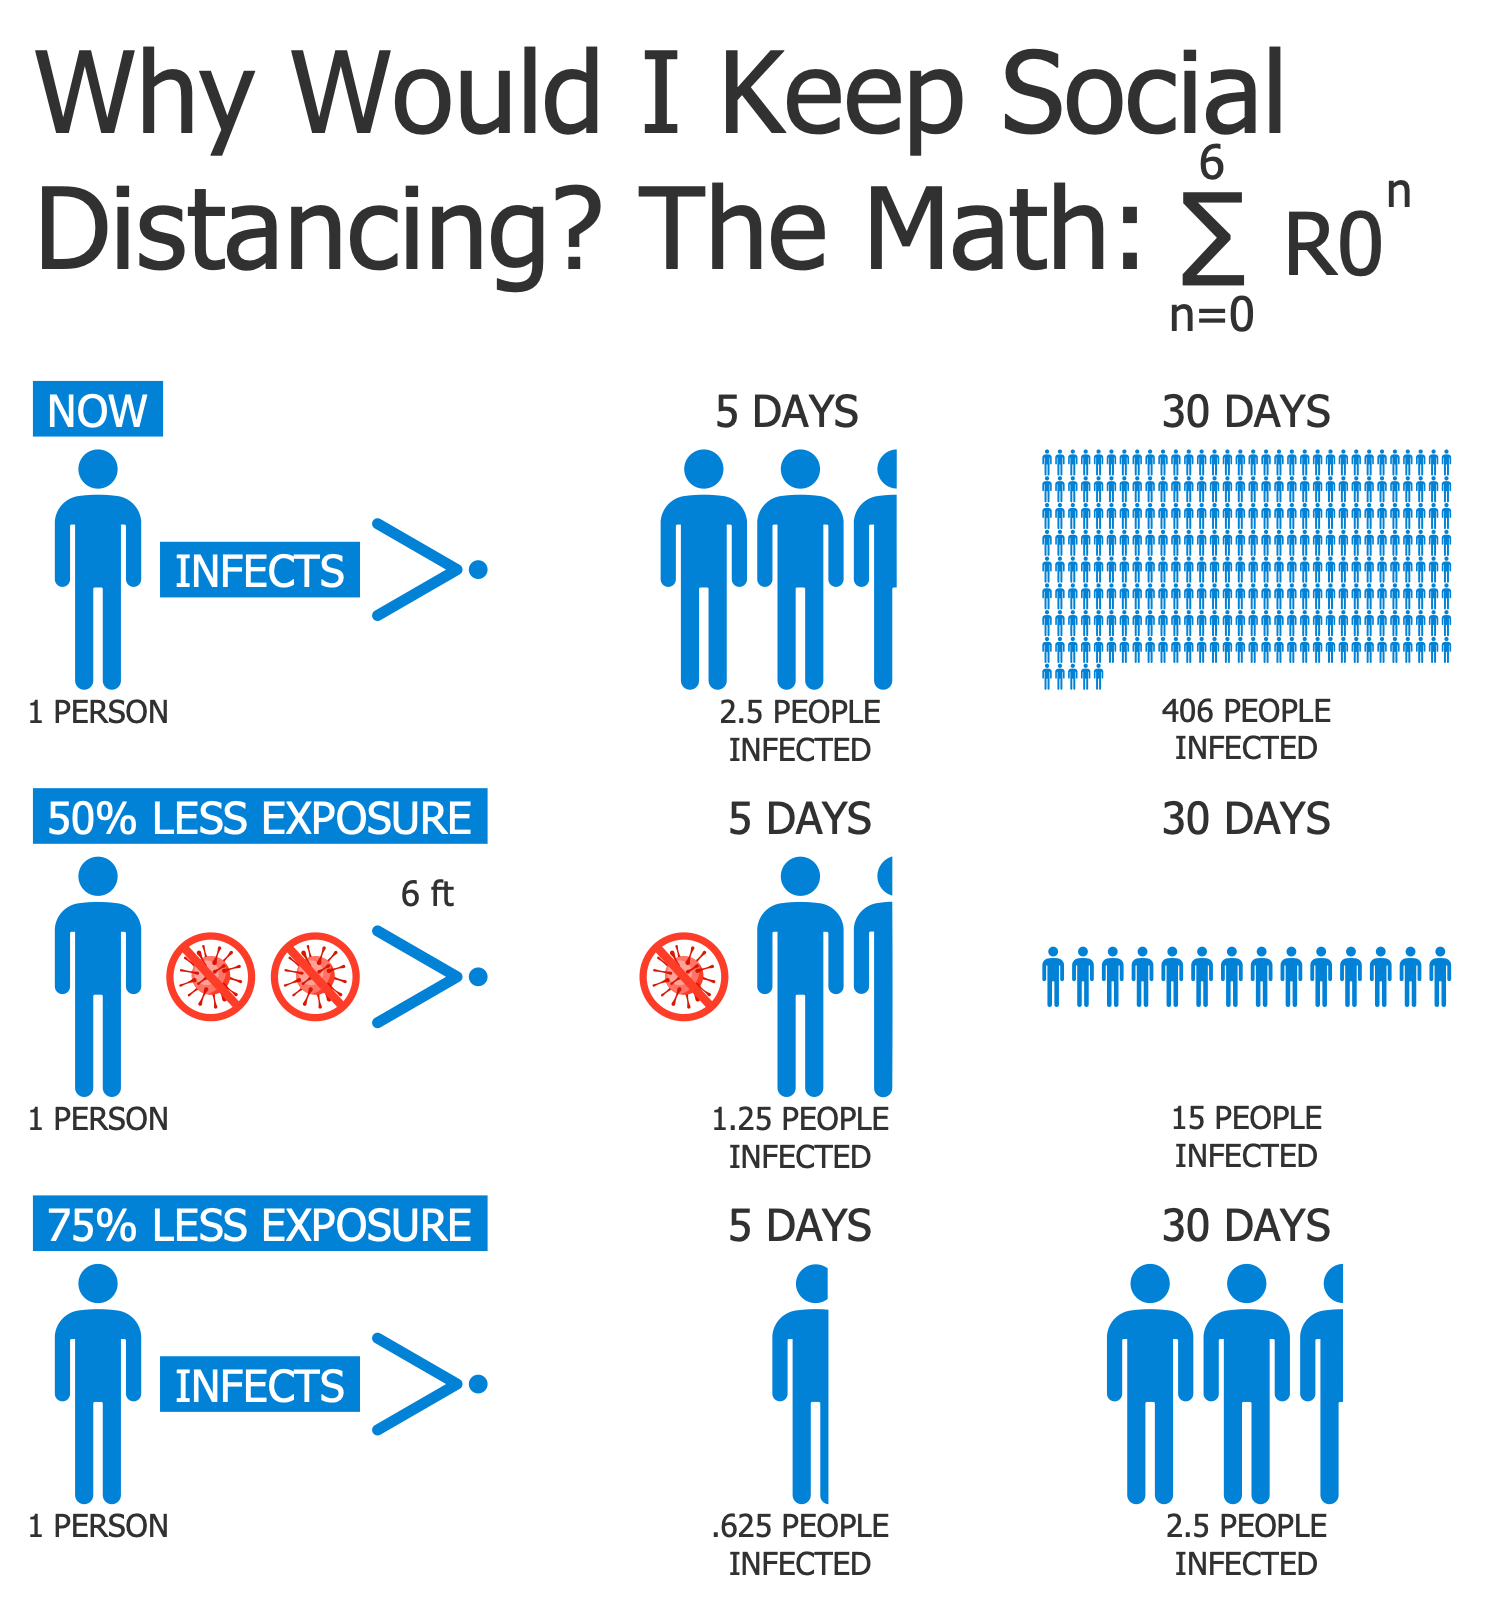
Example 10: Why Social Distancing Matters
This diagram was created in ConceptDraw DIAGRAM using the combination of libraries from the Medical Virology Solution. An experienced user spent 10 minutes creating this sample.
This sample focuses on temporary social distance or physical distancing and why it greatly matters during the pandemic. Social distancing is a set of non-pharmaceutical measures and interventions directed to the prevention of spread of the dangerous contagious diseases. This involves the reduction of close contacts between people, maintaining a physical distance, restriction for gathering in large groups, cancellation of mass gatherings, restriction for the movement of people, isolation, quarantine, the closing of schools and enterprises. These measures allow decreasing the spread of infectious diseases, reducing the probability of contacting with an infected person, so breaking the chain of the disease transmission, reducing the quantity of diseased and deaths in a case of severe diseases, avoiding overburdening healthcare systems. Nevertheless, social distance is justified and effective only in cases of a disease transmitted by airborne droplets, droplet contacts, direct or indirect physical contacts.
Inside
What I Need to Get Started
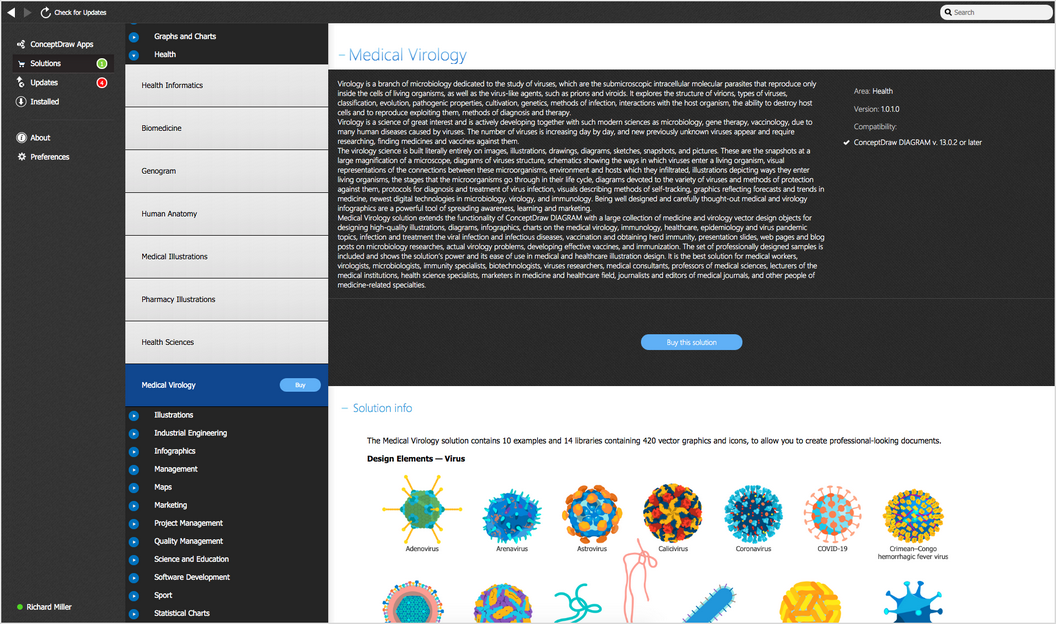
After ConceptDraw DIAGRAM is installed, the Medical Virology solution can be purchased either from the Health area of ConceptDraw STORE itself or from our online store. Thus, you will be able to use the Medical Virology solution straight after.
How to install
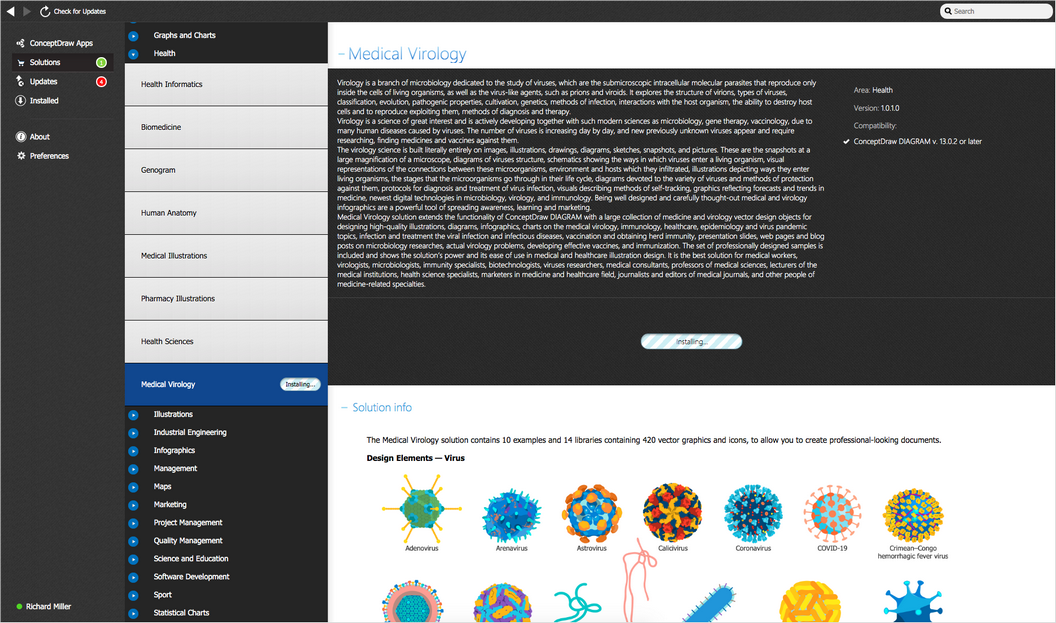
First of all, make sure that both ConceptDraw STORE and ConceptDraw DIAGRAM applications are downloaded and installed on your computer. Next, install the Medical Virology solution from the ConceptDraw STORE to use it in the ConceptDraw DIAGRAM application.
Start using
Start using the Medical Virology solution to make the professionally looking illustrations by adding the design elements taken from the stencil libraries and editing the pre-made examples that can be found there.
