- Electric and Telecom Plans Free
- Fire and Emergency Plans Free
- Floor Plans Free
- Plant Layout Plans Free
- School and Training Plans Free
- Seating Plans Free
- Security and Access Plans Free
- Site Plans Free
- Sport Field Plans Free
- Business Process Diagrams Free
- Business Process Mapping Free
- Classic Business Process Modeling Free
- Cross-Functional Flowcharts Free
- Event-driven Process Chain Diagrams Free
- IDEF Business Process Diagrams Free
- Logistics Flow Charts Free
- Workflow Diagrams Free
- ConceptDraw Dashboard for Facebook Free
- Mind Map Exchange Free
- MindTweet Free
- Note Exchange Free
- Project Exchange Free
- Social Media Response Free
- Active Directory Diagrams Free
- AWS Architecture Diagrams Free
- Azure Architecture Free
- Cisco Network Diagrams Free
- Cisco Networking Free
- Cloud Computing Diagrams Free
- Computer Network Diagrams Free
- Google Cloud Platform Free
- Interactive Voice Response Diagrams Free
- Network Layout Floor Plans Free
- Network Security Diagrams Free
- Rack Diagrams Free
- Telecommunication Network Diagrams Free
- Vehicular Networking Free
- Wireless Networks Free
- Comparison Dashboard Free
- Composition Dashboard Free
- Correlation Dashboard Free
- Frequency Distribution Dashboard Free
- Meter Dashboard Free
- Spatial Dashboard Free
- Status Dashboard Free
- Time Series Dashboard Free
- Basic Circle-Spoke Diagrams Free
- Basic Circular Arrows Diagrams Free
- Basic Venn Diagrams Free
- Block Diagrams Free
- Concept Maps Free
- Family Tree Free
- Flowcharts Free
- Basic Area Charts Free
- Basic Bar Graphs Free
- Basic Divided Bar Diagrams Free
- Basic Histograms Free
- Basic Line Graphs Free
- Basic Picture Graphs Free
- Basic Pie Charts Free
- Basic Scatter Diagrams Free
- Aerospace and Transport Free
- Artwork Free
- Audio, Video, Media Free
- Business and Finance Free
- Computers and Communications Free
- Holiday Free
- Manufacturing and Maintenance Free
- Nature Free
- People Free
- Presentation Clipart Free
- Safety and Security Free
- Analog Electronics Free
- Audio and Video Connectors Free
- Basic Circuit Diagrams Free
- Chemical and Process Engineering Free
- Digital Electronics Free
- Electrical Engineering Free
- Electron Tube Circuits Free
- Electronic Block Diagrams Free
- Fault Tree Analysis Diagrams Free
- GHS Hazard Pictograms Free
- Home Automation and Wiring Free
- Mechanical Engineering Free
- One-line Diagrams Free
- Power Сircuits Free
- Specification and Description Language (SDL) Free
- Telecom and AV Circuits Free
- Transport Hazard Pictograms Free
- Data-driven Infographics Free
- Pictorial Infographics Free
- Spatial Infographics Free
- Typography Infographics Free
- Calendars Free
- Decision Making Free
- Enterprise Architecture Diagrams Free
- Fishbone Diagrams Free
- Organizational Charts Free
- Plan-Do-Check-Act (PDCA) Free
- Seven Management and Planning Tools Free
- SWOT and TOWS Matrix Diagrams Free
- Timeline Diagrams Free
- Australia Map Free
- Continent Maps Free
- Directional Maps Free
- Germany Map Free
- Metro Map Free
- UK Map Free
- USA Maps Free
- Customer Journey Mapping Free
- Marketing Diagrams Free
- Matrices Free
- Pyramid Diagrams Free
- Sales Dashboard Free
- Sales Flowcharts Free
- Target and Circular Diagrams Free
- Cash Flow Reports Free
- Current Activities Reports Free
- Custom Excel Report Free
- Knowledge Reports Free
- MINDMAP Reports Free
- Overview Reports Free
- PM Agile Free
- PM Dashboards Free
- PM Docs Free
- PM Easy Free
- PM Meetings Free
- PM Planning Free
- PM Presentations Free
- PM Response Free
- Resource Usage Reports Free
- Visual Reports Free
- MindMap Diagrams $99
- House of Quality Free
- Quality Mind Map Free
- Total Quality Management TQM Diagrams Free
- Value Stream Mapping Free
- Astronomy Free
- Biology Free
- Chemistry Free
- Language Learning Free
- Mathematics Free
- Physics Free
- Piano Sheet Music Free
- Android User Interface Free
- Class Hierarchy Tree Free
- Data Flow Diagrams (DFD) Free
- DOM Tree Free
- Entity-Relationship Diagram (ERD) Free
- EXPRESS-G data Modeling Diagram Free
- IDEF0 Diagrams Free
- iPhone User Interface Free
- Jackson Structured Programming (JSP) Diagrams Free
- macOS User Interface Free
- Object-Role Modeling (ORM) Diagrams Free
- Rapid UML Free
- SYSML Free
- Website Wireframe Free
- Windows 10 User Interface Free
MindMap Diagrams
Today, business is extremely diverse, and business processes cover a wide variety of areas. Many business processes are implemented in different areas that lead to business success, achievements, the development of popular products and profits. At the same time, various business problems and complex management tasks that require prompt solutions arise in business every day.
The modern ways of project development and implementation, product promotion and advertising include different methods and technics. Some of the most efficient are visual diagrams, charts, graphics, infographics, and illustrations. They help in the visualization of the project development and implementation steps, assigning terms for execution of the specified tasks and tracking their execution, calculation costs, rationally distributing work and material resources. Visualization is an incredibly important point, because it increases the interest of the audience, helps to clear information and data, facilitate their perception and analysis.
The diagrams help to structure the information and data, identify patterns and dependencies and efficiently impact the business processes. They assist in tracking the results, correctness, and usage of project resources at each stage of project implementation. Diagrams and charts help to analyze the results, achievements, income and investments, and their rationality of use, evaluate risks, and track business project dynamics.
PESTLE Analysis, Stakeholder Onion Diagrams, Funnel Diagrams, Venn Diagrams, Matrix Diagrams are efficient in the business field and useful for all business-related people, marketing experts, business analysts, business managers, PR managers, advertising specialists, and many other stakeholders in their daily work with both long-term and short-term projects.
The MINDMAP Diagrams solution supplies ConceptDraw Solution Park and ConceptDraw MINDMAP software with a collection of samples and templates and mindmapping tools offering great opportunities for business, marketing, management, advertising, analytics, and sales. The MINDMAP diagrams collection includes Funnel Diagrams, PESTLE Analysis Diagrams, Stakeholder Onion Diagrams, Venn Diagrams, and Matrix Diagrams that help in projects development, planning and analyzing, visualizing the relationships that exist in the project environment, assigning stakeholders that impact the project and displaying their level of engagement. The solution assists in the efficient planning and implementation of your project with Mind Map, realignment, automation processes, and increasing profits.
-
Buy this solution $99 -
Solution Requirements - This solution requires the following products to be installed:
ConceptDraw MINDMAP v16 - This solution requires the following products to be installed:
-
Support for this Solution -
Helpdesk
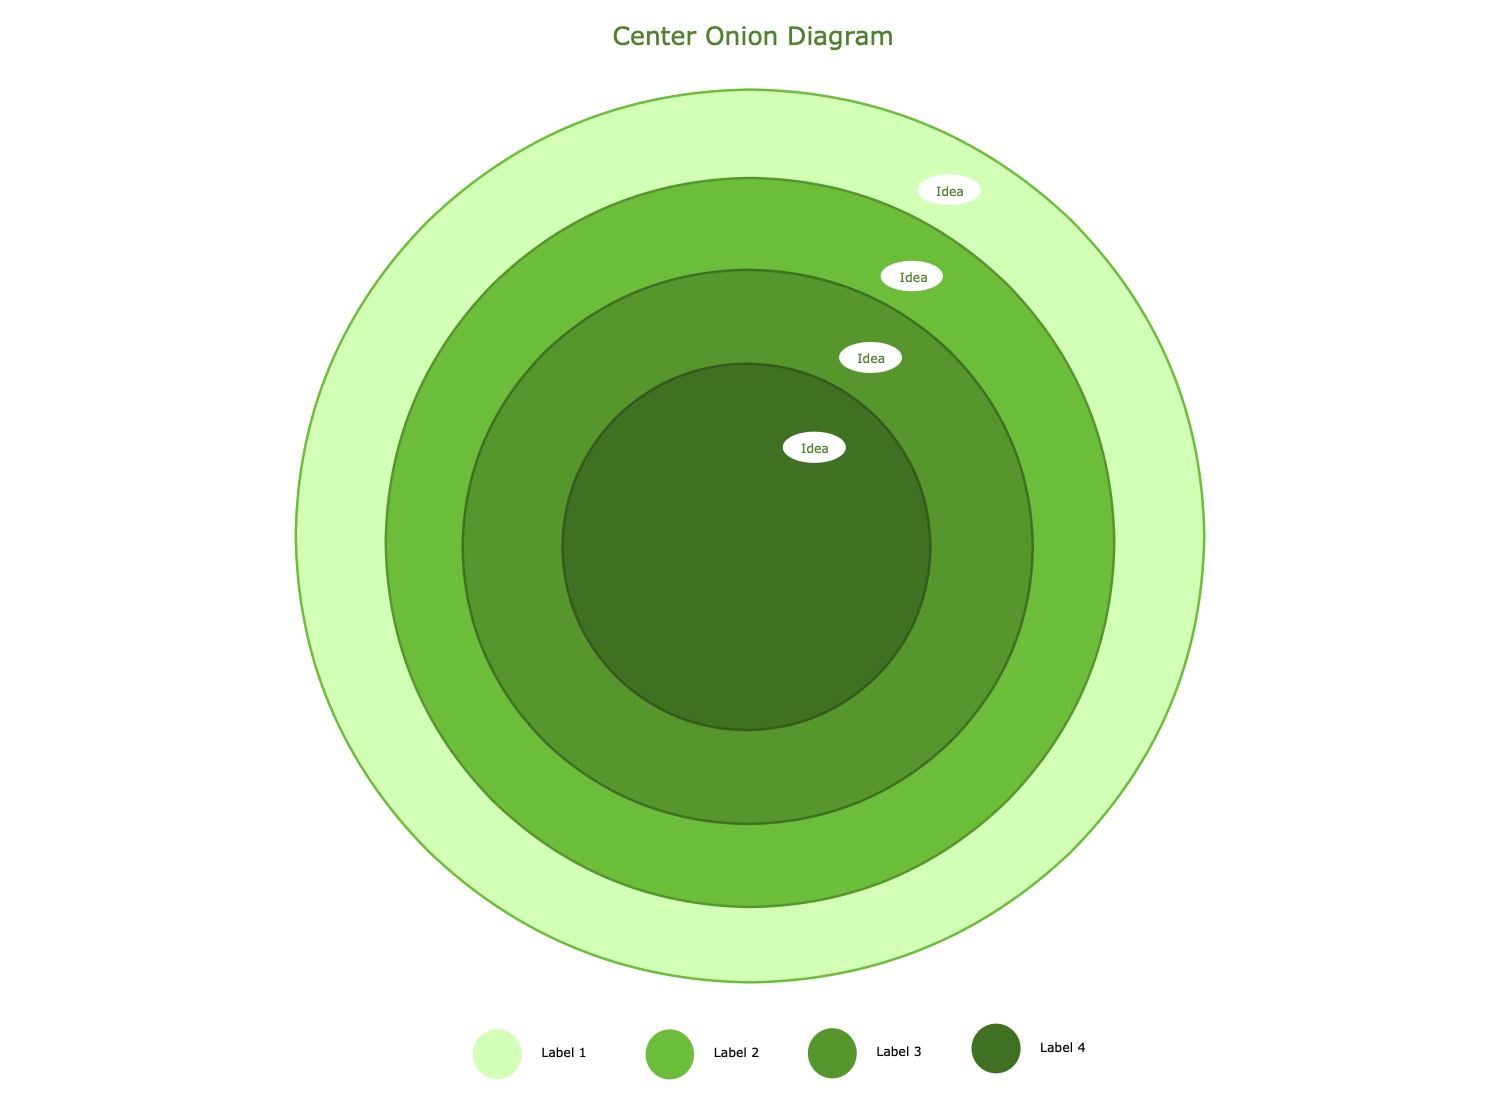
Template 1: Center Onion Diagram Template
This template is a Round Onion Diagram template with a central circle and three concentric layers around it. It is a convenient base for quick-start drawing your own Stakeholder Onion Diagram, which is a powerful project management tool. The diagram helps to identify and show all groups of stakeholders for a certain project or product and visualize their level of engagement and impact on the end result of the project. Typically, the closer to the center of the diagram a stakeholder is, the higher is its level of engagement and influence on the project. You can always update your diagram if something changed in the distribution of responsibilities in your company or current project. The legend displays the correspondence of the colors of layers to stakeholders. The size, color, and quantity of layers may be changed on your own and according to your project requirements.
Template 2: Onion Diagram Template
This template is an Onion Diagram template. It includes four eccentric circles of different colors. All you have to do is just to fill out this template with your own data. Enter the name of the project, product, service, solution, or goal in the central circle of the diagram. Other eccentric layers typically include information about all stakeholders who interact with a current project. Both internal and external stakeholders may be included, but at different levels of the diagram, external are mostly further from the center. Often the intensity of a stakeholder's influence also impacts its placement in the diagram relative to the center. Once the diagram is ready, you can also change its color style according to your taste, and decrease or increase the sizes of circles. It is popular to highlight the circles with the most significant project stakeholders with more bright colors or more intense shades to attract special attention to them.

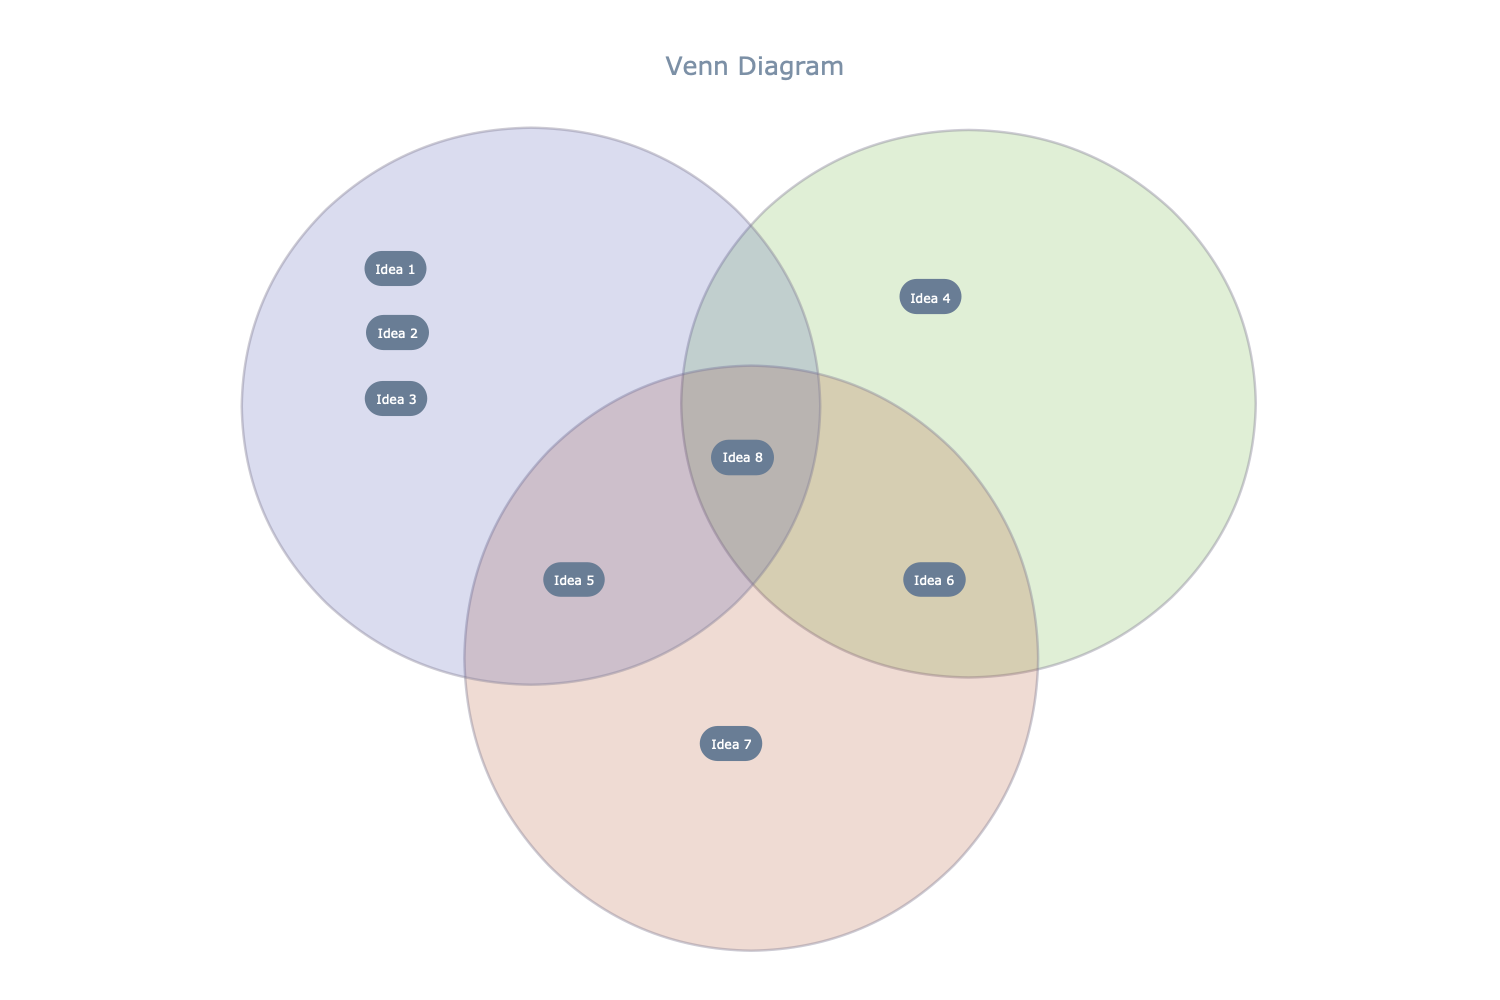
Template 3: Venn Diagram Template
This template is a Venn Diagram template. It consists of three intersecting circles representing different sets. Their intersections visualize the logical relationships between datasets and include elements that have similar properties by combining the properties of corresponding pairs of overlapping datasets. The intersection of all three sets is taken in the middle of the diagram and includes elements with the properties of all three sets. In the diagram, the sets differ in color, but you are free to choose them at your discretion, and you can also use the same colors. In any case, it is recommended to visually highlight the intersection in order to attract the attention of viewers. Due to the transparency of the objects, the blending of colors at intersections in this template is automatic. Using a template and powerful mindmapping tools is the easiest and fastest way to create your own Venn Diagram.
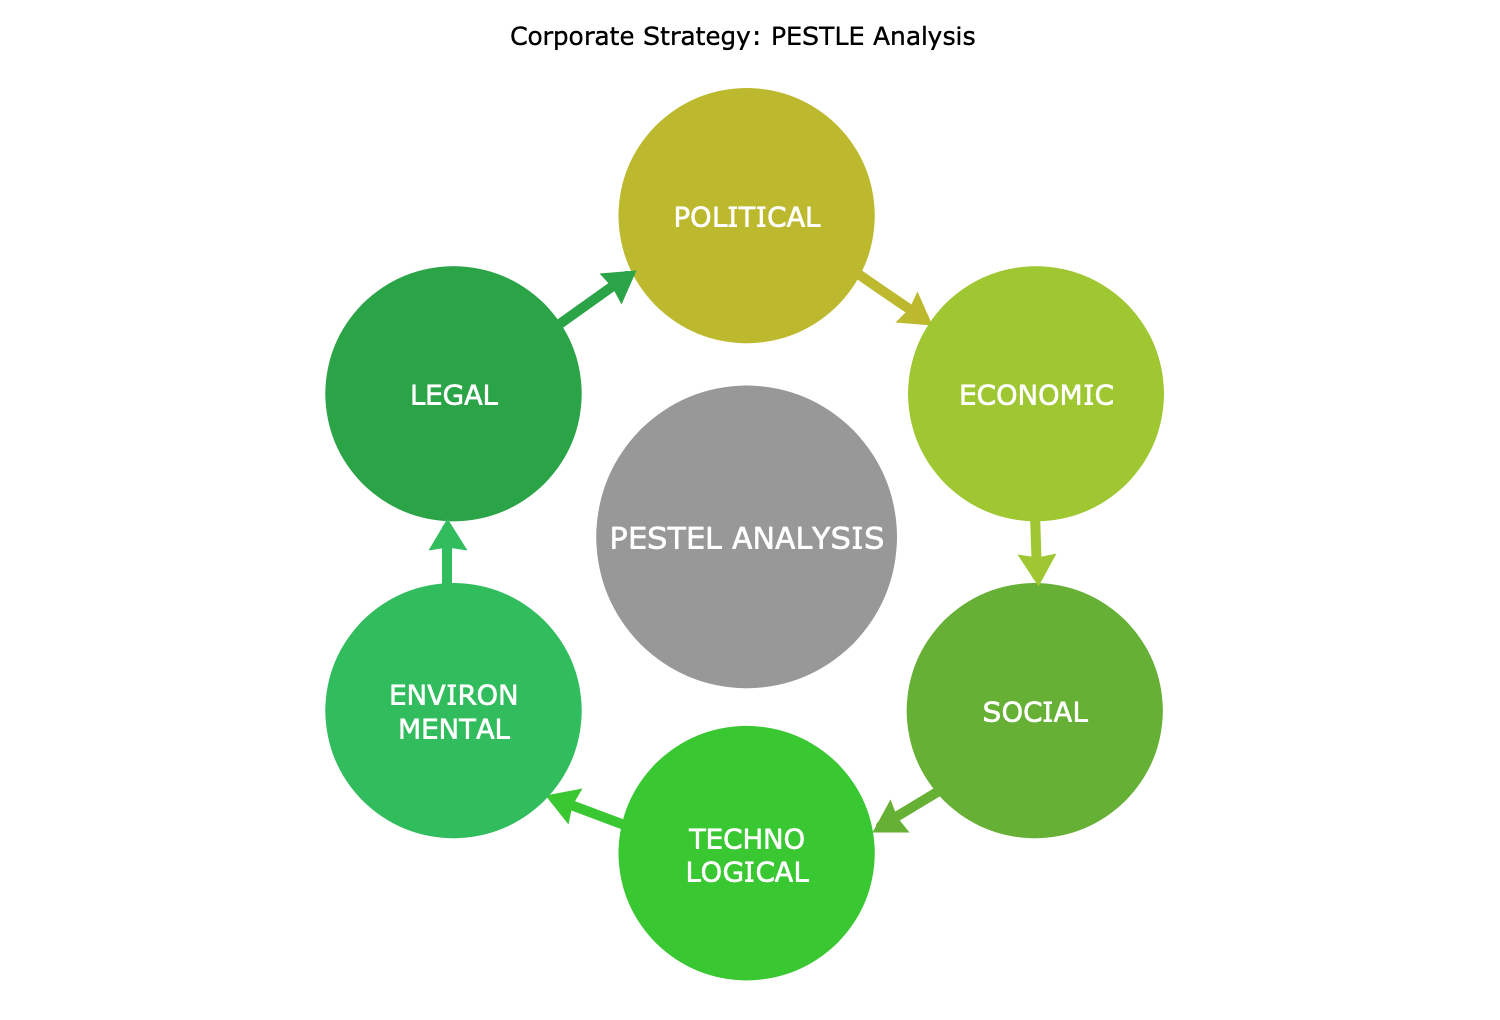
Example 1: Corporate Strategy — PESTLE Analysis
This sample shows PESTLE or PESTEL Analysis Diagram dedicated to corporate strategy. It studies the key external factors that may have a significant impact on the organization's performance or project implementation. These include political, economic, sociological, technological, environmental, and legal factors. PESTLE analysis is used in strategic decision making, to validate changes in the business environment, identify risks, and facilitate understanding of the broader business environment. It promotes external and strategic thinking, helps identify business opportunities, achieve marketing goals in a timely manner, analyze opportunities and anticipate threats associated with personnel changes in order to avoid or minimize their further impact. Being used together with SWOT analysis, Porter's Five Forces, competitor analysis, or scenario planning, PESTLE analysis gives greater results, better understanding of a situation and related internal and external factors.
Example 2: Funnel Diagram
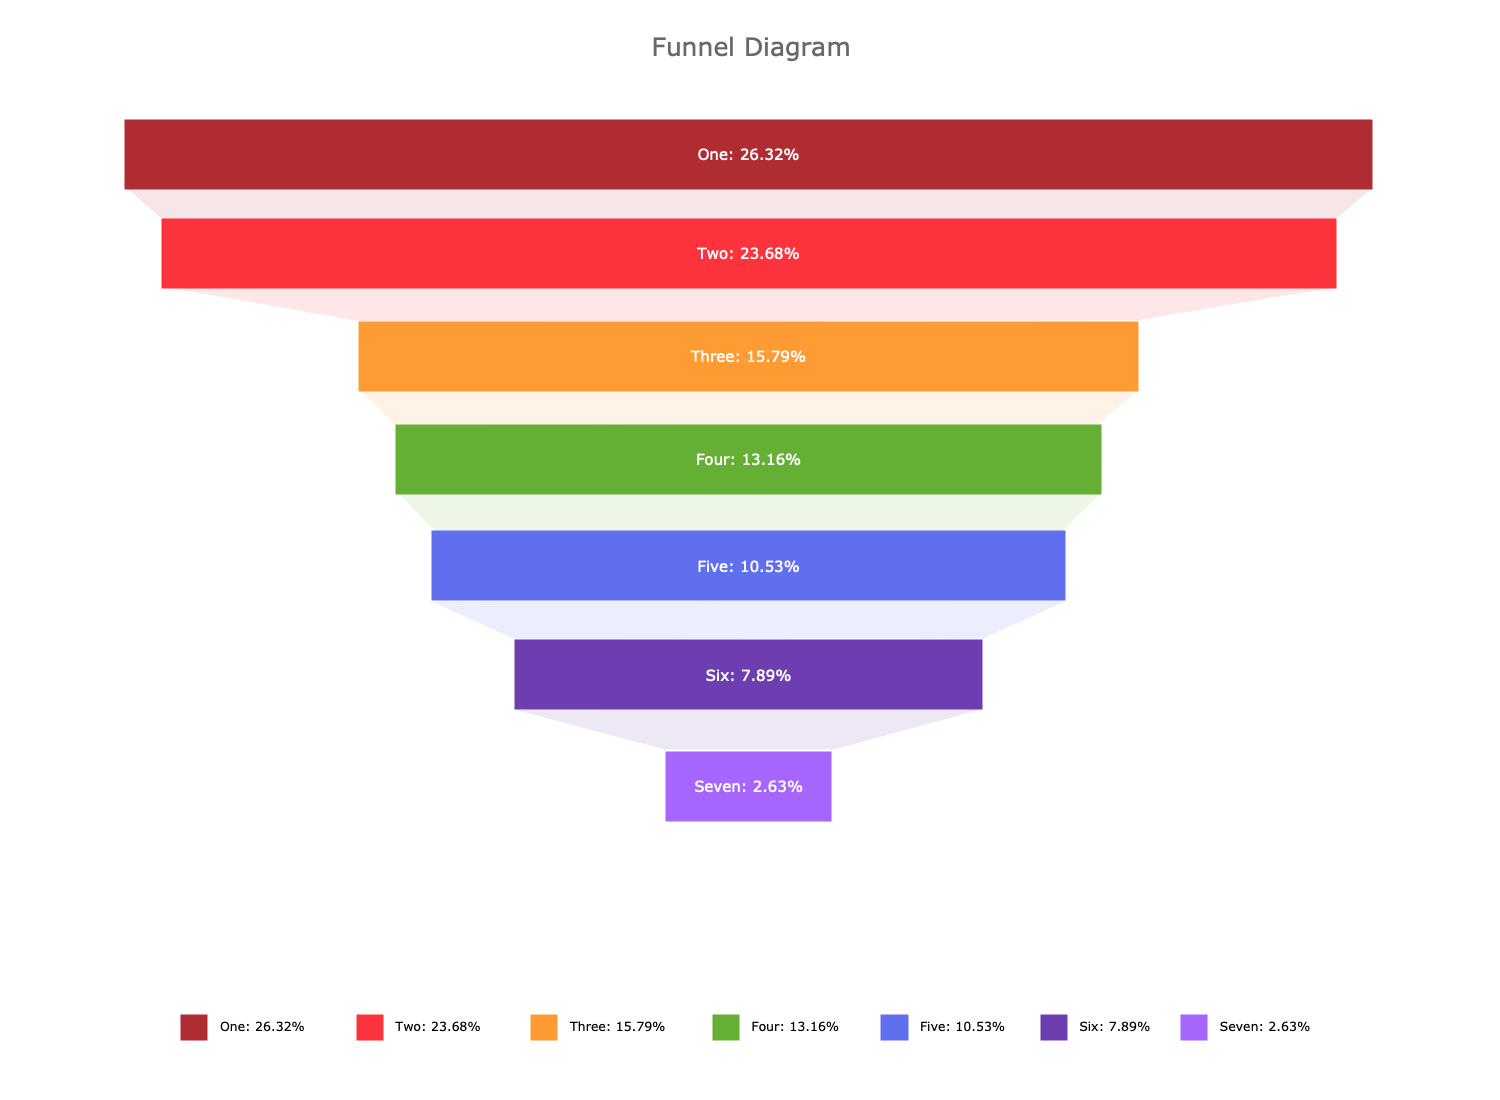
This sample shows the Funnel Diagram consisting of 7 steps. It has a form of a funnel or an inverted pyramid because its steps represent data the amount of which decreases step by step from the top down. Funnel Diagram is a powerful tool for business, management, sales, and advertising. It helps to track business performance, analyze company productivity, manage sales, identify bottlenecks, influence consumers, and increase profits. An ideal funnel gradually narrows, a sharp narrowing of the funnel at the third step indicates the need to improve the quality of management and the sales process. A Funnel Chart is a direct way to properly manage a marketing campaign and track its progress and success. You can change the number of funnel stages, their size, color, and other options to suit your needs. Design easily your MindMap Diagrams with Funnel Charts in ConceptDraw MINDMAP software.
Example 3: Matrix Diagram
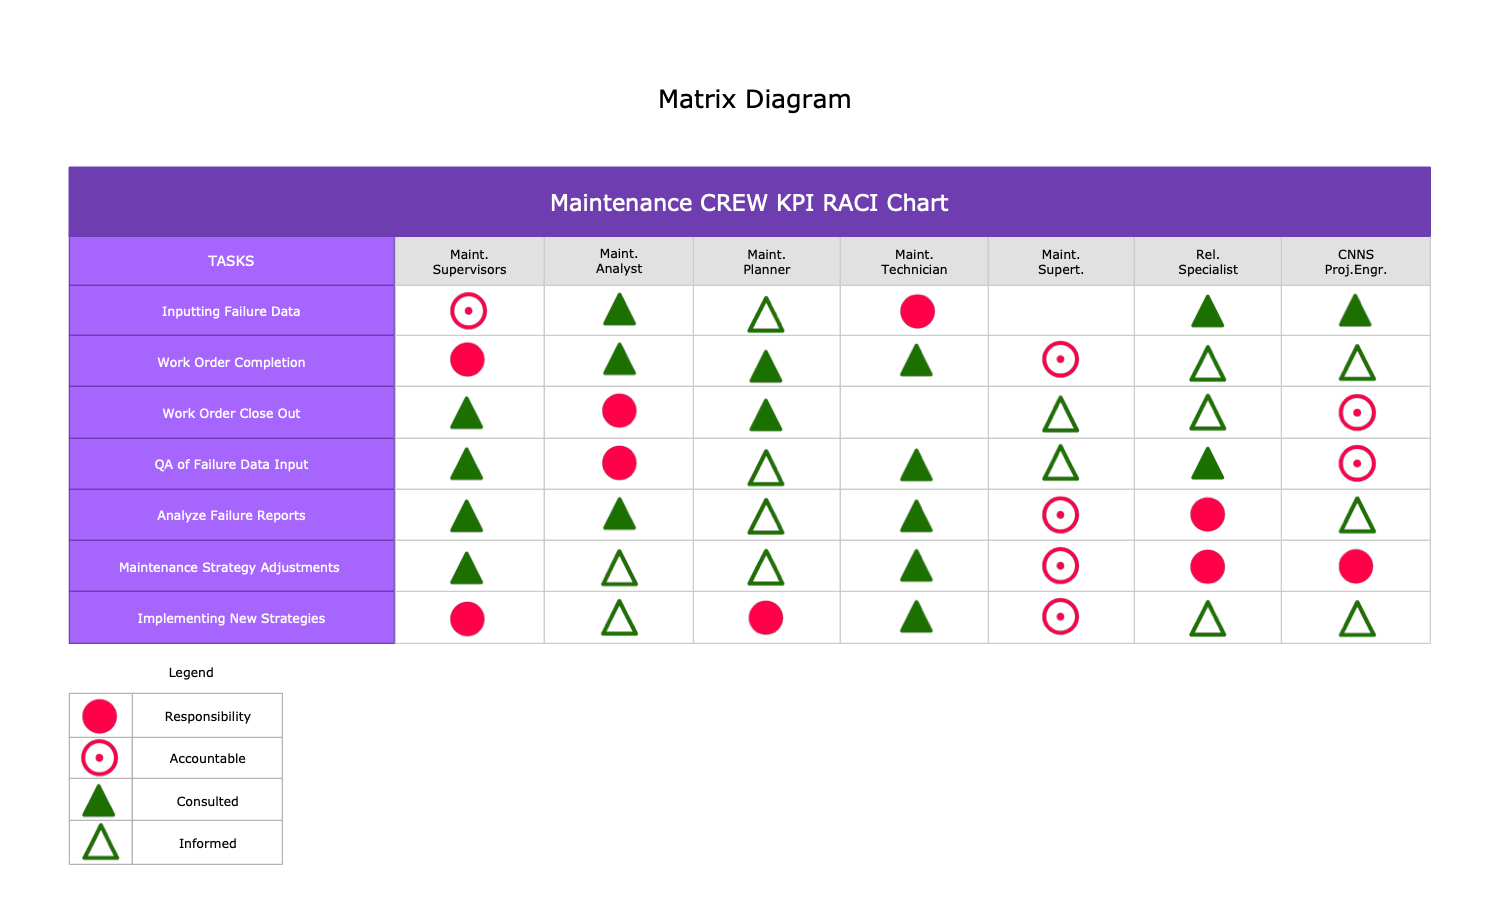
This Matrix Diagram sample shows the KPI RACI (Responsible, Accountable, Informed, or Consulted) Chart for the maintenance CREW. It focuses on the position, not on individuals. You can see a list of all positions involved in the current service process and the tasks that their employees perform. The diagram shows who is responsible, accountable, consulted and informed, and on what issues. It indicates KPIs, data and information required for employees to execute their accountabilities and responsibilities successfully. Once the diagram is filled, it requires to be analyzed. Check that workload is distributed correctly among the work group and corresponds to the job descriptions. RACI Chart assists in enhancing KPIs and scorecards. At the same time, please note that the RACI schedule needs to be reviewed and updated regularly as business conditions change. A legend explaining the meaning of the symbols used is at the bottom of the diagram.
Example 4: Sales Funnel Diagram
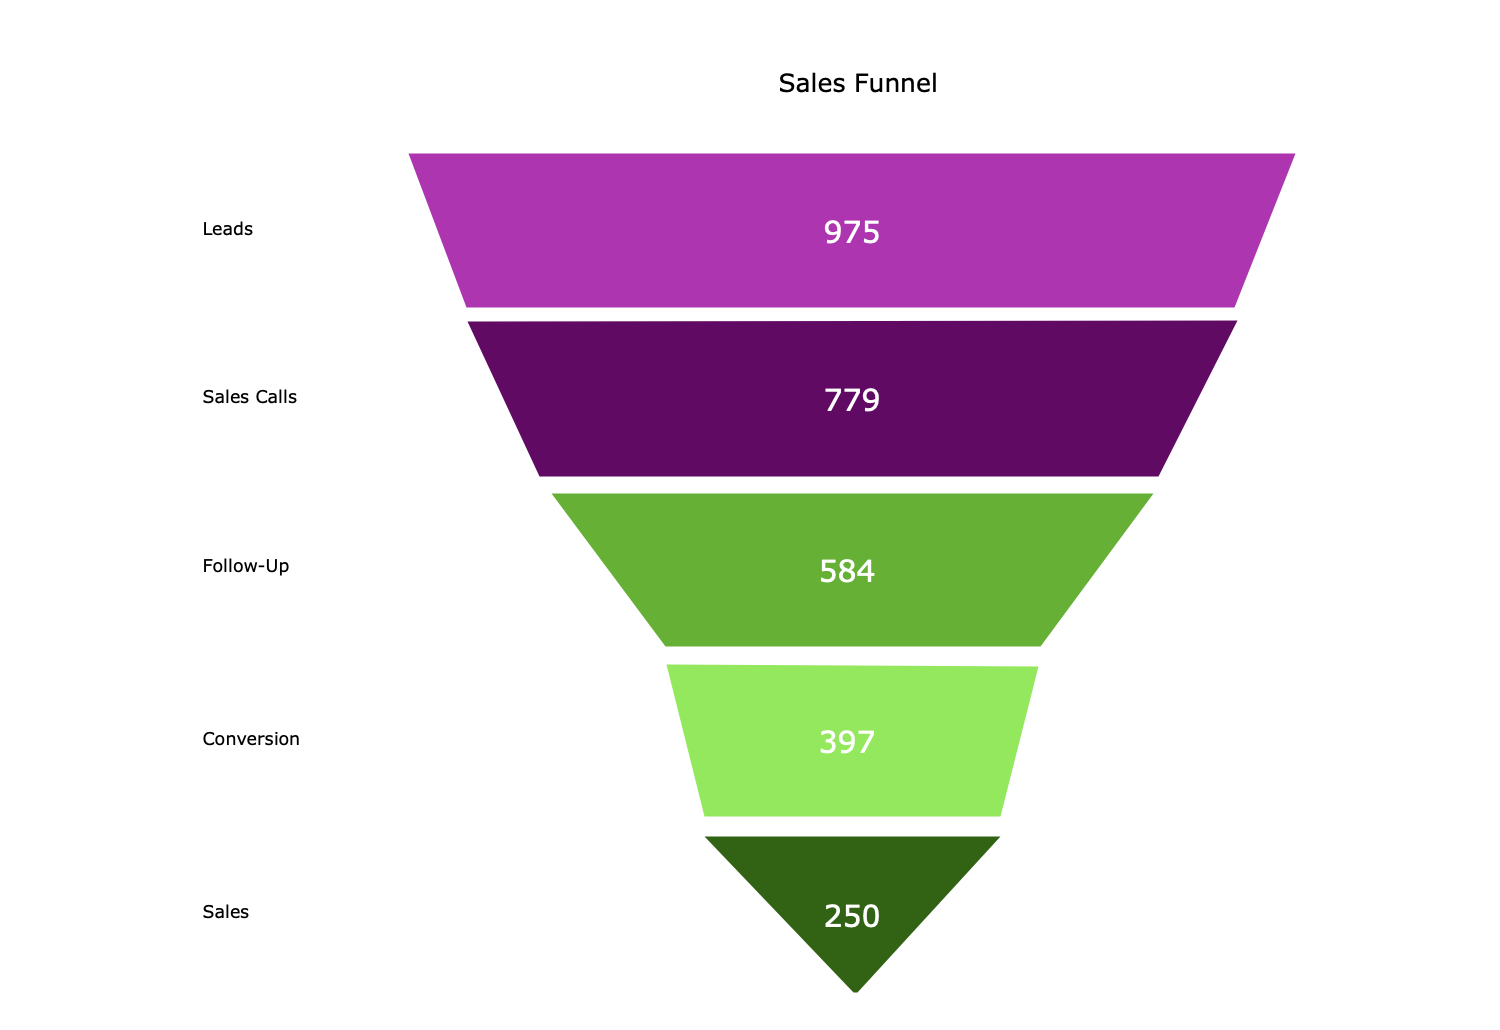
This sample shows the 5 stages of the Sales Funnel Diagram: Leads, Sales calls, Follow-up, Conversion, and Sales. A Funnel Diagram is an effective marketing and sales tool, a way to increase business productivity, increase sales of goods or services, and increase company profits. It is a way of displaying, observing and analyzing the stages of the customer's journey from the first contact with a product or service to their purchase. Sales Funnel Diagram allows you to compare performance at different levels to decide on the next steps. In terms of styling, you are free to choose the color of the funnel stages, the position of the text — in the funnel stage objects, outside of them, or a combination of both of these options, such as in this example. Colorful and attractive clipart and icons from the ConceptDraw MINDMAP icon packs and graphics libraries are the best addition to your Funnel Chart, making it more visual, attractive and informative.
Example 5: Stakeholder Onion Diagram
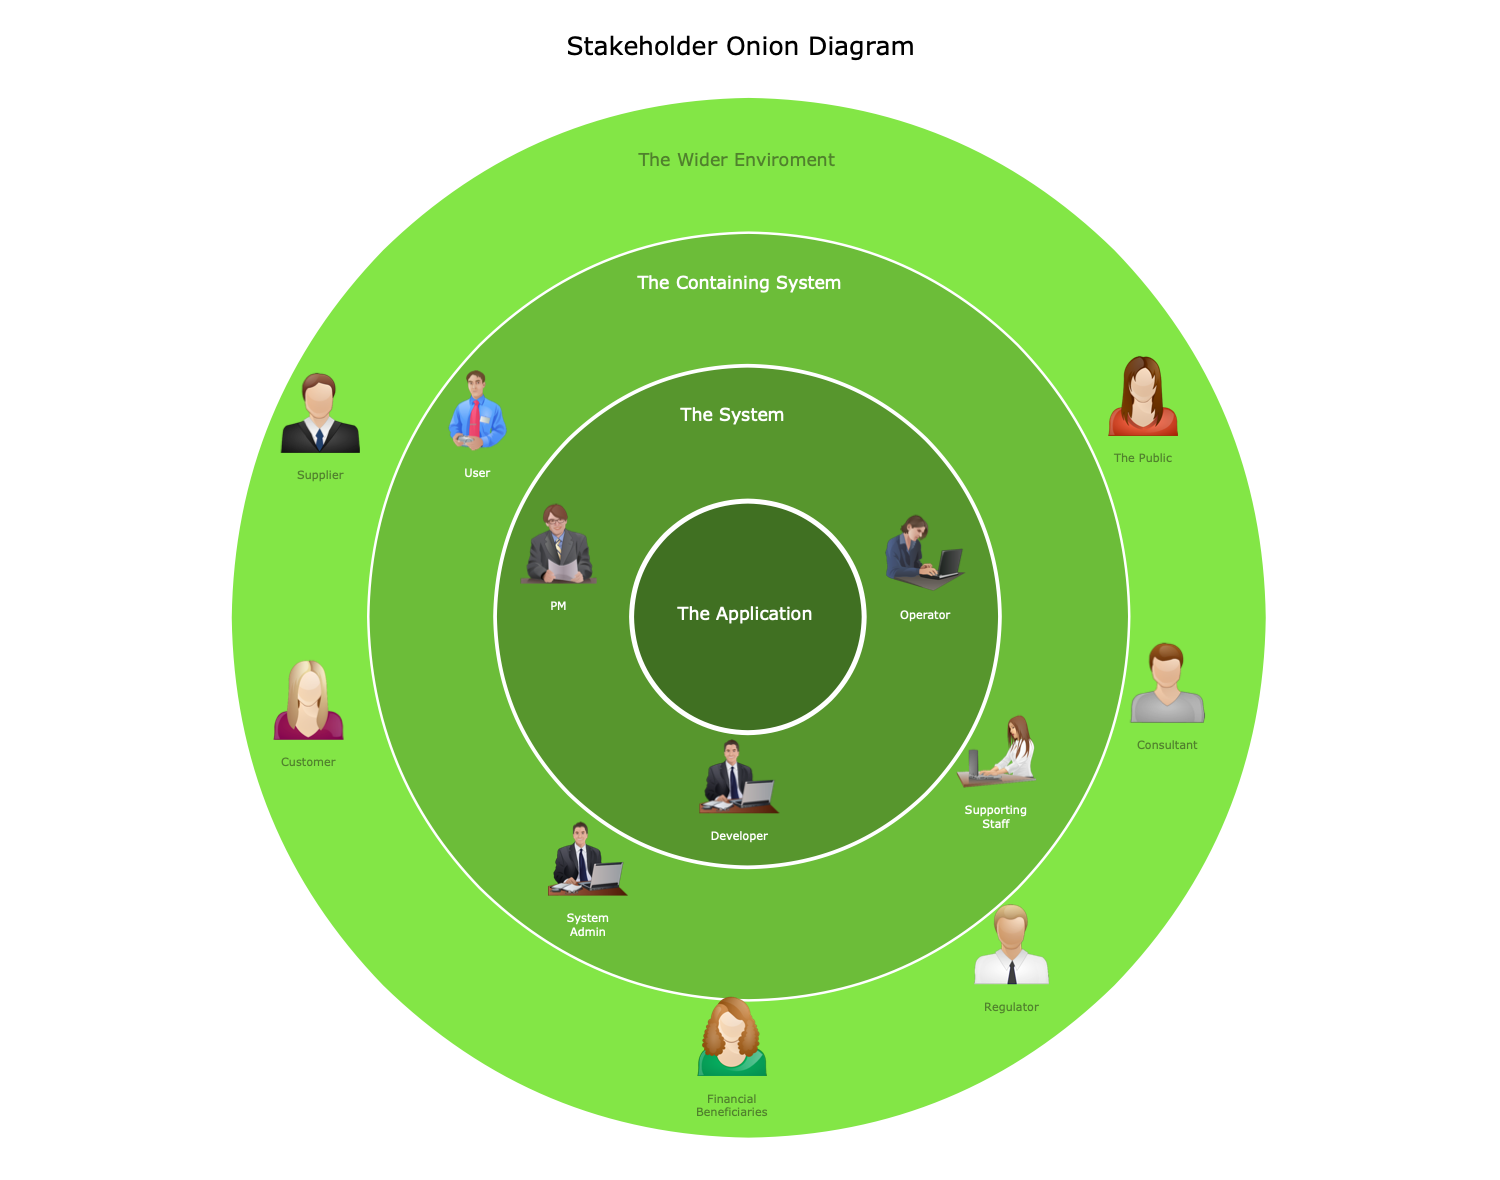
This example shows a Round Onion Chart with 4 parts: a main circle in the center and 3 concentric circles around it. The name comes from the resemblance to the cross section of the onion. The main circle represents the product — application on this sample. It shows the dependencies between the parts of the process, the relationship of the stakeholders in relation to the application which is the key goal of the project, the importance of the stakeholders and their impact on the project and the success of the final product. Stakeholder Onion Diagram shows data in a simple visual form, each subsequent layer of the diagram depends on the components of the previous layer and contains additional data. This helps in further stakeholder analysis. You can use this sample from the MINDMAP Diagrams solution of the ConceptDraw Solution Park in your work to easily create your own Stakeholder Onion Charts.
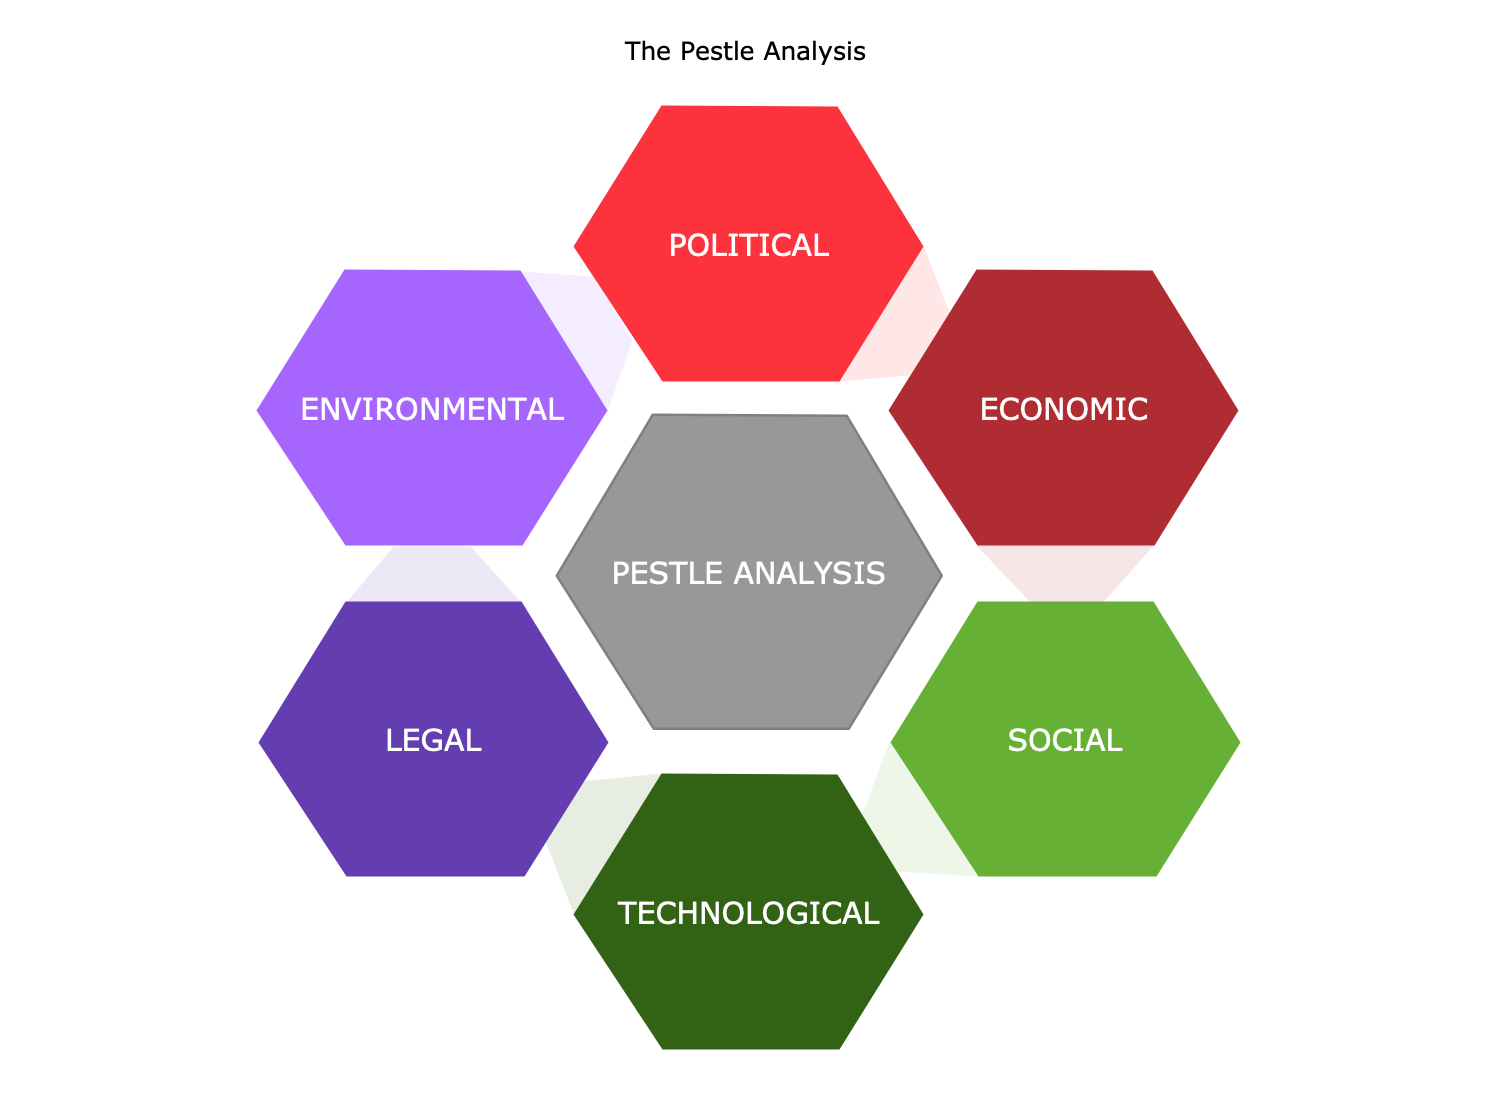
Example 6: PESTLE Analysis
This sample shows the PESTLE Analysis Diagram, which reflects the information on external factors that impact a business or industry. PESTLE analysis is based on a set of factors, these are political, economic, social, technological, legal, and environmental factors. It is an efficient strategic business planning tool. PESTLE analysis helps to evaluate business risks and identify key risk factors, opportunities, and prospects, determine if a product or service still meets the market needs. PESTLE analysis helps detect long-term trends, provides information about brand positioning and business direction, disruptions, helps to determine the new directions for the development and validity of existing products. It is efficient when starting a new business or entering a foreign market. Combine PESTLE analysis with SWOT analysis, competitor analysis, Porter's Five Forces, and other analytics technics to improve business results.
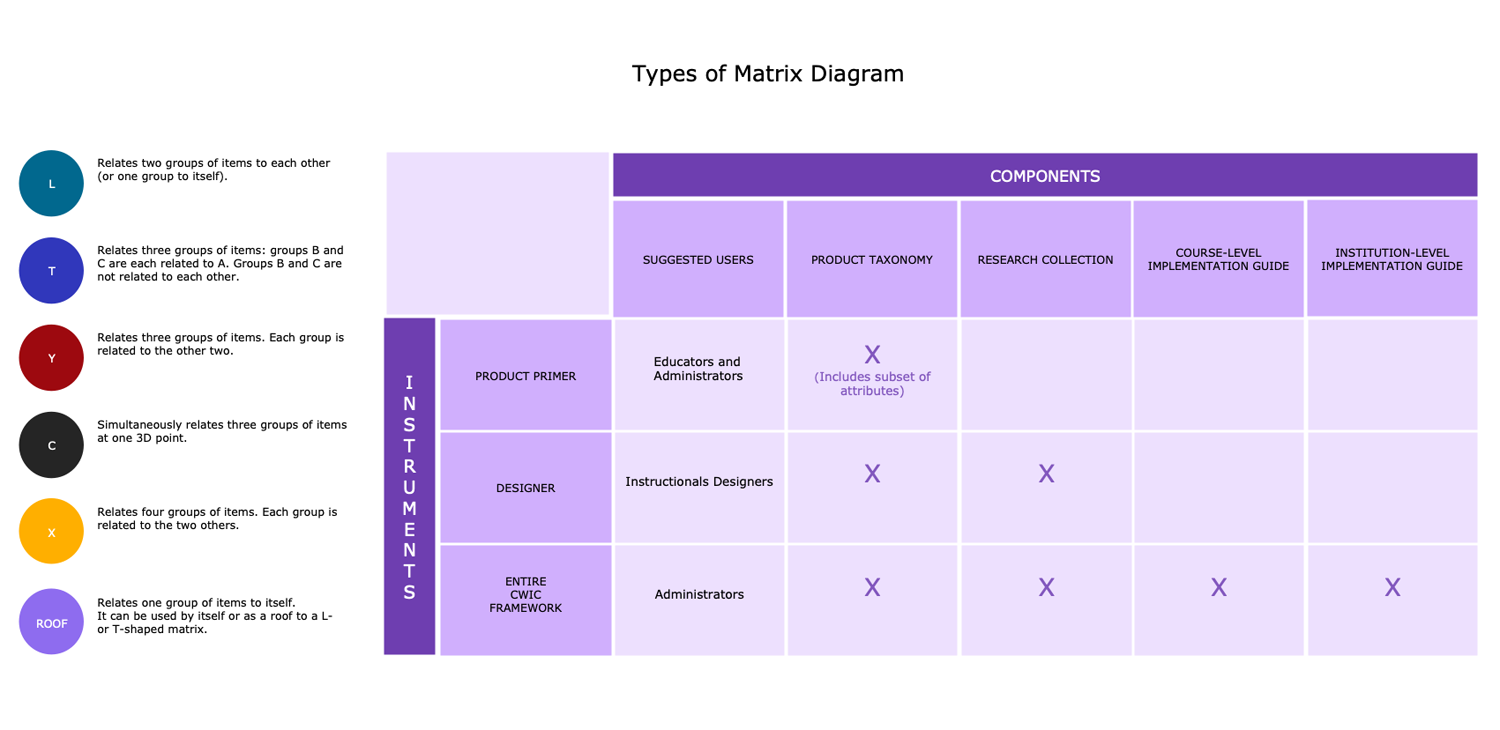
Example 7: Types of Matrix Diagram
This example shows one type of Matrix Diagrams. You can observe the relationships between tools and components. Various types of Matrix Diagrams are successfully used in business, statistics, management, marketing and other areas. These are Deployment Matrix Charts, Competitive Strategy Matrices, Ansoff Matrices, BCG Matrices, Comparative Charts and others. They help you analyze the results and achievements of your business, manage marketing resources, measure performance, analyze ROI, track processes, evaluate the effectiveness of management and marketing operations. These are important tools because successful management and business are based on measurement and analysis results, evaluation results, and investment-to-result ratios. Create efficiently and quickly your own Mind Map with Matrix Diagrams in ConceptDraw MINDMAP software.
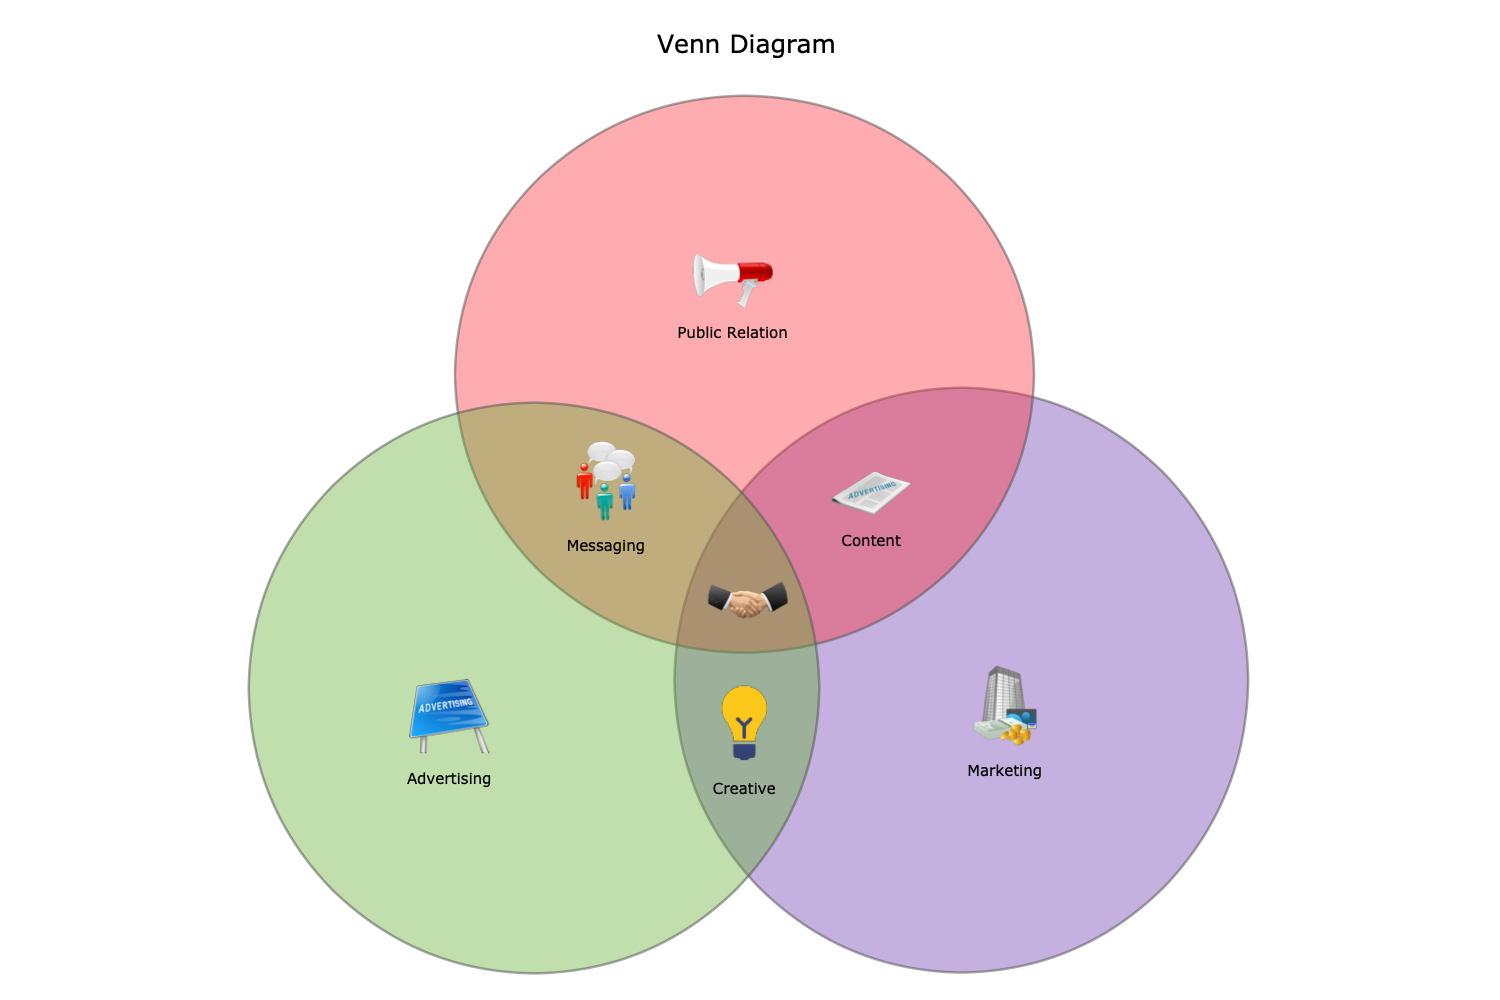
Example 8: Venn Diagram
This sample shows a Venn Diagram consisting of three intersecting circles. They display graphically the logical relations of intersection between the parts of the business and promotion sphere. Venn Diagrams are popular for the visual comparison of data and information, for efficient problem-solving in business, statistics, management, marketing, sociology, mathematics, computer science, probability theory, logic, and other fields. They are perfect for marketing campaigns, presentations, illustrations, websites, and posters. The circles are colored differently for additional clarity. Due to the objects' transparency, the mixing of colors is get in the intersections giving additional expressiveness to the diagram and accent at the intersections of parts or sets. The use of a predesigned Venn Diagram sample or template makes your drawing faster and simpler.
Inside
What I Need to Get Started
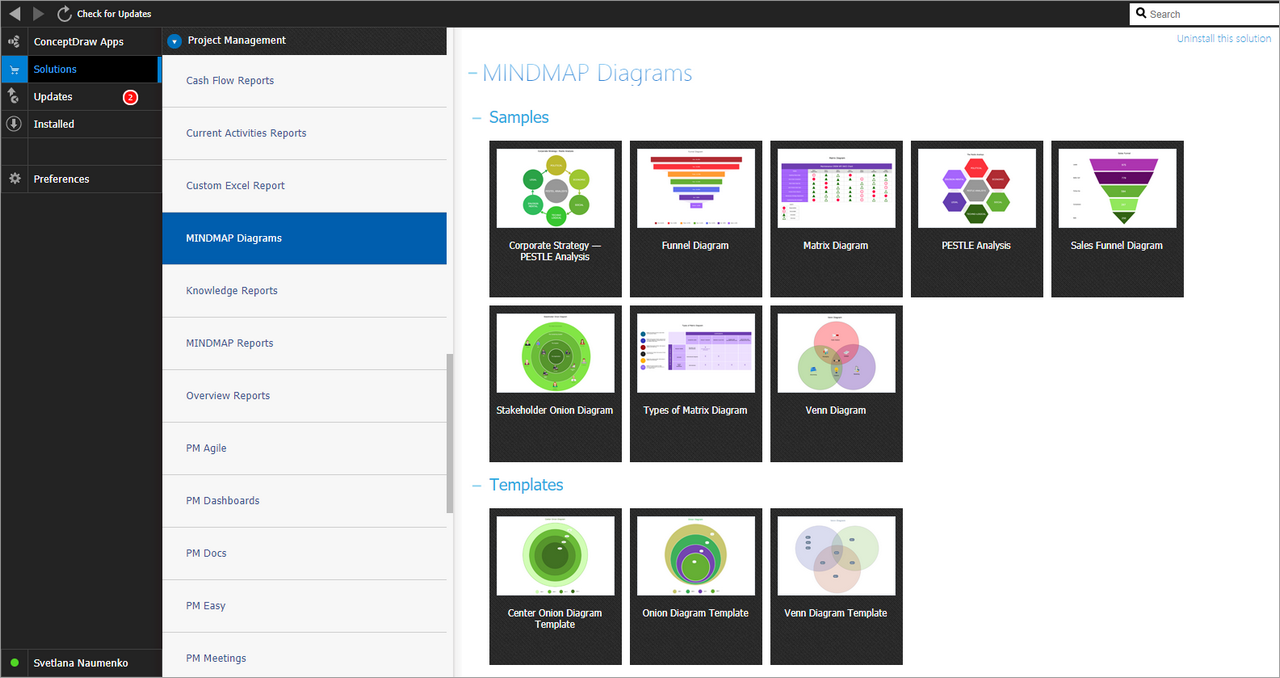
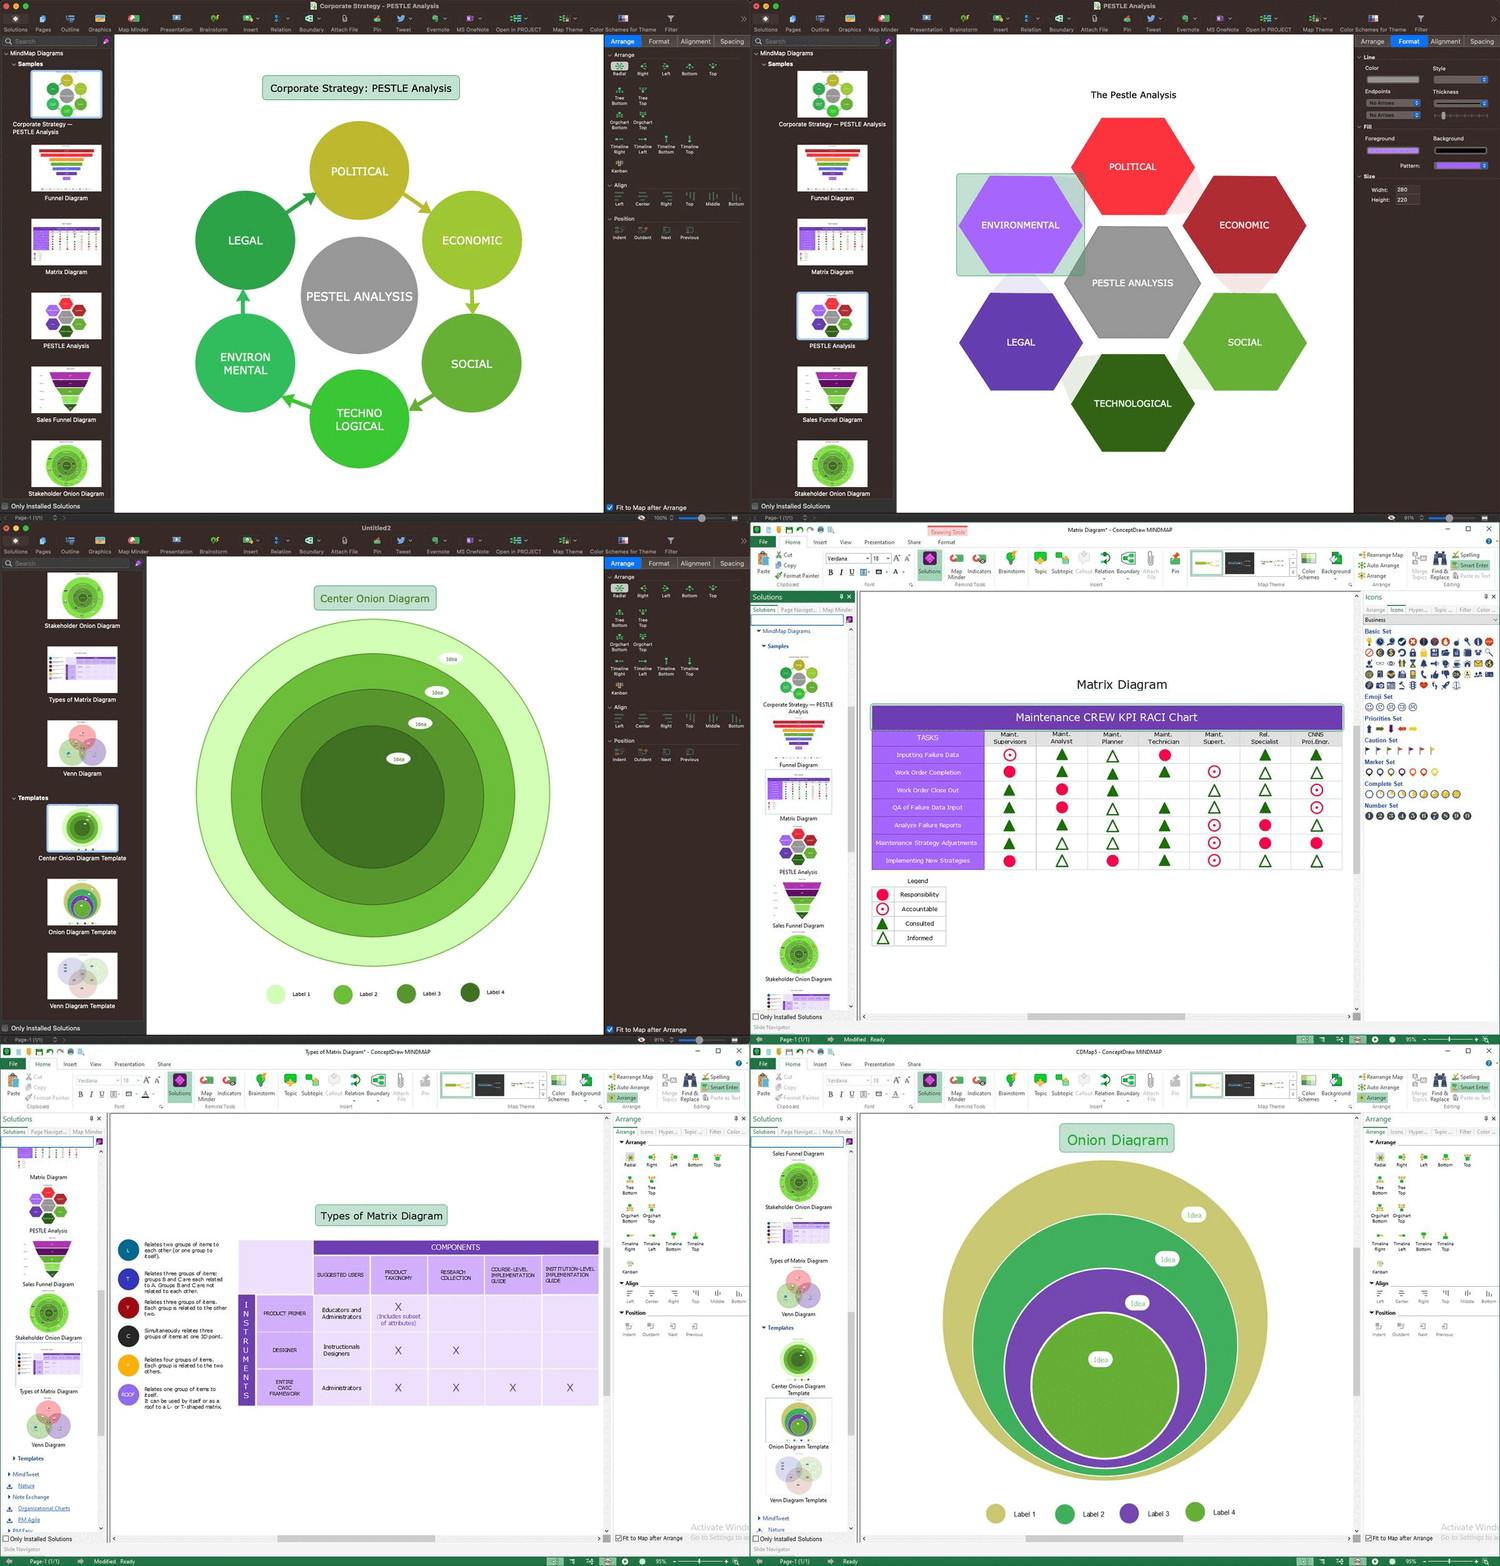
After ConceptDraw MINDMAP is installed, the MindMap Diagrams solution can be purchased either from the Project Management area of ConceptDraw STORE itself or from our online store. Thus, you will be able to use the MindMap Diagrams solution straight after.
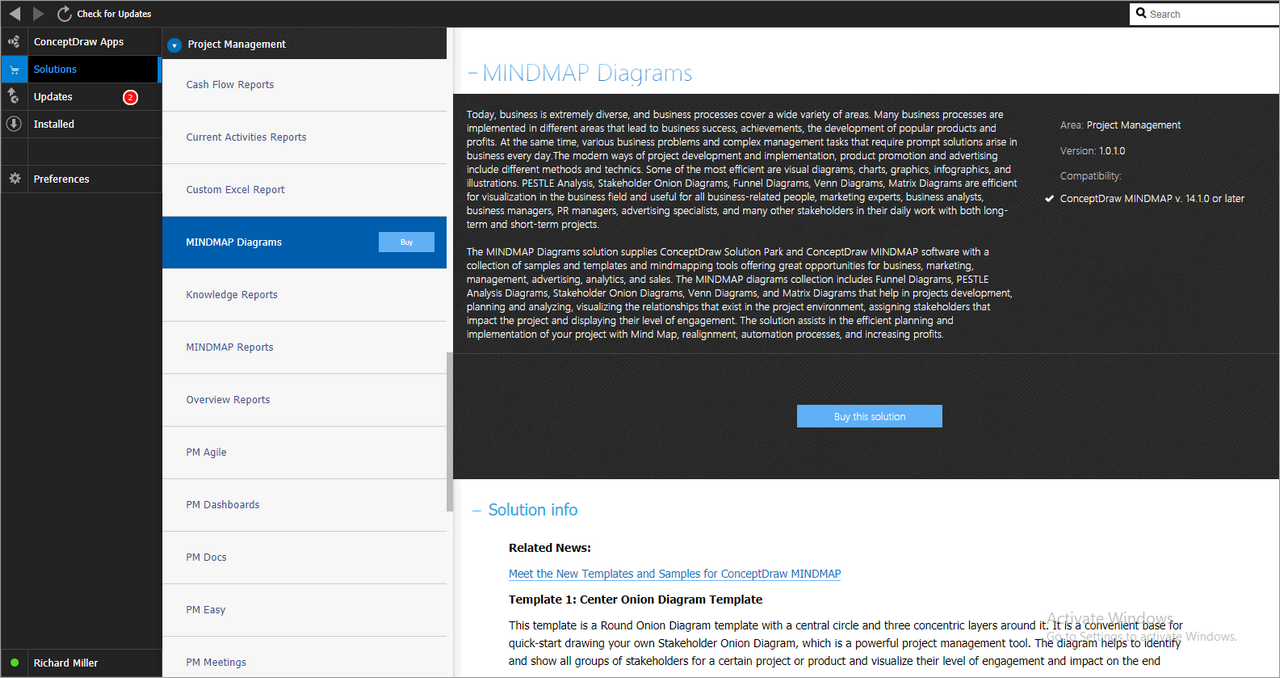
How to install
First of all, make sure that both ConceptDraw STORE and ConceptDraw MINDMAP applications are downloaded and installed on your computer. Next, install the MindMap Diagrams solution from the ConceptDraw STORE to use it in the ConceptDraw MINDMAP application.
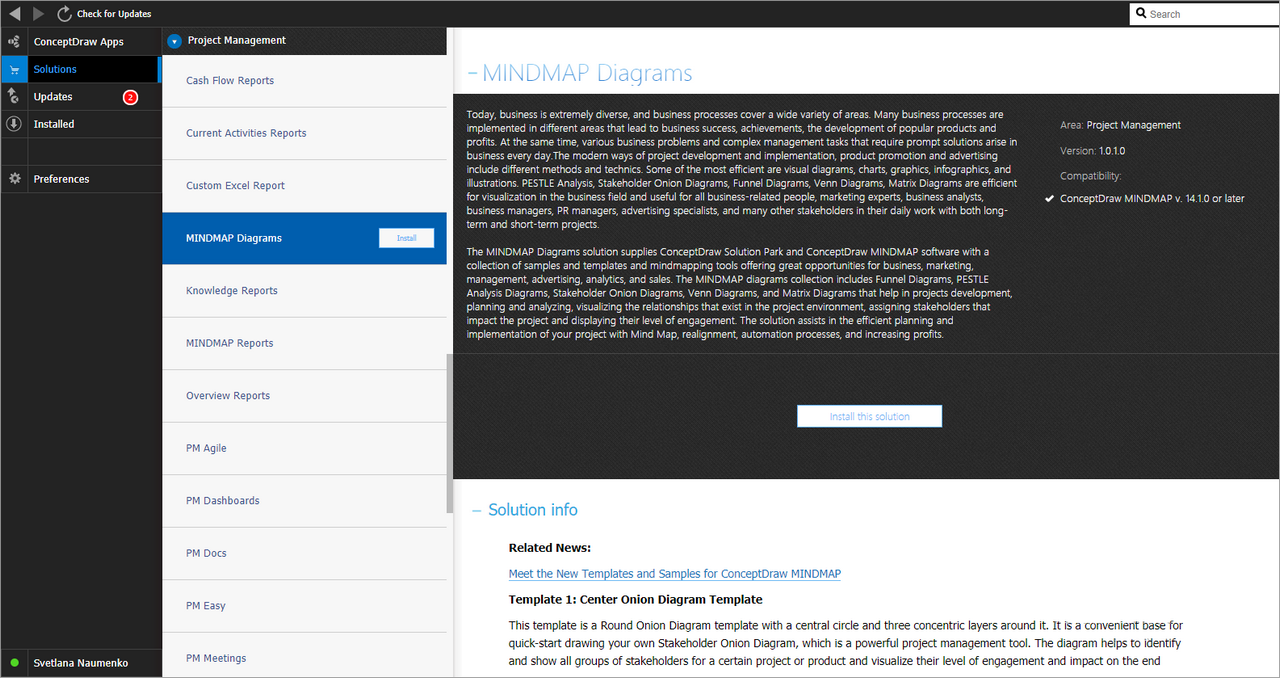
Start using
Start using the MindMap Diagrams solution to make the professionally looking illustrations by adding the design elements taken from the stencil libraries and editing the pre-made examples that can be found there.
