- Electric and Telecom Plans Free
- Fire and Emergency Plans Free
- Floor Plans Free
- Plant Layout Plans Free
- School and Training Plans Free
- Seating Plans Free
- Security and Access Plans Free
- Site Plans Free
- Sport Field Plans Free
- Business Process Diagrams Free
- Business Process Mapping Free
- Classic Business Process Modeling Free
- Cross-Functional Flowcharts Free
- Event-driven Process Chain Diagrams Free
- IDEF Business Process Diagrams Free
- Logistics Flow Charts Free
- Workflow Diagrams Free
- ConceptDraw Dashboard for Facebook Free
- Mind Map Exchange Free
- MindTweet Free
- Note Exchange Free
- Project Exchange Free
- Social Media Response Free
- Active Directory Diagrams Free
- AWS Architecture Diagrams Free
- Azure Architecture Free
- Cisco Network Diagrams Free
- Cisco Networking Free
- Cloud Computing Diagrams Free
- Computer Network Diagrams Free
- Google Cloud Platform Free
- Interactive Voice Response Diagrams Free
- Network Layout Floor Plans Free
- Network Security Diagrams Free
- Rack Diagrams Free
- Telecommunication Network Diagrams Free
- Vehicular Networking Free
- Wireless Networks Free
- Comparison Dashboard Free
- Composition Dashboard Free
- Correlation Dashboard Free
- Frequency Distribution Dashboard Free
- Meter Dashboard Free
- Spatial Dashboard Free
- Status Dashboard Free
- Time Series Dashboard Free
- Basic Circle-Spoke Diagrams Free
- Basic Circular Arrows Diagrams Free
- Basic Venn Diagrams Free
- Block Diagrams Free
- Concept Maps Free
- Family Tree Free
- Flowcharts Free
- Basic Area Charts Free
- Basic Bar Graphs Free
- Basic Divided Bar Diagrams Free
- Basic Histograms Free
- Basic Line Graphs Free
- Basic Picture Graphs Free
- Basic Pie Charts Free
- Basic Scatter Diagrams Free
- Aerospace and Transport Free
- Artwork Free
- Audio, Video, Media Free
- Business and Finance Free
- Computers and Communications Free
- Holiday Free
- Manufacturing and Maintenance Free
- Nature Free
- People Free
- Presentation Clipart Free
- Safety and Security Free
- Analog Electronics Free
- Audio and Video Connectors Free
- Basic Circuit Diagrams Free
- Chemical and Process Engineering Free
- Digital Electronics Free
- Electrical Engineering Free
- Electron Tube Circuits Free
- Electronic Block Diagrams Free
- Fault Tree Analysis Diagrams Free
- GHS Hazard Pictograms Free
- Home Automation and Wiring Free
- Mechanical Engineering Free
- One-line Diagrams Free
- Power Сircuits Free
- Specification and Description Language (SDL) Free
- Telecom and AV Circuits Free
- Transport Hazard Pictograms Free
- Data-driven Infographics Free
- Pictorial Infographics Free
- Spatial Infographics Free
- Typography Infographics Free
- Calendars Free
- Decision Making Free
- Enterprise Architecture Diagrams Free
- Fishbone Diagrams Free
- Organizational Charts Free
- Plan-Do-Check-Act (PDCA) Free
- Seven Management and Planning Tools Free
- SWOT and TOWS Matrix Diagrams Free
- Timeline Diagrams Free
- Australia Map Free
- Continent Maps Free
- Directional Maps Free
- Germany Map Free
- Metro Map Free
- UK Map Free
- USA Maps Free
- Customer Journey Mapping Free
- Marketing Diagrams Free
- Matrices Free
- Pyramid Diagrams Free
- Sales Dashboard Free
- Sales Flowcharts Free
- Target and Circular Diagrams Free
- Cash Flow Reports Free
- Current Activities Reports Free
- Custom Excel Report Free
- Knowledge Reports Free
- MINDMAP Reports Free
- Overview Reports Free
- PM Agile Free
- PM Dashboards Free
- PM Docs Free
- PM Easy Free
- PM Meetings Free
- PM Planning Free
- PM Presentations Free
- PM Response Free
- Resource Usage Reports Free
- Visual Reports Free
- Project Diagrams $49
- House of Quality Free
- Quality Mind Map Free
- Total Quality Management TQM Diagrams Free
- Value Stream Mapping Free
- Astronomy Free
- Biology Free
- Chemistry Free
- Language Learning Free
- Mathematics Free
- Physics Free
- Piano Sheet Music Free
- Android User Interface Free
- Class Hierarchy Tree Free
- Data Flow Diagrams (DFD) Free
- DOM Tree Free
- Entity-Relationship Diagram (ERD) Free
- EXPRESS-G data Modeling Diagram Free
- IDEF0 Diagrams Free
- iPhone User Interface Free
- Jackson Structured Programming (JSP) Diagrams Free
- macOS User Interface Free
- Object-Role Modeling (ORM) Diagrams Free
- Rapid UML Free
- SYSML Free
- Website Wireframe Free
- Windows 10 User Interface Free
Project Diagrams
The terms "project" and "project management" long and firmly entered into our lives and activities in different fields. A project is a temporal venture intended to create unique products, services, or to obtain any other results. It supposes the set of tasks and actions having clear final goals, relationships of tasks and resources, as well as defined start and end dates. We face the projects literally everywhere and typically they are not only related to our work but also with everyday life and personal tasks.
However, for the successful project implementation, a clear and detailed plan and the list of works to be performed are primarily needed, as well as the list of human and material resources required for this. Any project plan can be made in the simplest and usual form — in a form of list, table or Gantt chart, but there are many cases when this is not enough and for better clarifying the scope of work it is preferable the visualization of information, construction a visual representation in a form of Project diagram, chart or infographics. Due to the high effectiveness of these tools, they became incredibly popular in the field of project management.
When planning and managing projects, the diagrams of different kinds are used. Sometimes, even several diverse types of diagrams need to be constructed for a single project, allowing one to present it from different aspects, to highlight the key stages and to mark priority tasks. In any case, the ultimate purpose of any Project Diagram is the project's success, its qualitative and timely implementation, the realization of the main project’s idea and achievement of the set goal.
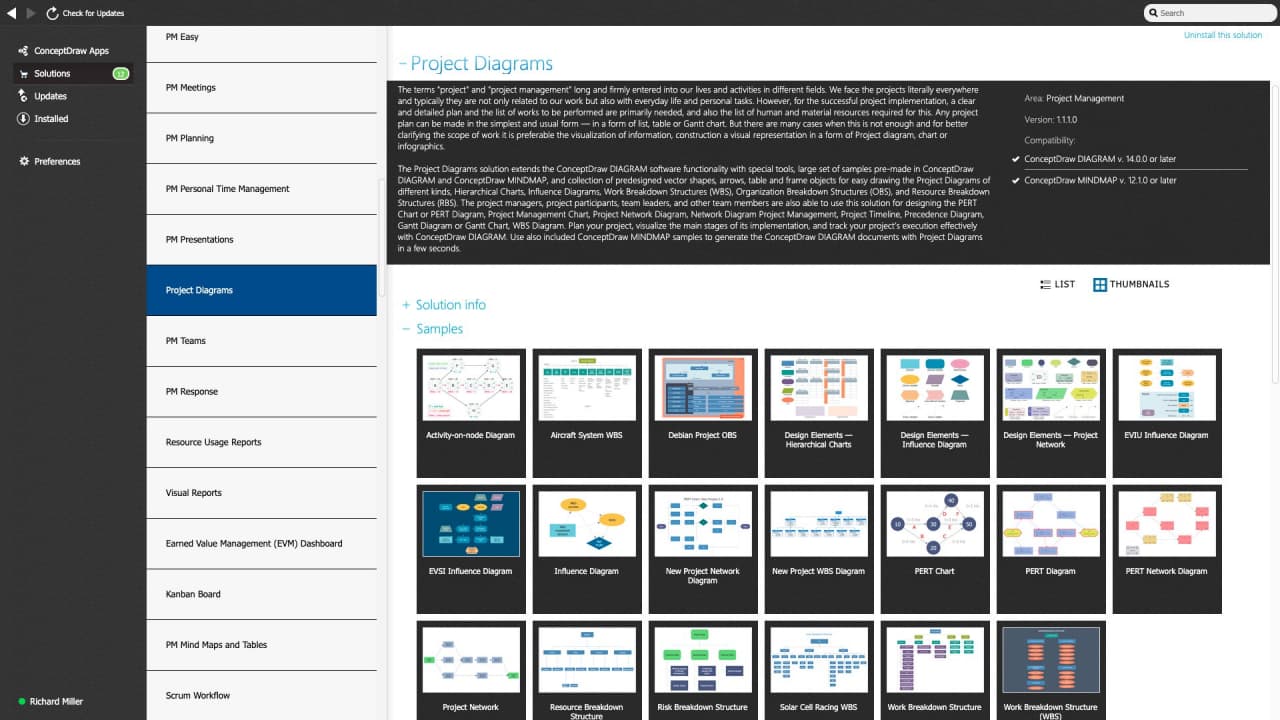
The Project Diagrams solution extends the ConceptDraw DIAGRAM software functionality with special tools, large set of samples pre-made in ConceptDraw DIAGRAM and ConceptDraw MINDMAP, and collection of predesigned vector shapes, arrows, table and frame objects for easy drawing the Project Diagrams of different kinds, Hierarchical Charts, Influence Diagrams, Work Breakdown Structures (WBS), Organization Breakdown Structures (OBS), and Resource Breakdown Structures (RBS). The project managers, project participants, team leaders, and other team members are also able to use this solution for designing the PERT Chart or PERT Diagram, Project Management Chart, Project Network Diagram, Network Diagram Project Management, Project Timeline, Precedence Diagram, Gantt Diagram or Gantt Chart, WBS Diagram. Plan your project, visualize the main stages of its implementation, and track your project’s execution effectively with ConceptDraw DIAGRAM. Use also included ConceptDraw MINDMAP samples to generate the ConceptDraw DIAGRAM documents with Project Diagrams in a few seconds.
-
Buy this solution $49 -
Solution Requirements - This solution requires the following products to be installed:
ConceptDraw DIAGRAM v18 ConceptDraw MINDMAP v16 - This solution requires the following products to be installed:
-
Compatibility - Sonoma (14), Sonoma (15)
MS Windows 10, 11 - Sonoma (14), Sonoma (15)
-
Support for this Solution -
Helpdesk
There are 2 libraries containing 32 vector graphics icons and 9 examples in the Project Diagrams solution.
Design Elements — Hierarchical-Charts

Design Elements — Influence-Diagram

Related News:
Examples
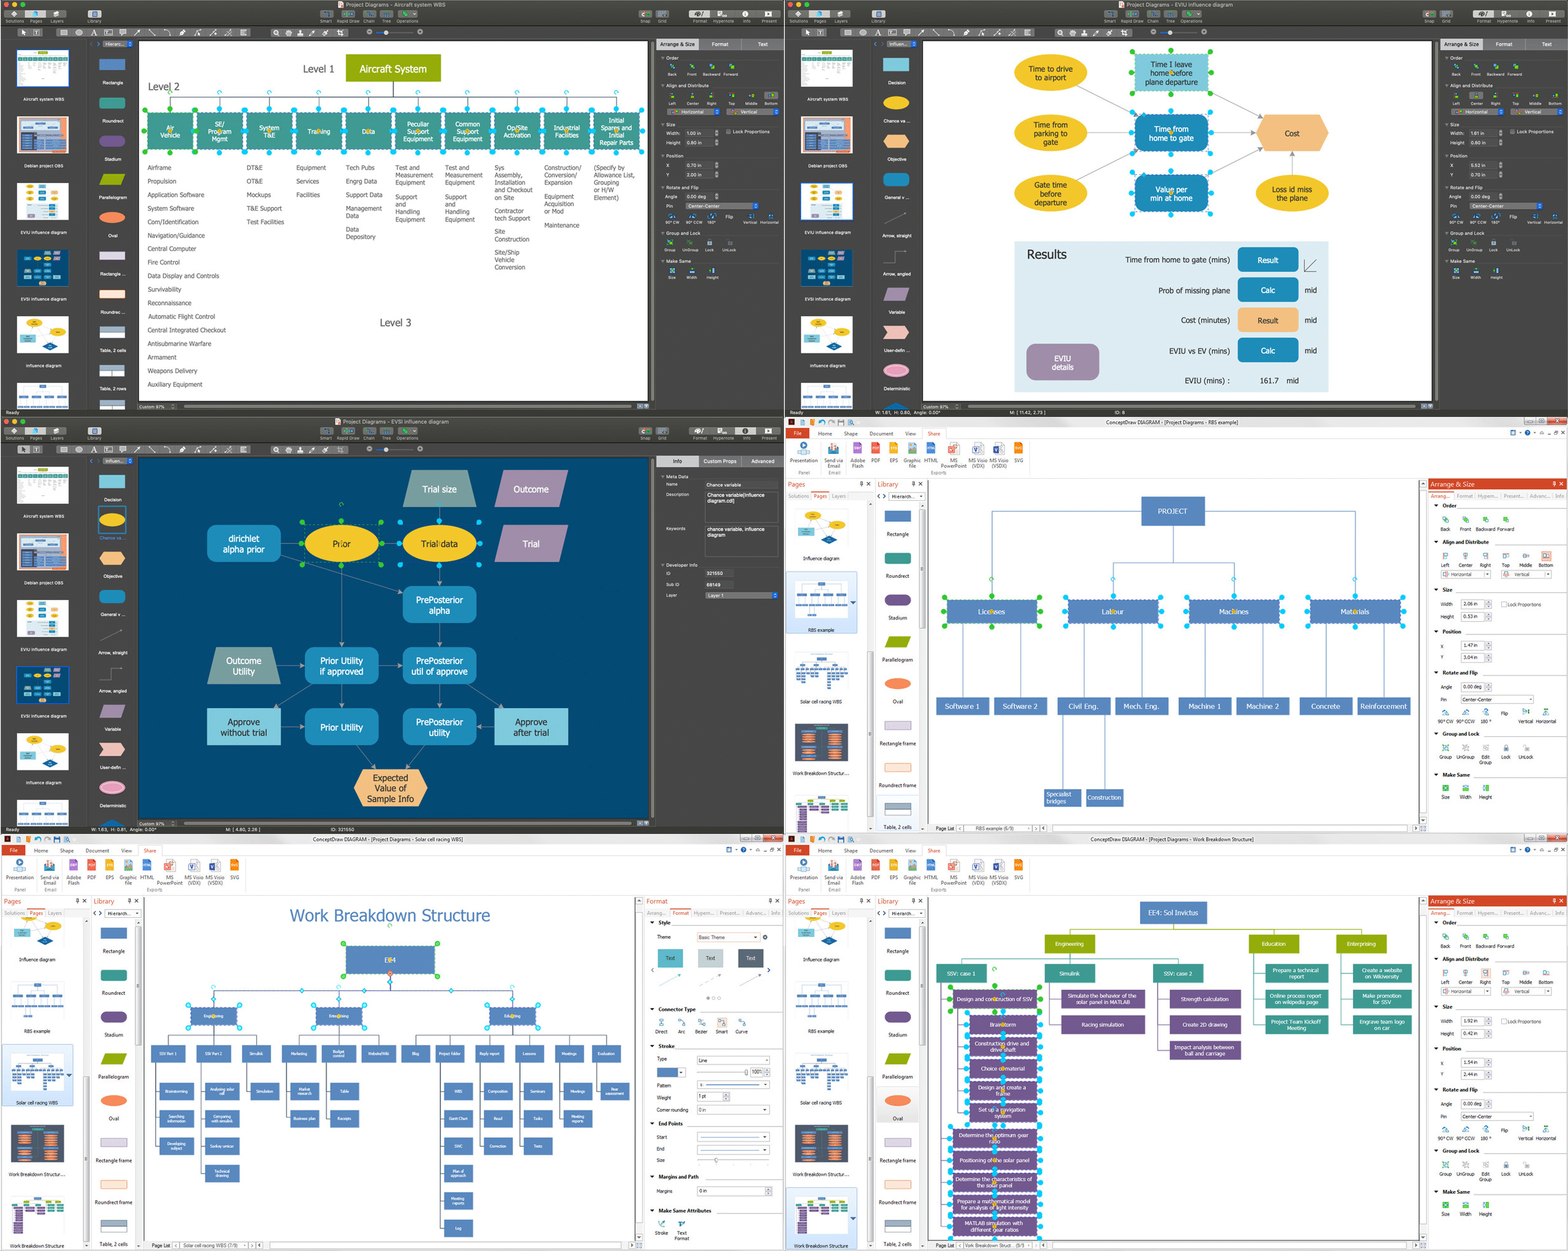
There are a few samples that you see on this page which were created in the ConceptDraw DIAGRAM application by using the Project Diagrams solution. Some of the solution's capabilities as well as the professional results which you can achieve are all demonstrated here on this page.
All source documents are vector graphic documents which are always available for modifying, reviewing and/or converting to many different formats, such as MS PowerPoint, PDF file, MS Visio, and many other graphic ones from the ConceptDraw Solution Park or ConceptDraw STORE. The Project Diagrams solution is available to all ConceptDraw DIAGRAM users to get installed and used while working in the ConceptDraw DIAGRAM diagramming and drawing software.
Example 1: Aircraft System WBS
This example was created in ConceptDraw DIAGRAM using the combination of libraries from the Project Diagrams Solution. An experienced user spent 10 minutes creating this sample.
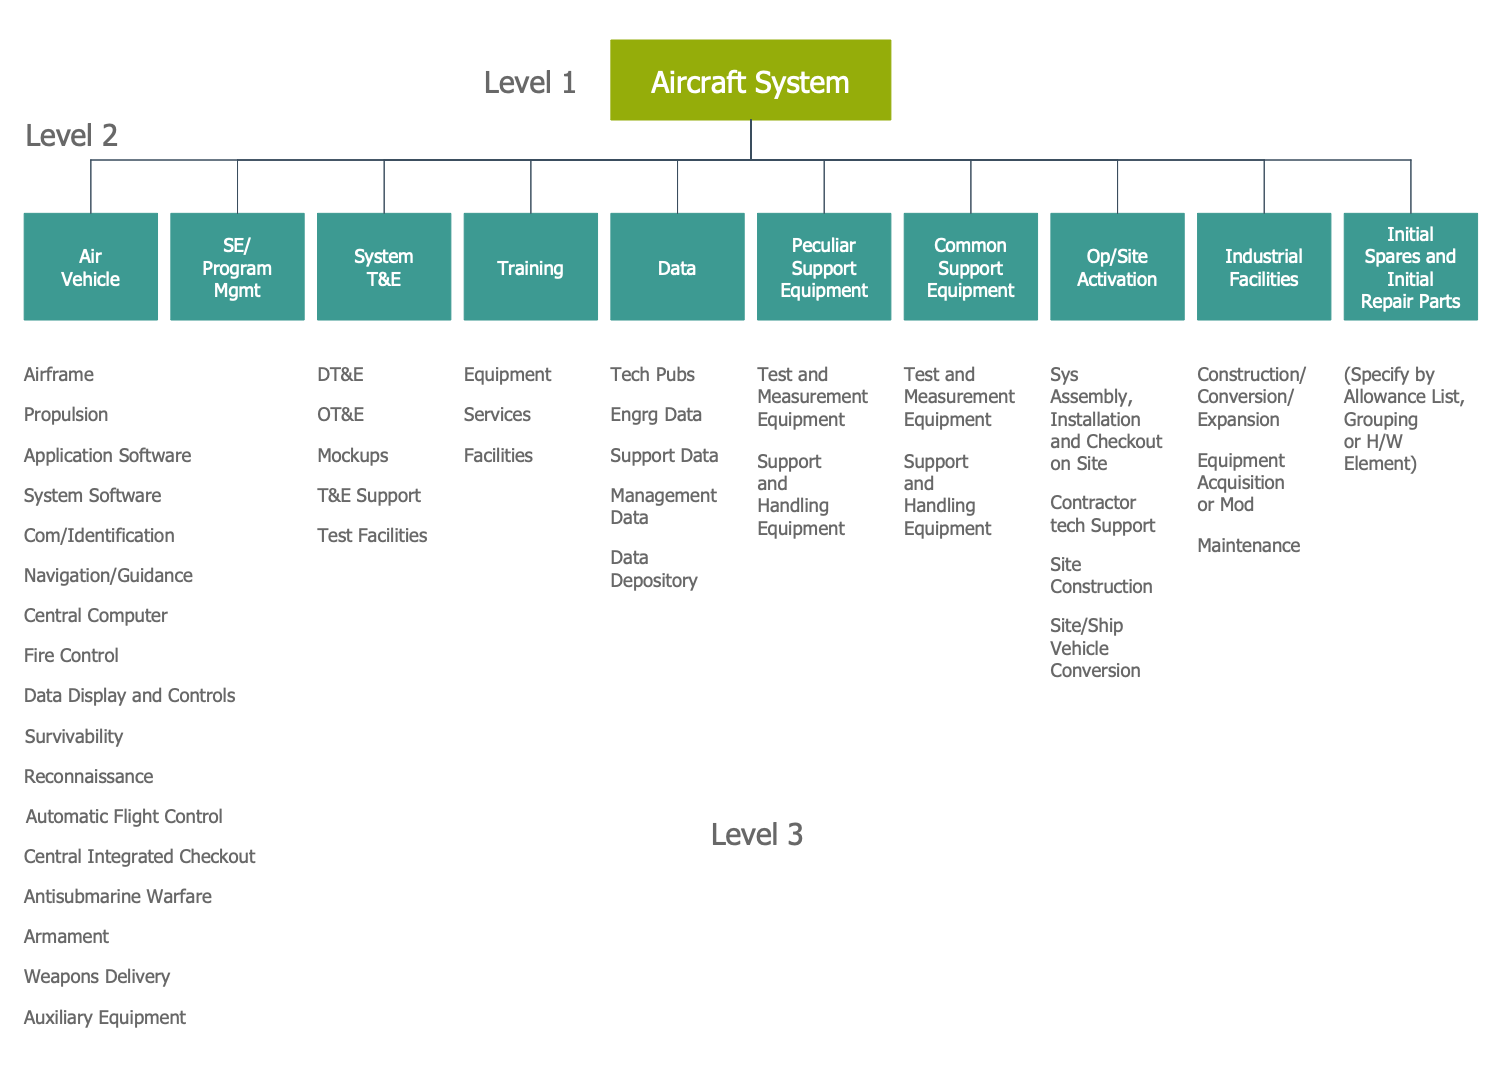
This Project Diagram sample is an example from MIL-HDBK-881 that is based on the "Work Breakdown Structure of Aircraft System.jpg" file published on Wikimedia Commons. It is a WBS diagram that illustrates the hierarchical structure of a typical aircraft system, its division into smaller parts and depicts the first three levels of this structure. The "Work Breakdown Structures for Defense Materiel Items" MIL-HDBK-881 is a military standard accepted by the United States Department of Defense (DoD) in 1968. This standard prescribes the use of work breakdown structures (WBS) across the DoD. Previously in 1962, the WBS approach was approved by the Secretary of Defense for adoption by all services within the Program Evaluation and Review Technique (PERT chart). Along with the aircraft systems, the MIL-STD-881 standard includes a lot of other Defense Materiel Item categories, such as electronic systems, generic systems, space systems, strategic missile systems, sea systems, information systems, defense business systems, unmanned maritime systems, etc.
Example 2: Debian Project OBS
This example was created in ConceptDraw DIAGRAM using the combination of libraries from the Project Diagrams Solution. An experienced user spent 15 minutes creating this sample.
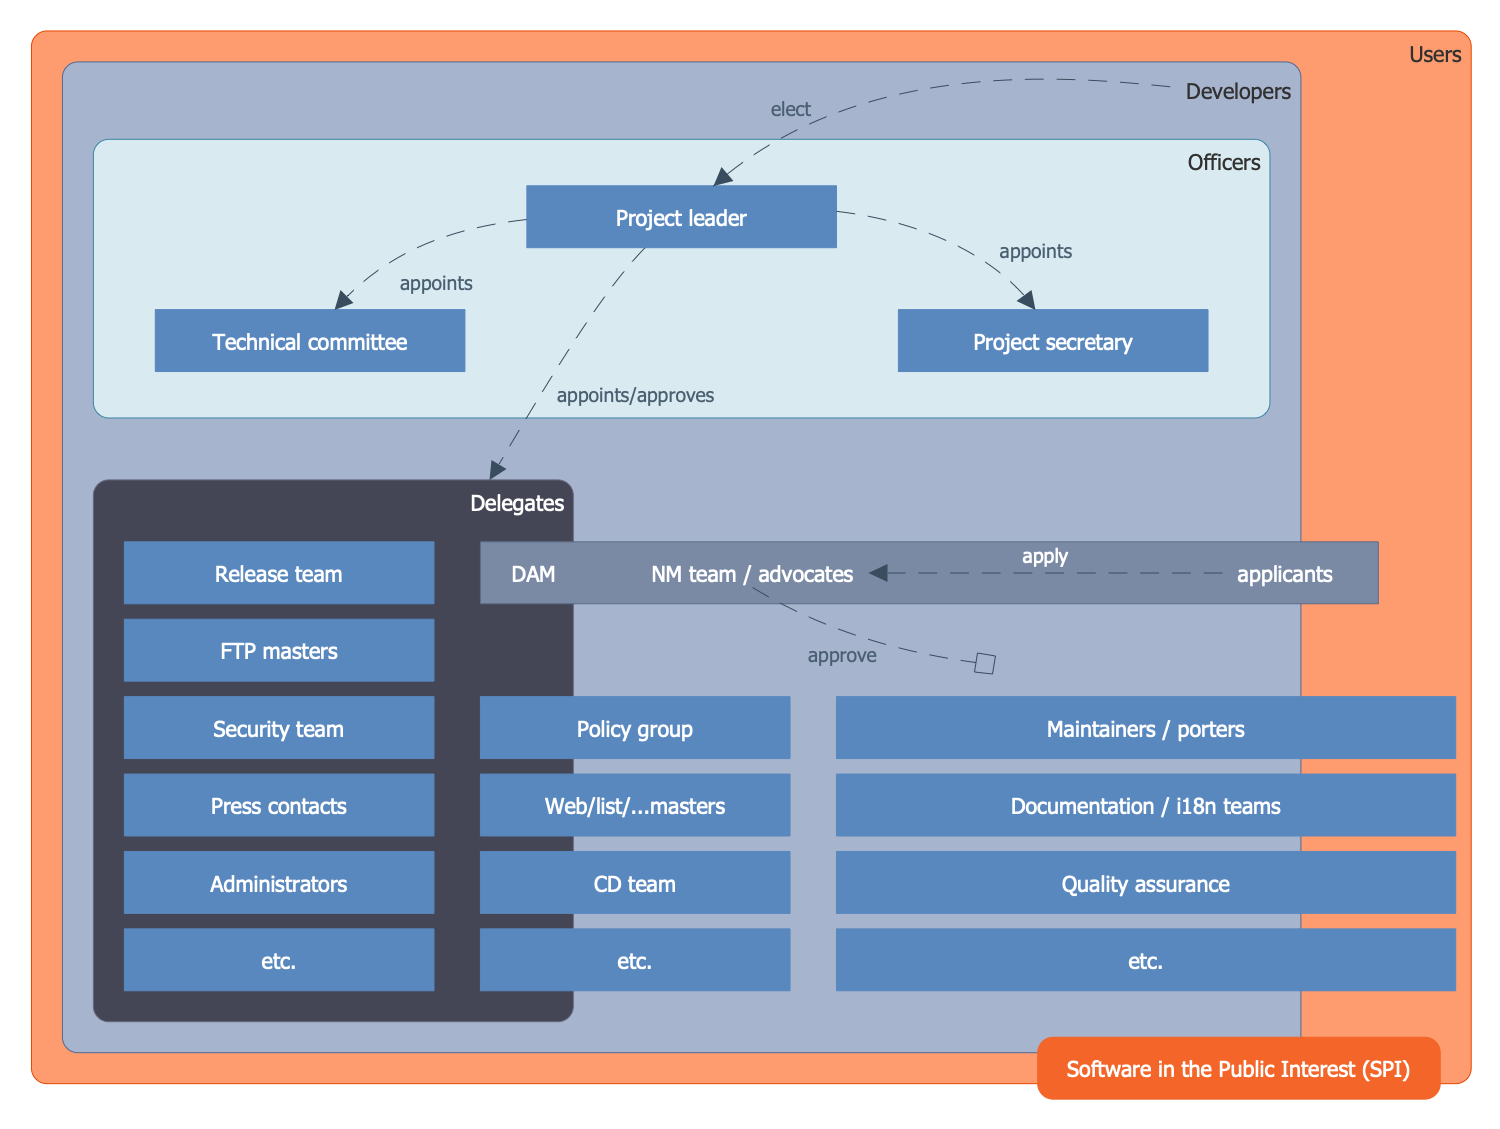
This sample demonstrates the Organization Breakdown Structure for the Debian project that is an operating system consisting of free and open-source software created by Ian Murdock, in1993. The project is based on three documents: Debian Social Contract, Debian Free Software Guidelines, and Debian Constitution. The first document defines a set of basic principles that developers and a project must adhere to. The second one proposes criteria for free software and for those that can be downloaded to the distribution. Finally, the Debian Constitution describes the organizational structure for decision-making within the project, explaining the powers and responsibilities of the organization's management team. This structure is shown in a current diagram, you can see that the management of the organization consists of three main persons and units — project leader, project secretary, and technical committee. A Debian project leader leads this organization, sets its direction, and is in front of the public. The first leader was Ian Murdock (August 1993 — March 1996), now from April 2010 it is Stefano Zacchiroli.
Example 3: EVIU Influence Diagram
This example was created in ConceptDraw DIAGRAM using the combination of libraries from the Project Diagrams Solution. An experienced user spent 10 minutes creating this sample.
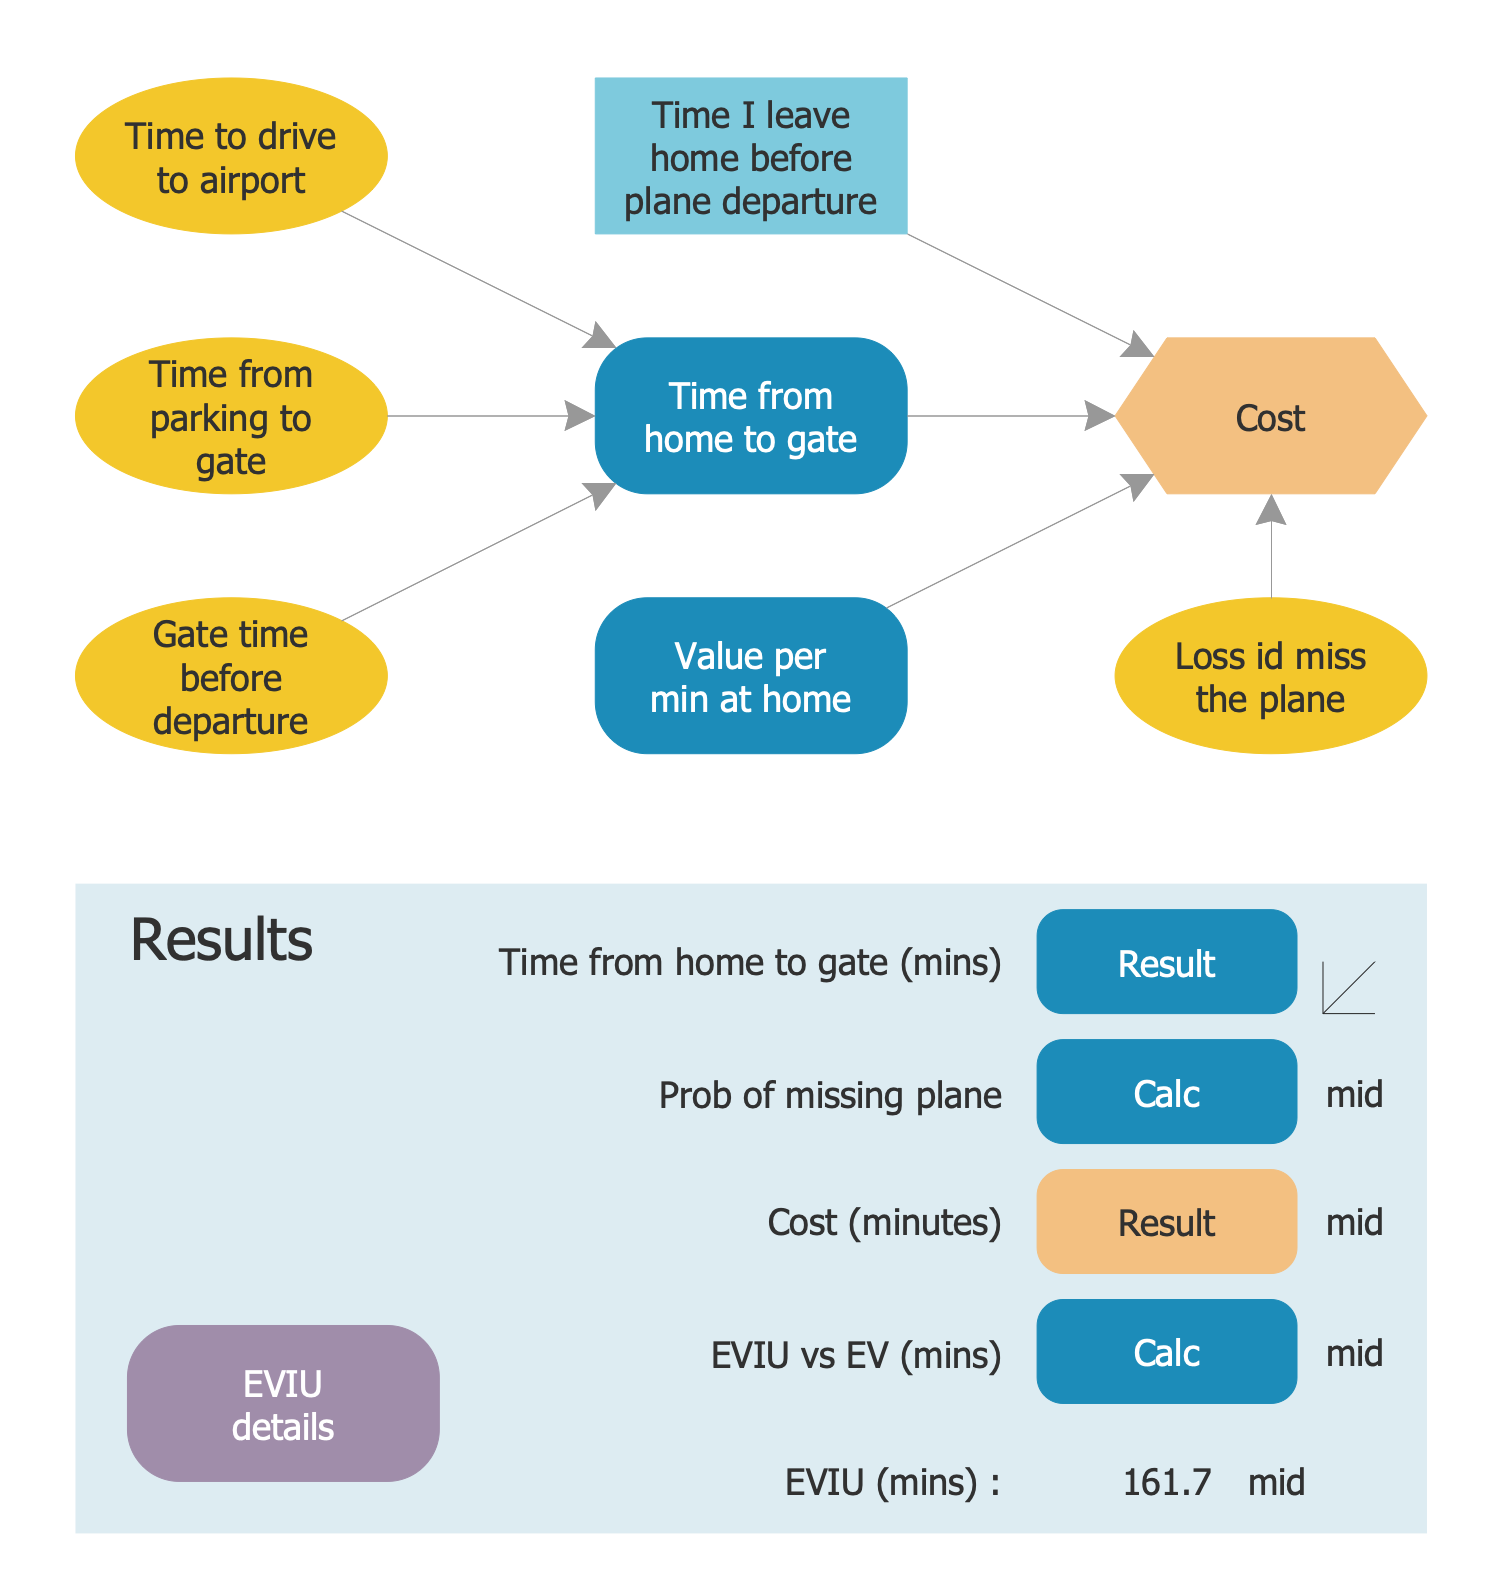
This sample represents the Influence Diagram depicting the process of deciding how long will take the way from home to the airport and how early a person needs to leave home to catch his flight. The diagram is made using the EVIU model. The resulting time (cost) includes the time to drive from home to the airport parking, the time to get from the parking to the gate, the time at the gate before departure, and the loss in a case of the flight miss. All these variables are depicted in the diagram in yellow ovals. The decision about the time you will leave home before the plane departure is placed in a blue rectangle. The cost represented by an orange hexagon is calculated as the number of minutes needed for in-time boarding the plane, without lose the time for waiting for departure and without late arrival to the airport. The EVIU coefficient is calculated in minutes.
Example 4: EVSI Influence Diagram
This example was created in ConceptDraw DIAGRAM using the combination of libraries from the Project Diagrams Solution. An experienced user spent 10 minutes creating this sample.
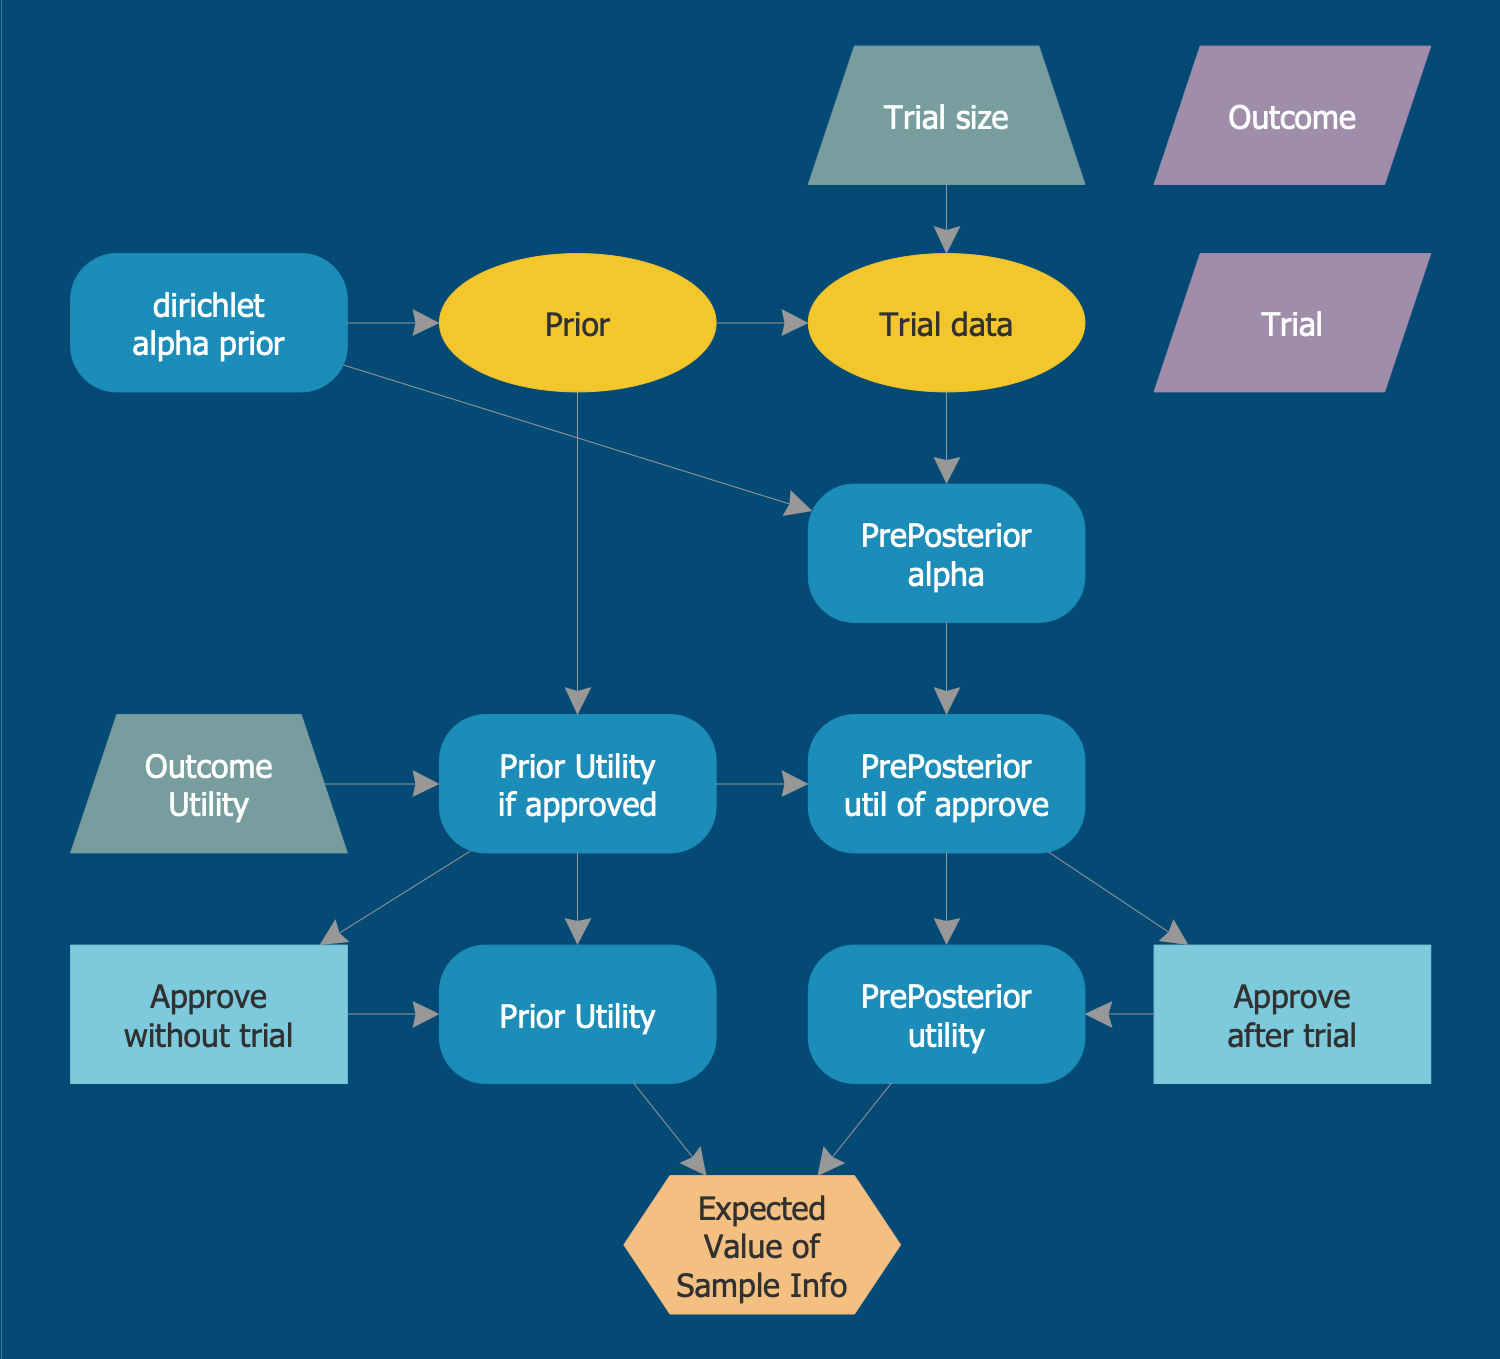
This Project Diagram sample is an EVSI (Expected Value of Sampling Information) Influence Diagram. It is dedicated to the adoption of the final decision about approvement or rejection of the new treatment. The EVSI model answers this question. It is ascertained the value of conducting a further trial study. In the case of considering trial data, there are modeled as Monte Carlo multinomial distribution. The resulting trial data are then combined with Dirichlet prior values and Dirichlet prior alpha values to get the resulting Dirichlet posterior distribution for each simulated trial. It is considered whether the mean utility is positive or not, and on the base of this is taken the decision about approvement or rejection. This diagram made by using the predesigned objects from the ConceptDraw's Project Diagrams solution libraries is strict and colorful, as well as clear and illustrative, so you can conveniently observe and track all steps.
Example 5: Influence Diagram
This example was created in ConceptDraw DIAGRAM using the combination of libraries from the Project Diagrams Solution. An experienced user spent 5 minutes creating this sample.
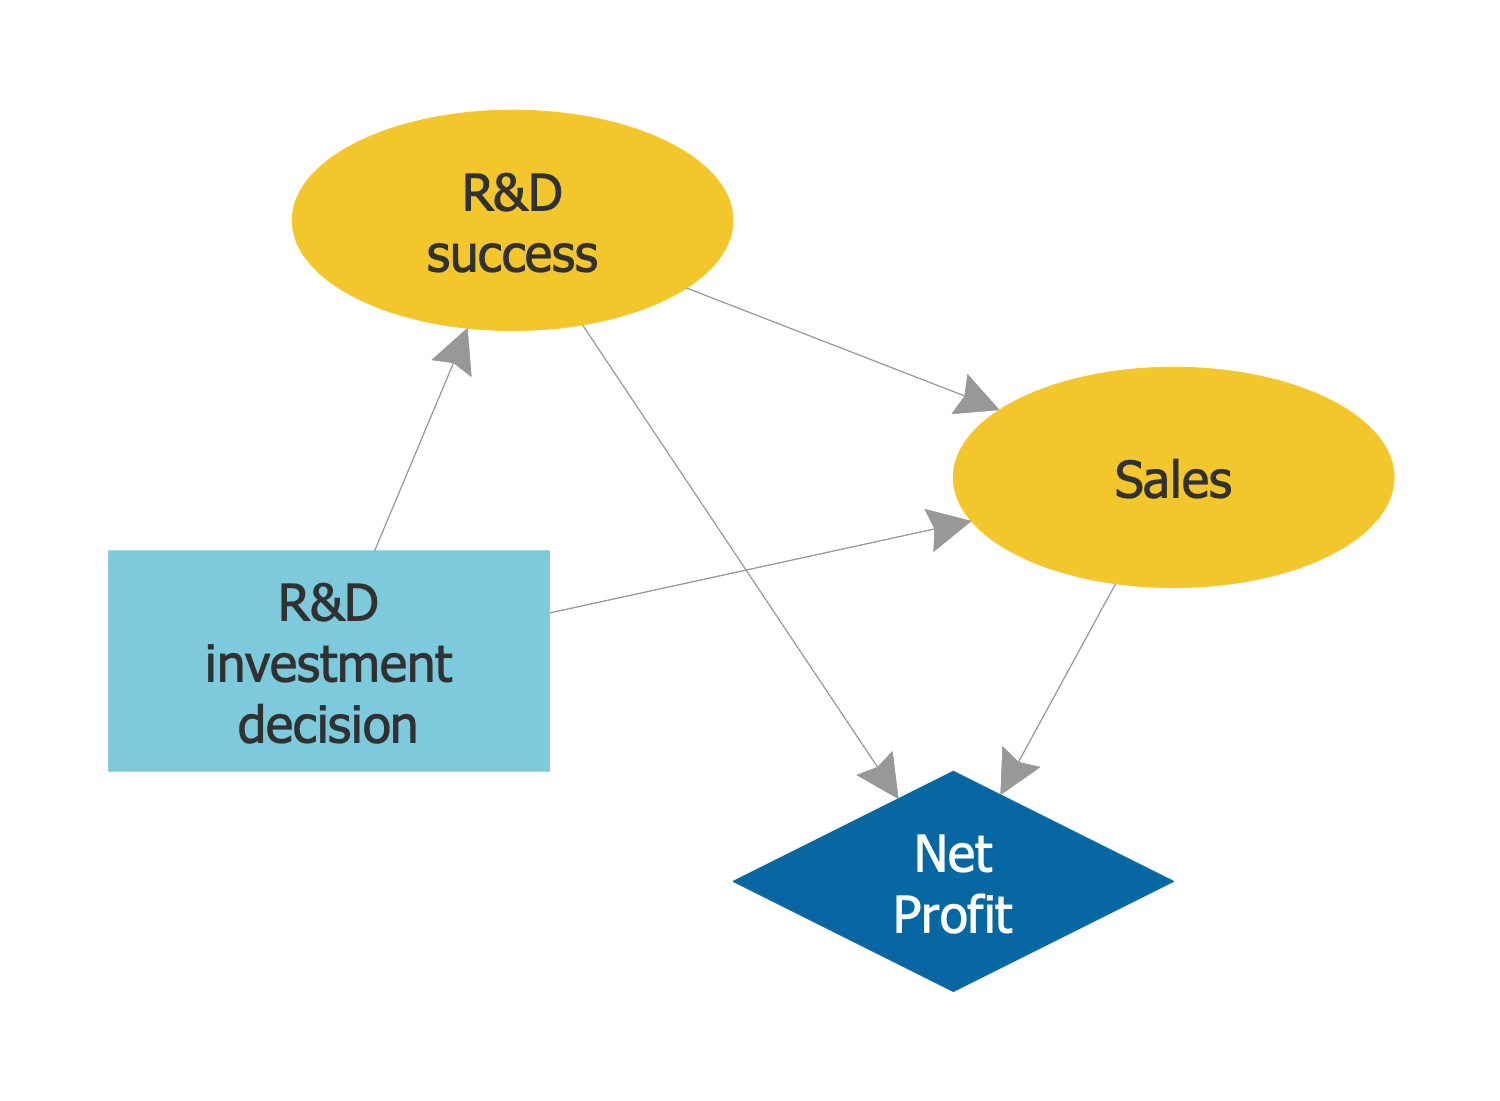
This Project diagram sample is a factory Influence diagram. Decision trees are very popular, but usually, contain a lot of information and data. By means of the Influence diagram, all this information can be represented in a compact view, at this focusing the attention on the issues and relationships between events. The different shapes were used on this diagram, the light blue rectangle represents the R&D investment decision, two yellow ovals depict actions — sales and R&D success, and finally, the blue diamond represents results — net profit. The Influence diagram always helps to represent the decision situation in a compact graphical and mathematical view, it uses the intuitive semantic, common and easy to understand. This sample demonstrates the power and convenience of the Influence diagrams in decision analysis, in the representation of the important concepts and definition of the value of information. Use the ConceptDraw DIAGRAM software and Project Diagrams solution to construct Decision tree, Influence diagram, Network diagram project management, PERT diagram, Precedence diagram, or Gantt diagram easy and quickly.
Example 6: Resource Breakdown Structure
This example was created in ConceptDraw DIAGRAM using the combination of libraries from the Project Diagrams Solution. An experienced user spent 5 minutes creating this sample.
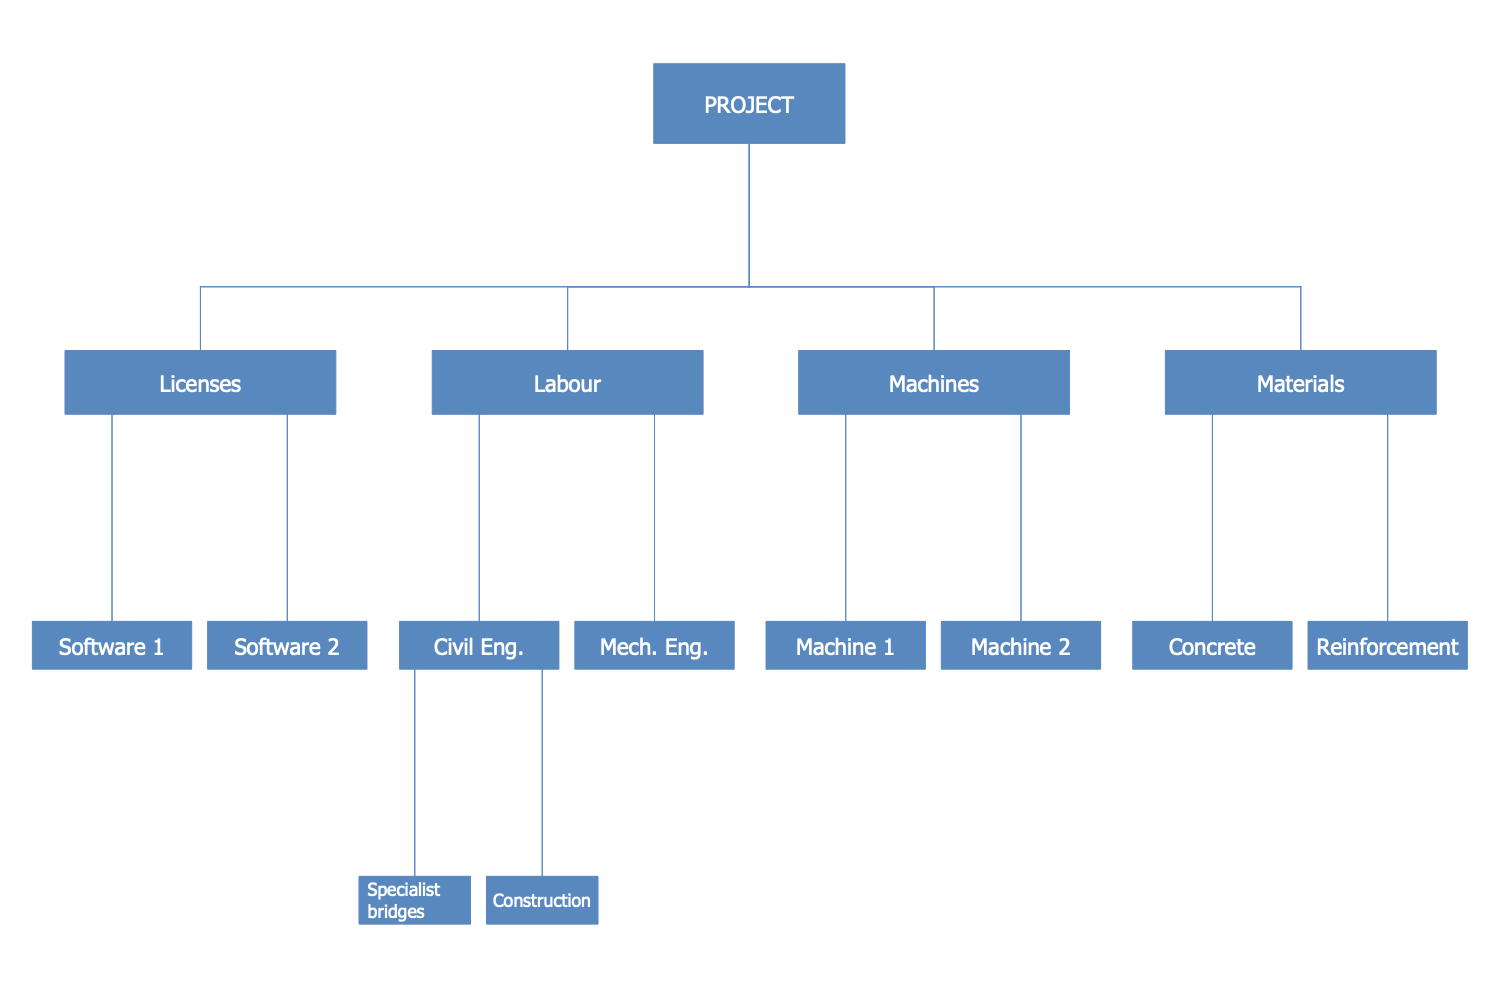
This Project Diagram sample demonstrates the Resource Breakdown Structure (RBS) that is a project management tool. The main goal of RBS is planning, managing and controlling project work. You can observe the classic hierarchical model, which describes the resources required to complete a specific project, i.e. everything in a project that has a cost. The licenses, labour, machines, and materials are resources in a given example. The overview of needed resources lets evaluation the estimated cost of the project, helps to find information about the resources and to replace some of them if the reduction of project expenses is required. The Resource breakdown structure is simple, strict and clear that helps in reducing the risk of incomprehension and misunderstandings, the risk of losses and extra costs, so a similar structure is able to save money and time as well. Succeed in project management with ConceptDraw's Project Diagrams solution, design easily the breakdown structures — WBS, RBS, OBS, Project management chart, Project network diagram, Project timeline, etc.
Example 7: Solar Cell Racing WBS
This example was created in ConceptDraw DIAGRAM using the combination of libraries from the Project Diagrams Solution. An experienced user spent 10 minutes creating this sample.
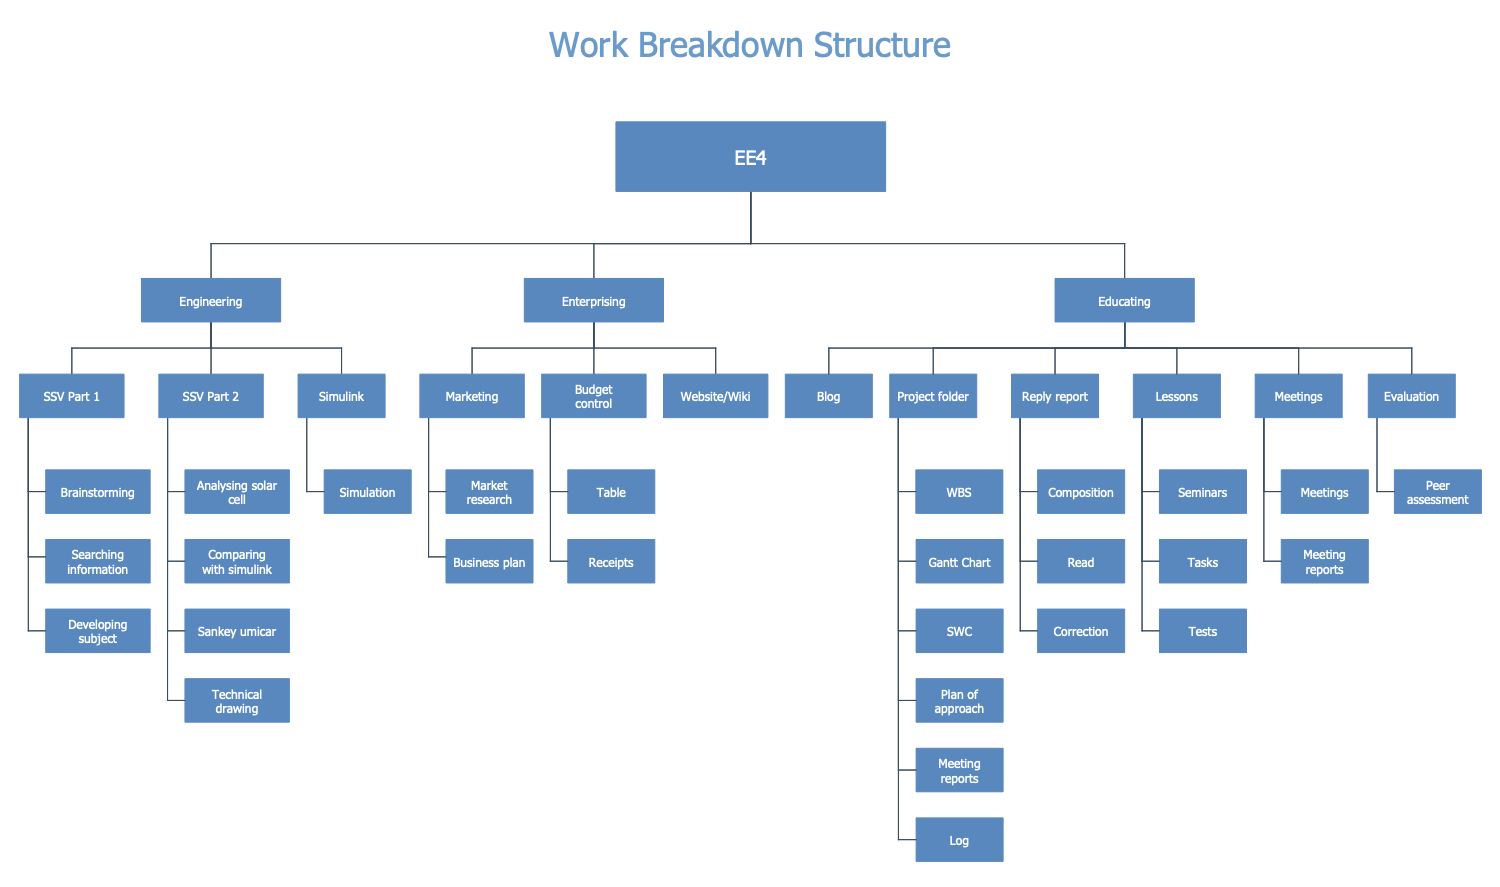
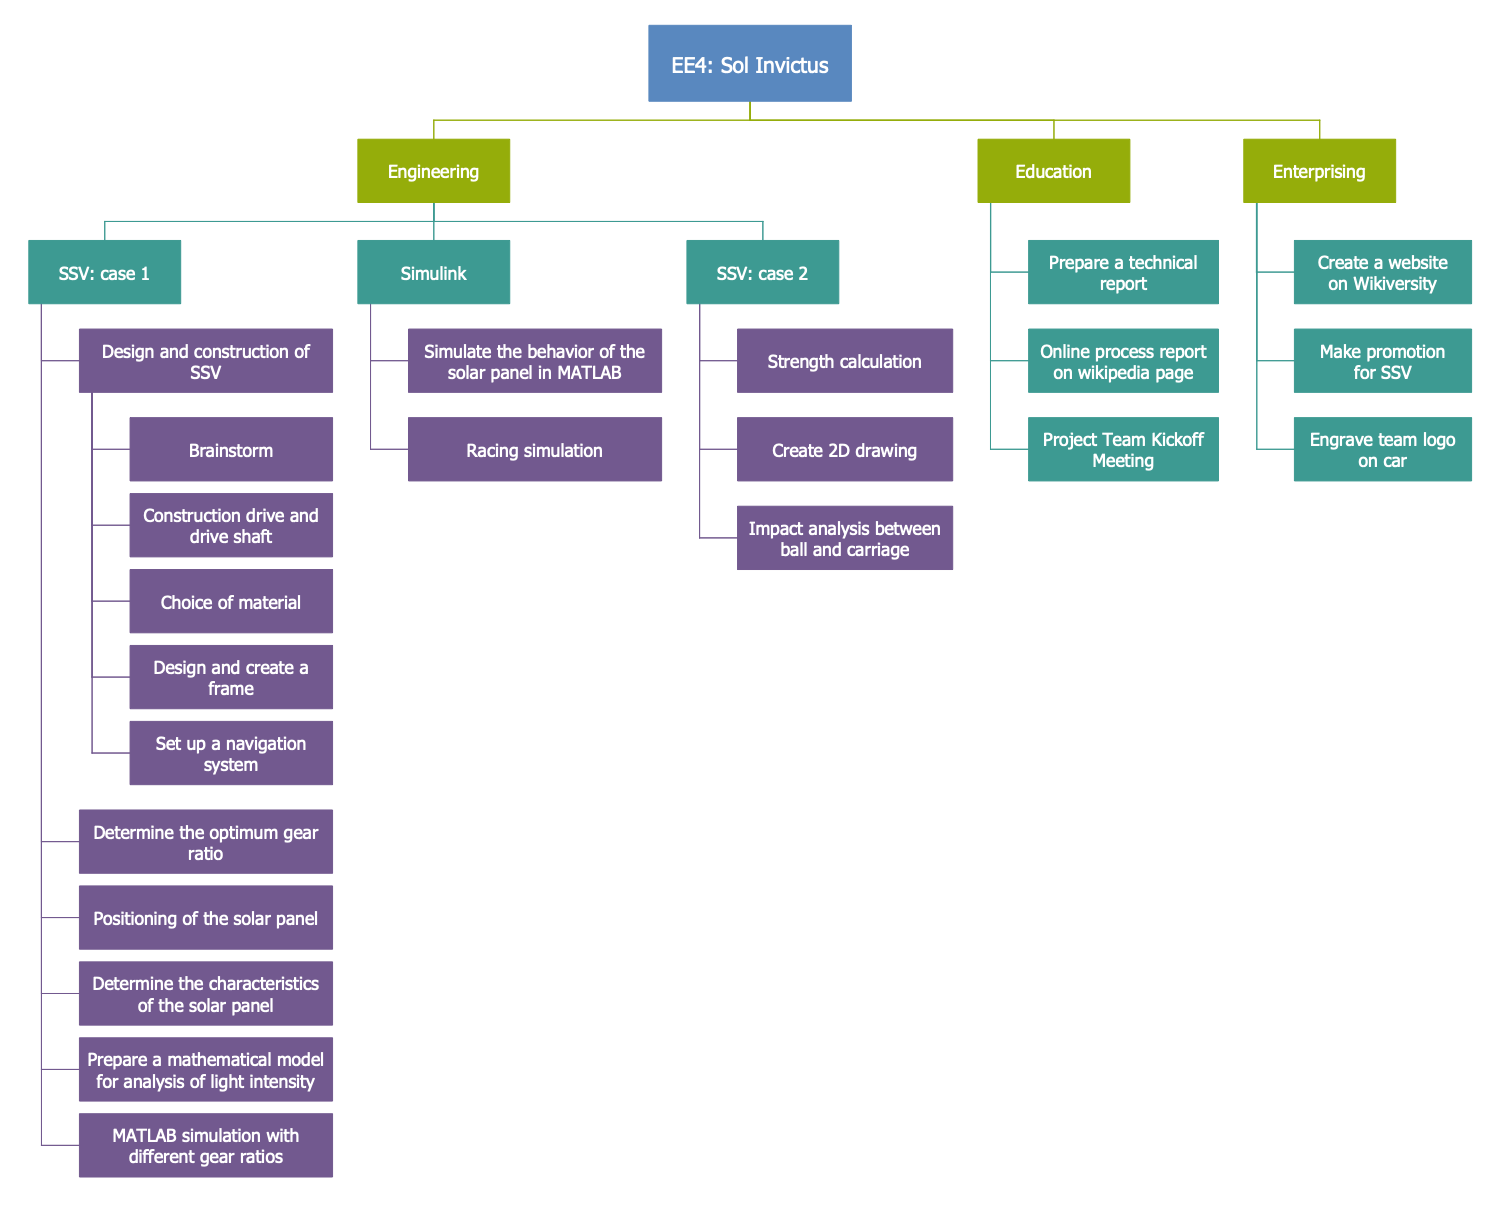
This sample diagram was constructed on the base of Wikimedia Commons file "Work Breakdown Structure — Solar Cell Racing (210) — eng.pdf" and demonstrates the Work Breakdown Structure (WBS) that is a powerful project management and systems engineering tool. Now it is applied to describe the "Solar Cell Racing" project. You can observe the steps of developing the solar-powered race car. It is a project of nine Belgium students composed the Group T. The project's idea is in design and building a solar-powered race car named the Small Solar Vehicle (SSV), the car with the best design and power characteristics, at this economically effective and ecologically clean. The main project steps are engineering, enterprising, and educating, each of them includes many tasks and processes needed to be executed. The main results to be achieved in order to accomplish the main objectives of the project are fixed on this WBS diagram.
Example 8: Work Breakdown Structure
This example was created in ConceptDraw DIAGRAM using the combination of libraries from the Project Diagrams Solution. An experienced user spent 10 minutes creating this sample.
This Project Diagram sample is based on the "Work Breakdown Structure PM9.pdf" Wikimedia Commons file and illustrates the hierarchical Work Breakdown Structure for the "EE4: Sol Invictus" project. WBS is the most effective way to clearly reflect the entire scope of work on the project, to build a hierarchy of means to achieve the project goals, it helps to focus on the expected results, also contains the specialization of the types and amounts of work of project participants and allows one to clearly justify the need in a certain amount of finance and human resources. You can observe three main branches in this diagram — directions in the project's execution: engineering, education, and enterprising. All objects for this diagram were chosen of the identical shape, but differentiate in a color filling, thus the shapes of the first level are light green, the shapes of the second level — green, and of the third one — purple.
Example 9: Work Break Down Structure
This example was created in ConceptDraw DIAGRAM using the combination of libraries from the Project Diagrams Solution. An experienced user spent 15 minutes creating this sample.
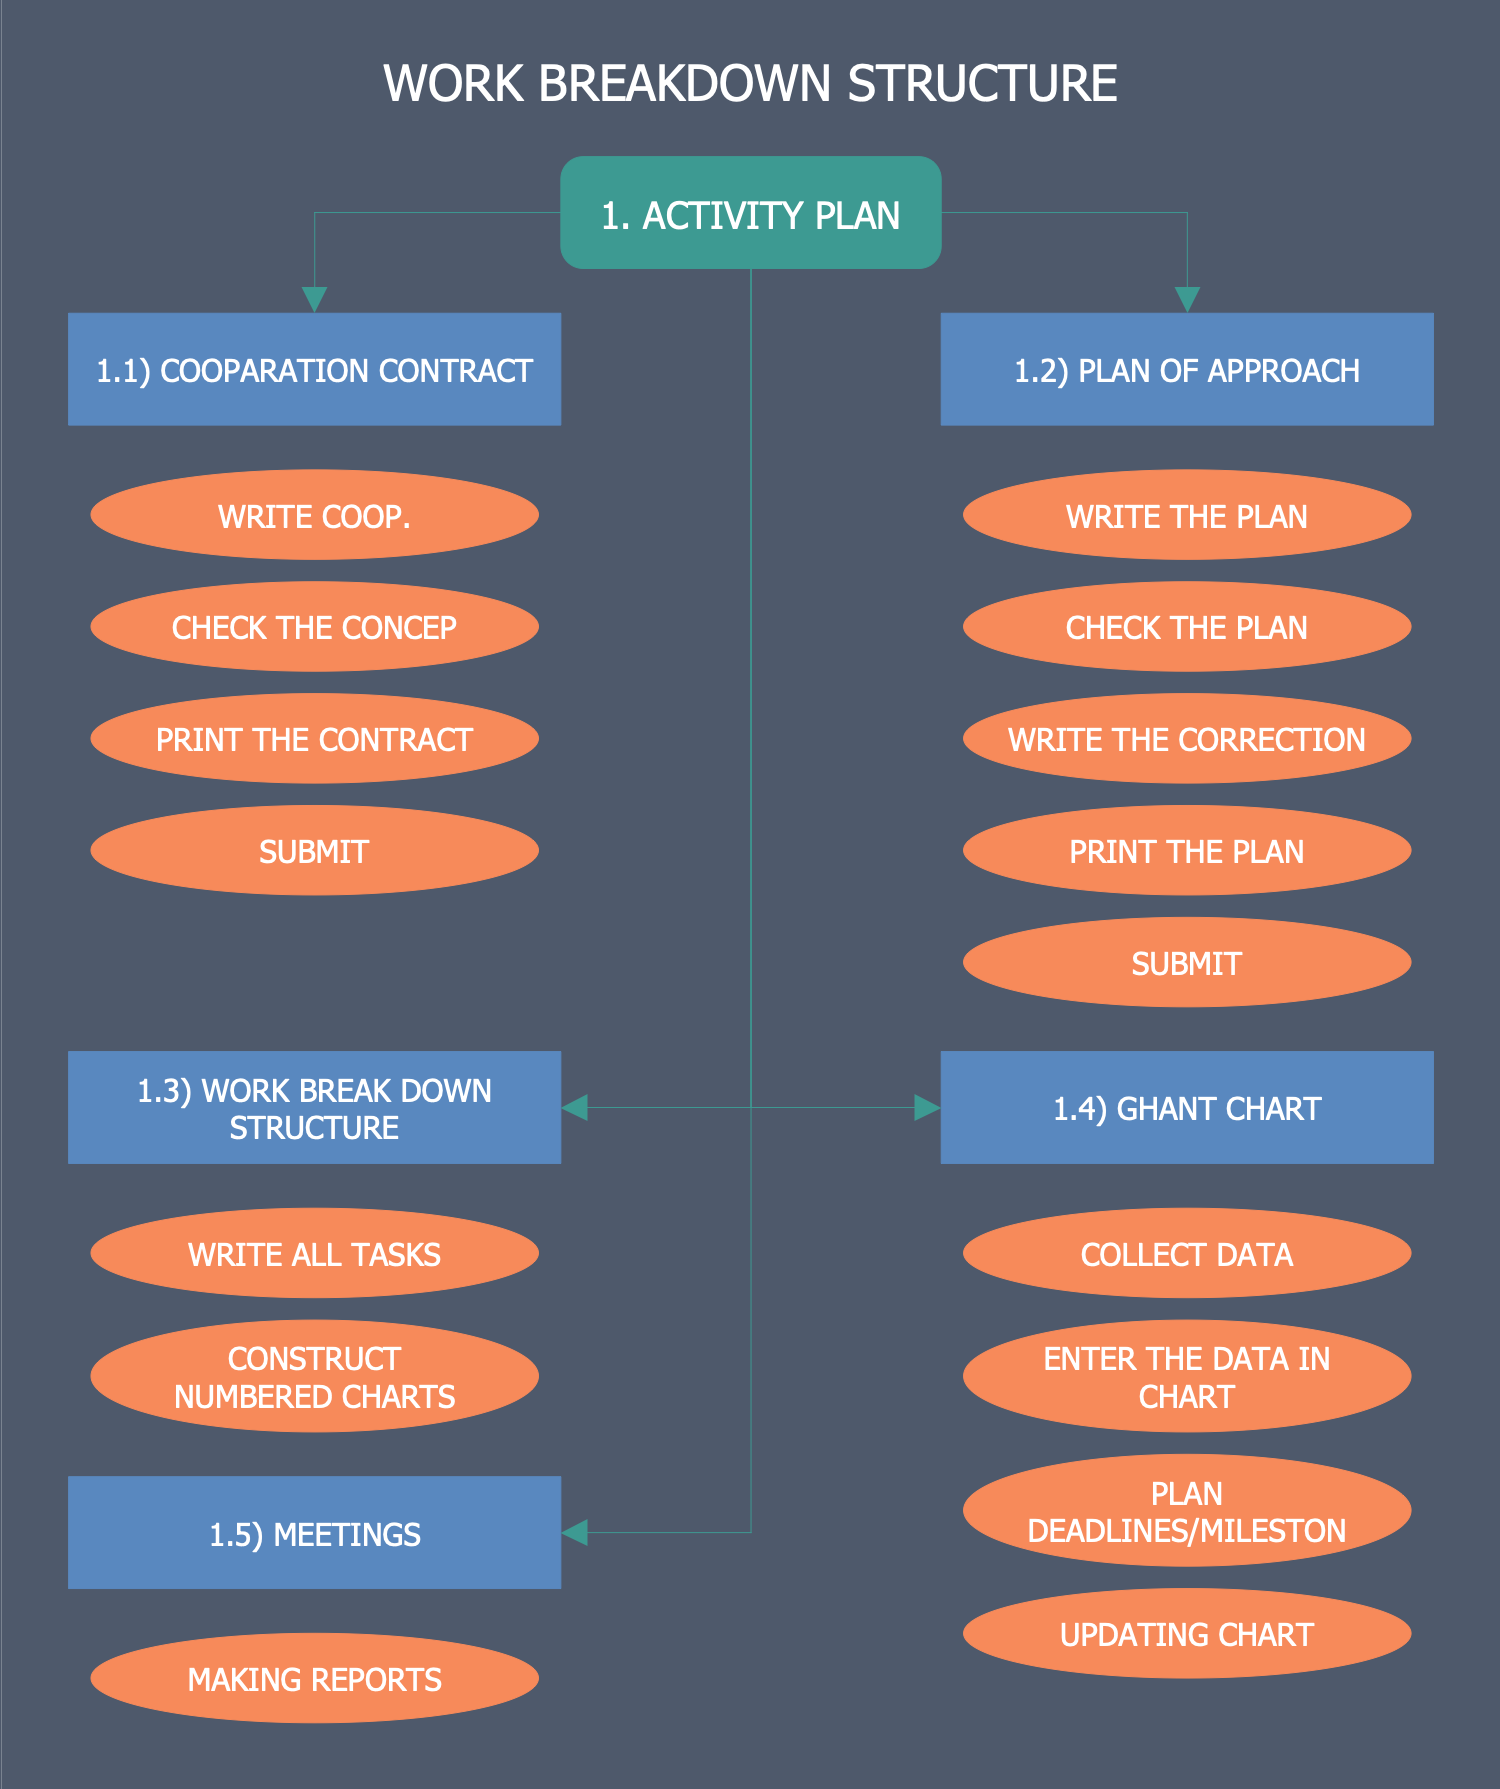
This Project Diagram sample demonstrates the Work Breakdown Structure (WBS) for an activity plan. It is made by means of ConceptDraw DIAGRAM tools, but based on the Wikimedia Commons file "Work Break Down Structure Of SSV EE4.pdf". The main task is broken down into smaller parts — operations and tasks that can be easily executed by the team within a given project. The diagram is represented in a hierarchical form, all steps need to be performed to achieve successfully the main goal of the project. There are included the following tasks: cooperation contract, plan of approach, work breakdown structure, Gantt chart, and meetings. Each of these groups includes a short overview of corresponding tasks or instructions for execution. The use of own style for each level of the hierarchical structure (different shapes and unique color filling) is an absolutely justified idea that gives visual highlighting and differentiating the levels in the diagram.
Example 10: New Project Network Diagram
This example was created in ConceptDraw DIAGRAM using the combination of libraries from the Project Diagrams Solution. An experienced user spent 5 minutes creating this sample.
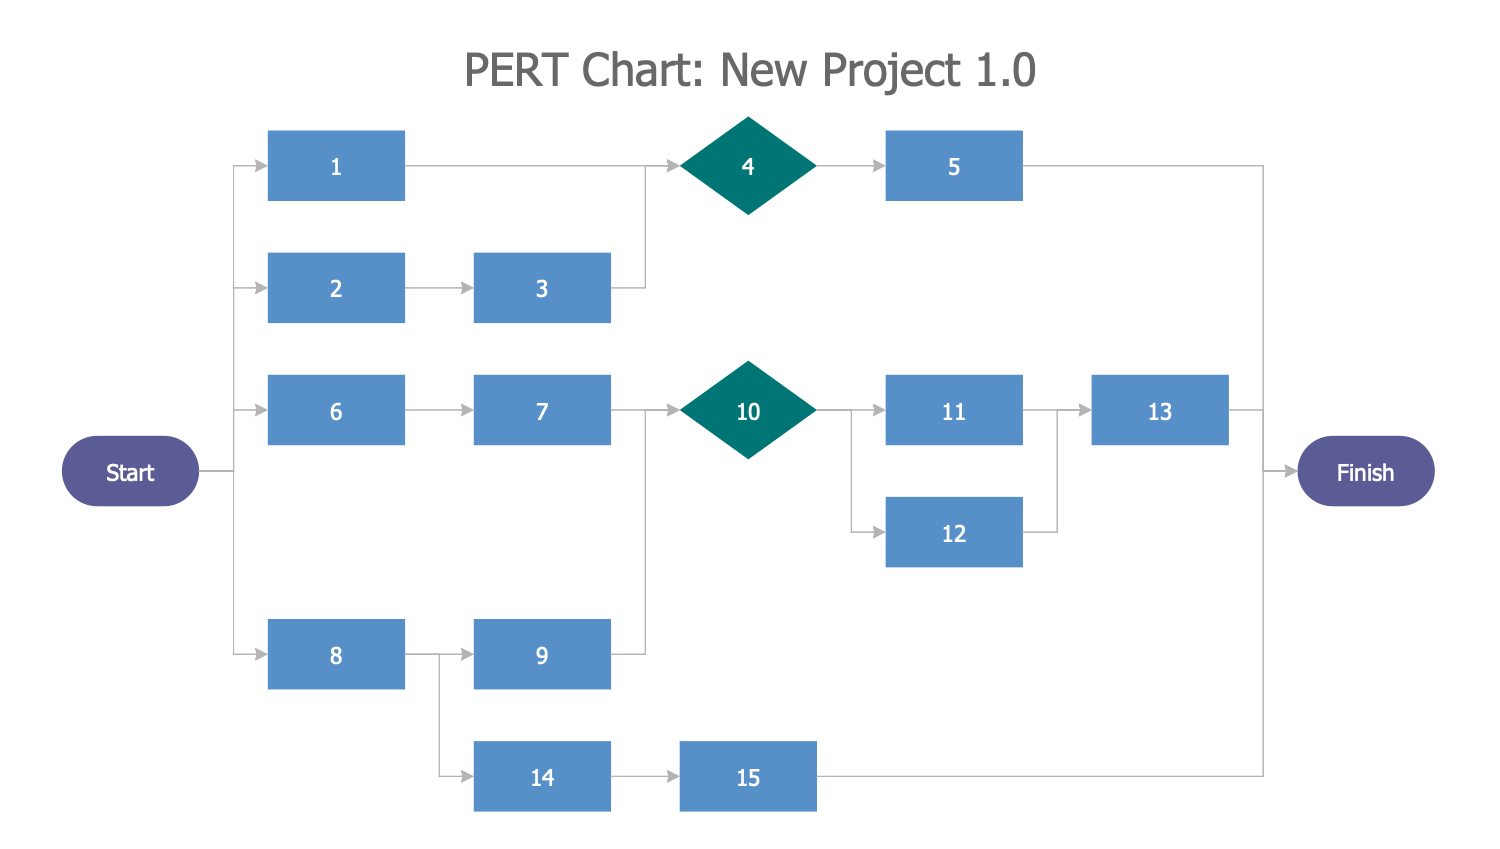
The Project Evaluation and Review Technique (PERT) chart is a powerful project management tool that gives the ability to schedule and organize your tasks. This PERT chart example was automatically generated for ConceptDraw DIAGRAM software from Project Network Mind Map created in ConceptDraw MINDMAP software. The Project Diagrams solution tools from the Project Management area were used. This sample illustrates ConceptDraw’s INGYRE technology for integration between ConceptDraw Office software apps. Each topic exported to this PERT chart had one of three types in a Mind Map: PERT, PERT activity, or PERT event. Both elements Start and Finish in this PERT chart obligatory had PERT event topic types in the source Mind Map. For greater clarity, you can format the resulting PERT chart to your liking. In this diagram, elements of different types are colored differently. You can also highlight tasks that require special attention.
Example 11: New Project WBS Diagram
This example was created in ConceptDraw DIAGRAM using the combination of libraries from the Project Diagrams Solution. An experienced user spent 5 minutes creating this sample.
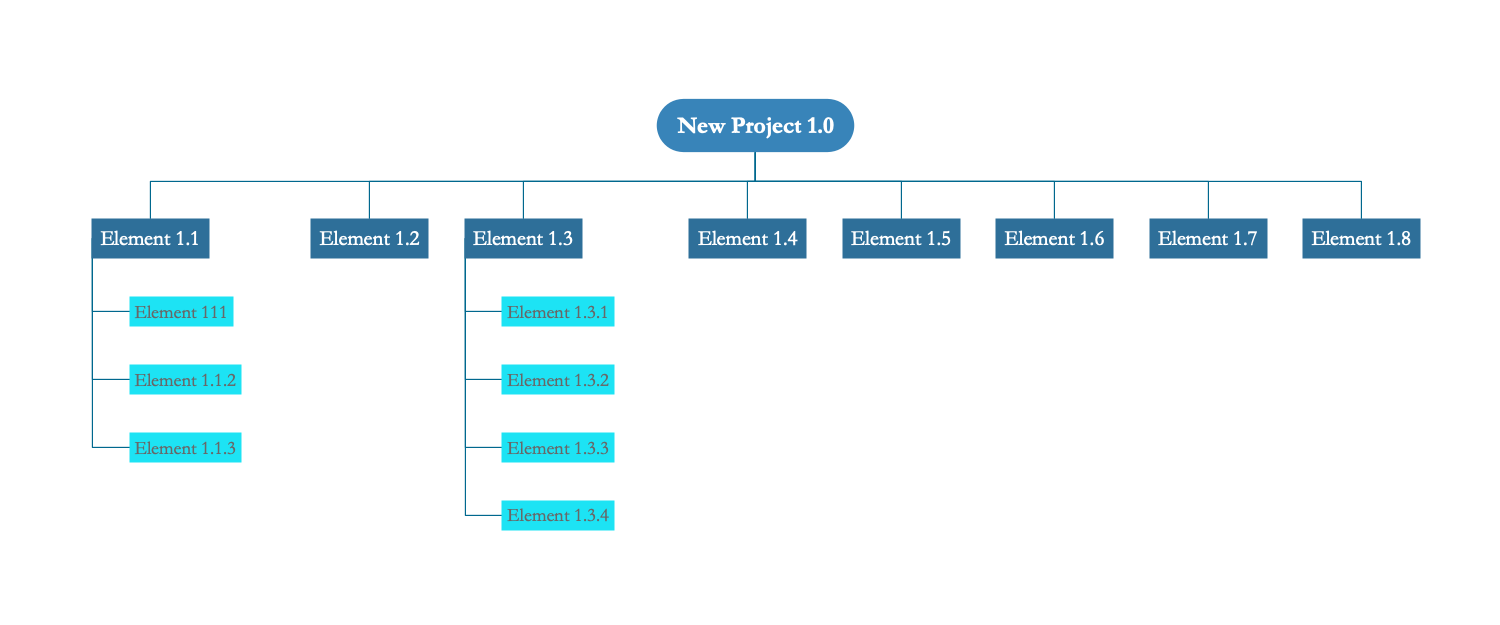
The Work Breakdown Structure (WBS) is a popular project management tool. It allows you to structure your project breaking it down into simple and manageable tasks. This is especially important for complex projects with a large number of tasks and work resources, as it helps to simplify the execution, control and management of the project. This sample shows an example of a Project Work Breakdown Structure (WBS) diagram. It was autogenerated for ConceptDraw DIAGRAM software from Mind Map WBS created in ConceptDraw MINDMAP software using Project Diagrams solution. The diagram has a hierarchical or tree structure. The block with the name of the project is located at the top of the WBS structure. All other blocks display the phases and tasks of the project with detailed information about duration, cost and resources. The blocks corresponding to the phases of the project contain a summary of its tasks. To be included in this diagram, topics must be of the WBS or WBS Element topic types in the original Mind Map.

Template 1: New Project Network
This example was created in ConceptDraw DIAGRAM using the combination of libraries from the Project Diagrams Solution. An experienced user spent 10 minutes creating this sample.
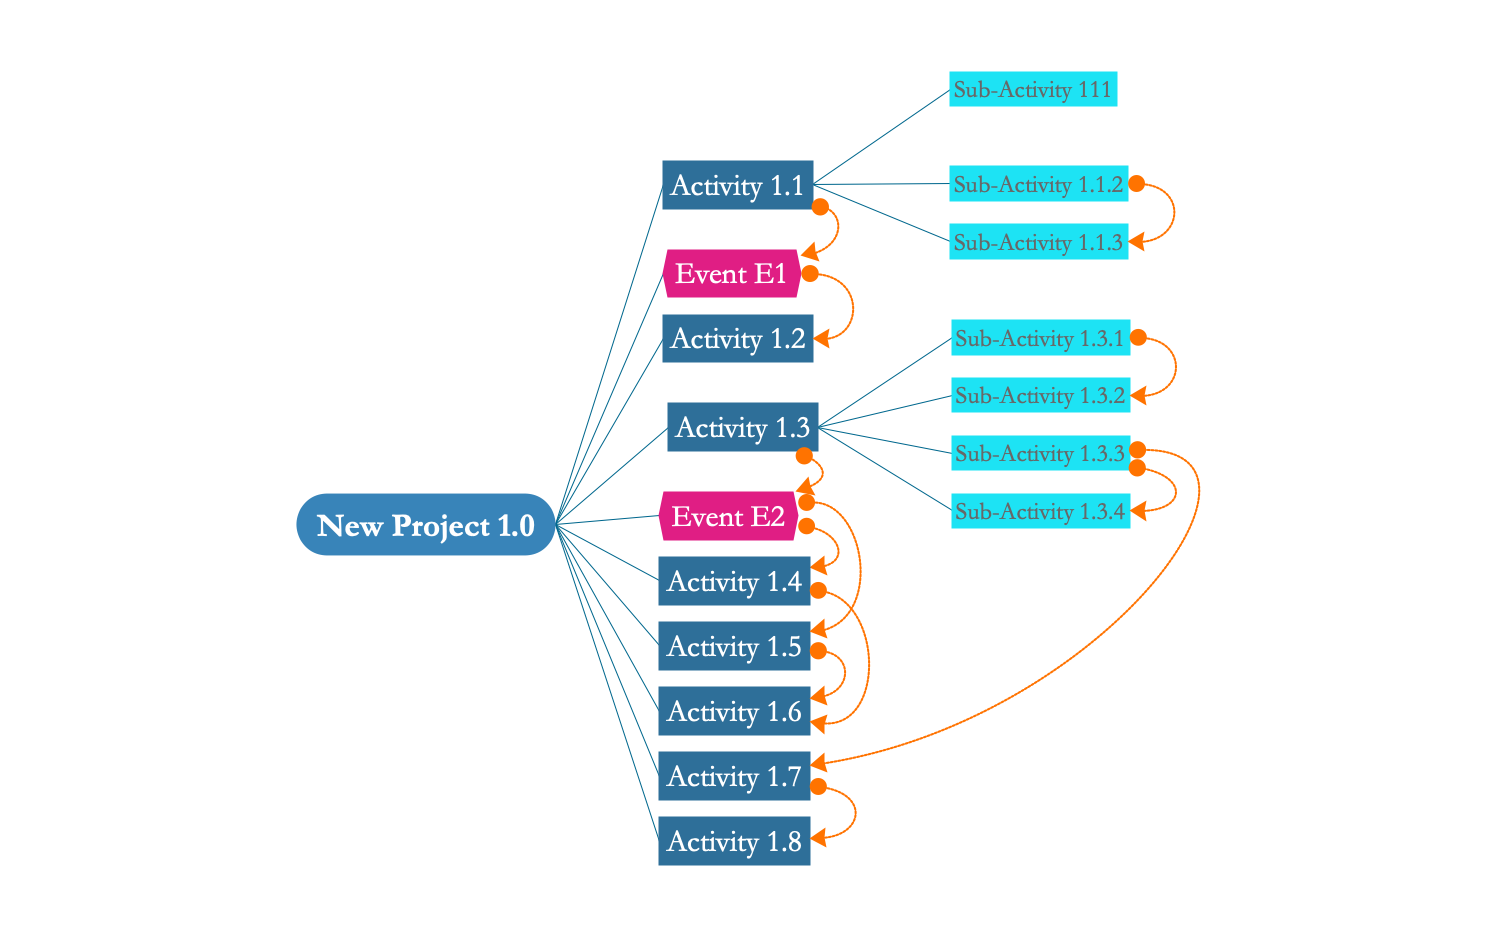
This Mind Map template for project network was created in ConceptDraw MINDMAP. You can use it to test the PERT Chart auto-generation feature. Being applied in ConceptDraw MINDMAP, this tool generates PERT Chart and automatically opens it in ConceptDraw DIAGRAM. PERT chart is an incredibly useful project management tool. It structures project tasks, organizes complex projects, specifies dependencies between project steps. In addition, it helps to analyze objectives of the project, determine the time of the projects completion, find its critical path and speed up its finalizing. Each Mind Map task is assigned its own topic type. The PERT topic type is assigned to the Main Idea, the PERT Activity topic type is assigned to the topics corresponding to the activities, and the PERT Event topic type is assigned to the “start” and “end” events. This distribution of types ensures that the PERT chart is correctly generated based on your Mind Map.
Template 2: New Project WBS
This example was created in ConceptDraw DIAGRAM using the combination of libraries from the Project Diagrams Solution. An experienced user spent 10 minutes creating this sample.
This Mind Map template was created in ConceptDraw MINDMAP. You can use it to test the automatic generation of WBS diagrams in ConceptDraw MINDMAP. The automatically generated WBS diagram opens immediately in ConceptDraw DIAGRAM. This is possible thanks to ConceptDraw’s INGYRE technology for integrating ConceptDraw Office software applications. You may notice that there are special types set for Mind Map topics. To further create WBS diagrams, two types of topics are used. These are the WBS and WBS Element topic types. Assigning a WBS topic type to the Main Idea and a WBS Element topic type for all Mind Map topics you want to export will ensure that the ConceptDraw DIAGRAM is autogenerated correctly. The resulting WBS diagram is useful for project managers to effectively organize and monitor project execution and progress, assign responsibilities between the project team, and analyze all processes. This helps to indicate the main stages of the project and evaluate its productivity.
Inside
What I Need to Get Started
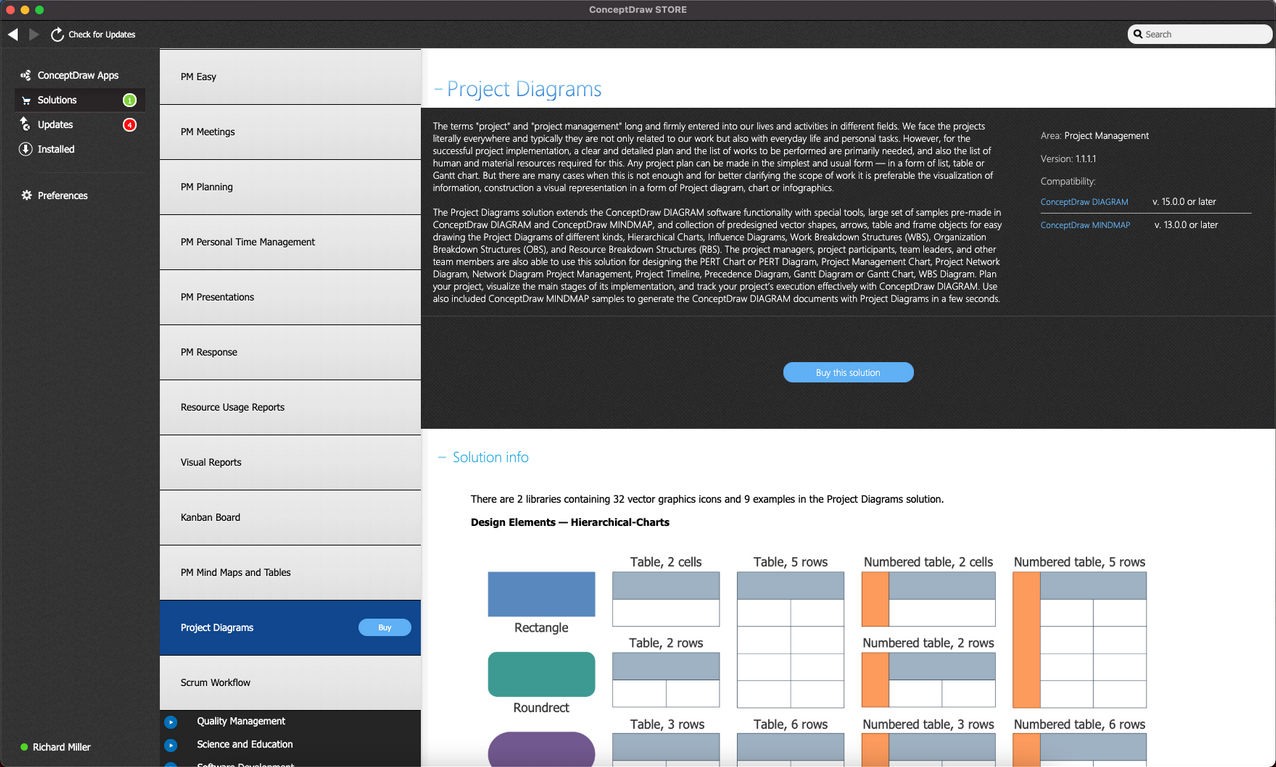
After ConceptDraw DIAGRAM and ConceptDraw MINDMAP are installed, the Project Diagrams solution can be purchased either from the Project Management area of ConceptDraw STORE itself or from our online store. Thus, you will be able to use the Project Diagrams solution straight after.
How to install
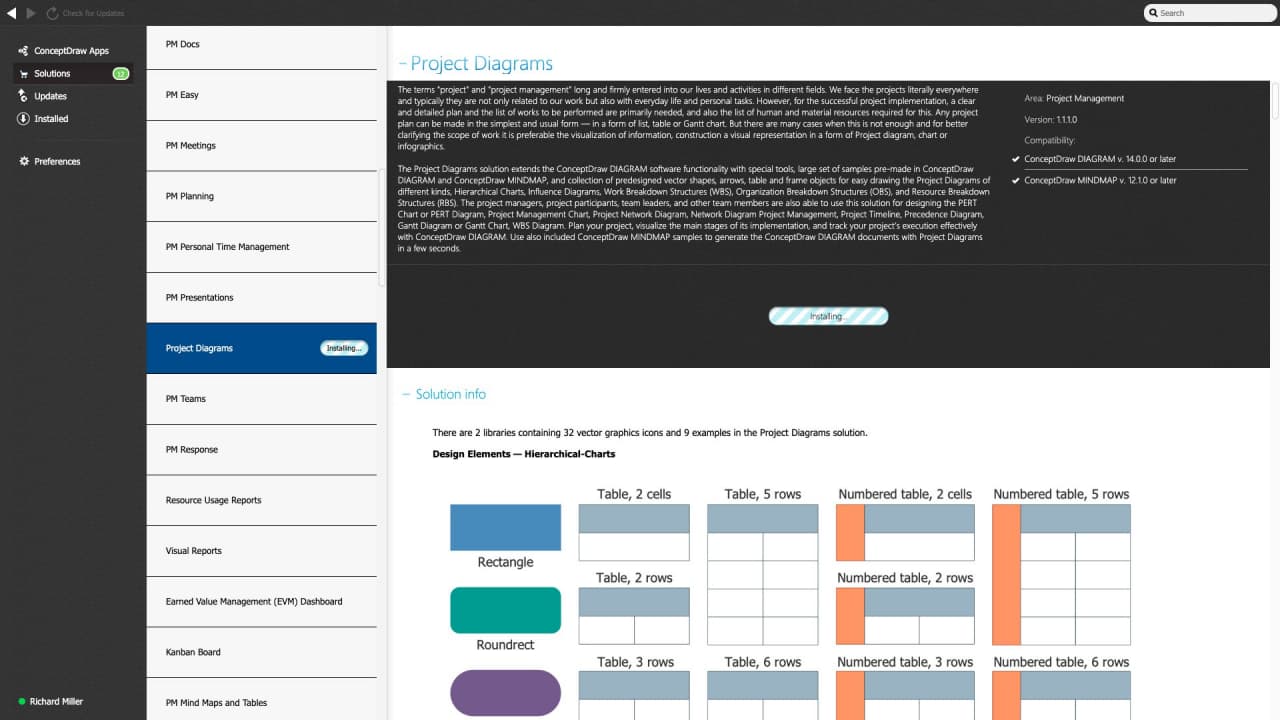
First of all, make sure that both ConceptDraw STORE, ConceptDraw DIAGRAM and ConceptDraw MINDMAP applications are downloaded and installed on your computer. Next, install the Project Diagrams solution from the ConceptDraw STORE to use it in the ConceptDraw DIAGRAM and ConceptDraw MINDMAP applications.
Start using
Start using the Project Diagrams solution to make the professionally looking illustrations by adding the design elements taken from the stencil libraries and editing the pre-made examples that can be found there.
