- Electric and Telecom Plans Free
- Fire and Emergency Plans Free
- Floor Plans Free
- Plant Layout Plans Free
- School and Training Plans Free
- Seating Plans Free
- Security and Access Plans Free
- Site Plans Free
- Sport Field Plans Free
- Business Process Diagrams Free
- Business Process Mapping Free
- Classic Business Process Modeling Free
- Cross-Functional Flowcharts Free
- Event-driven Process Chain Diagrams Free
- IDEF Business Process Diagrams Free
- Logistics Flow Charts Free
- Workflow Diagrams Free
- ConceptDraw Dashboard for Facebook Free
- Mind Map Exchange Free
- MindTweet Free
- Note Exchange Free
- Project Exchange Free
- Social Media Response Free
- Active Directory Diagrams Free
- AWS Architecture Diagrams Free
- Azure Architecture Free
- Cisco Network Diagrams Free
- Cisco Networking Free
- Cloud Computing Diagrams Free
- Computer Network Diagrams Free
- Google Cloud Platform Free
- Interactive Voice Response Diagrams Free
- Network Layout Floor Plans Free
- Network Security Diagrams Free
- Rack Diagrams Free
- Telecommunication Network Diagrams Free
- Vehicular Networking Free
- Wireless Networks Free
- Comparison Dashboard Free
- Composition Dashboard Free
- Correlation Dashboard Free
- Frequency Distribution Dashboard Free
- Meter Dashboard Free
- Spatial Dashboard Free
- Status Dashboard Free
- Time Series Dashboard Free
- Basic Circle-Spoke Diagrams Free
- Basic Circular Arrows Diagrams Free
- Basic Venn Diagrams Free
- Block Diagrams Free
- Concept Maps Free
- Family Tree Free
- Flowcharts Free
- Basic Area Charts Free
- Basic Bar Graphs Free
- Basic Divided Bar Diagrams Free
- Basic Histograms Free
- Basic Line Graphs Free
- Basic Picture Graphs Free
- Basic Pie Charts Free
- Basic Scatter Diagrams Free
- Aerospace and Transport Free
- Artwork Free
- Audio, Video, Media Free
- Business and Finance Free
- Computers and Communications Free
- Holiday Free
- Manufacturing and Maintenance Free
- Nature Free
- People Free
- Presentation Clipart Free
- Safety and Security Free
- Analog Electronics Free
- Audio and Video Connectors Free
- Basic Circuit Diagrams Free
- Chemical and Process Engineering Free
- Digital Electronics Free
- Electrical Engineering Free
- Electron Tube Circuits Free
- Electronic Block Diagrams Free
- Fault Tree Analysis Diagrams Free
- GHS Hazard Pictograms Free
- Home Automation and Wiring Free
- Mechanical Engineering Free
- One-line Diagrams Free
- Power Сircuits Free
- Specification and Description Language (SDL) Free
- Telecom and AV Circuits Free
- Transport Hazard Pictograms Free
- Data-driven Infographics Free
- Pictorial Infographics Free
- Spatial Infographics Free
- Typography Infographics Free
- Calendars Free
- Decision Making Free
- Enterprise Architecture Diagrams Free
- Fishbone Diagrams Free
- Organizational Charts Free
- Plan-Do-Check-Act (PDCA) Free
- Seven Management and Planning Tools Free
- SWOT and TOWS Matrix Diagrams Free
- Timeline Diagrams Free
- Australia Map Free
- Continent Maps Free
- Directional Maps Free
- Germany Map Free
- Metro Map Free
- UK Map Free
- USA Maps Free
- Customer Journey Mapping Free
- Marketing Diagrams Free
- Matrices Free
- Pyramid Diagrams Free
- Sales Dashboard Free
- Sales Flowcharts Free
- Target and Circular Diagrams Free
- Cash Flow Reports Free
- Current Activities Reports Free
- Custom Excel Report Free
- Knowledge Reports Free
- MINDMAP Reports Free
- Overview Reports Free
- PM Agile Free
- PM Dashboards Free
- PM Docs Free
- PM Easy Free
- PM Meetings Free
- PM Planning Free
- PM Presentations Free
- PM Response Free
- Resource Usage Reports Free
- Visual Reports Free
- House of Quality Free
- Quality Mind Map Free
- Total Quality Management TQM Diagrams Free
- Value Stream Mapping Free
- Astronomy Free
- Biology Free
- Chemistry Free
- Language Learning Free
- Mathematics Free
- Physics Free
- Piano Sheet Music Free
- Android User Interface Free
- Class Hierarchy Tree Free
- Data Flow Diagrams (DFD) Free
- DOM Tree Free
- Entity-Relationship Diagram (ERD) Free
- EXPRESS-G data Modeling Diagram Free
- IDEF0 Diagrams Free
- iPhone User Interface Free
- Jackson Structured Programming (JSP) Diagrams Free
- macOS User Interface Free
- Object-Role Modeling (ORM) Diagrams Free
- Rapid UML Free
- SYSML Free
- Website Wireframe Free
- Windows 10 User Interface Free
Travel Infographics
Tourism is a well-developed industry almost all over the world. It is the fundamental basis of the economy of many developed and developing countries. Tourism is a complex of transportation and accommodation facilities, attractions, food facilities, objects of entertainment, education, recreation, sport, business, organizations engaged in tour operator and travel agency activities, providing excursion services, interpreters and guides services, etc.
Illustration and visualization have great importance in many areas and business areas, and especially in the tourism sector where their main goal is advertising, sales promotion and active development. The visual objects attract attention much faster and more effectively than just text, and exactly they encourage to read the accompanying text, to pay attention and to be interested in the presented information, to use the advertising offer.
The illustrations and infographics related to tourism should cause extremely favorable associations, be expressive and concise, if these are the advertising materials, then they should inspire on traveling, and moreover to the most interesting and remote corners of the world. Very often, exactly for the tourist materials there are used not just the pictures and illustrations, but extraordinary artistic solutions, photos of the most exceptional and exotic corners of the planet, taken from the most interesting and unexpected angles, which attract and charm from just one look and are easy to remember. However, visual and vivid drawings, stylish design illustrations, infographics, and colorful diagrams of various kinds are often used in advertising and marketing in the tourism sector along with photography. Moreover, the informativity of infographics only gets enhanced by adding the visual graphics, diagrams, arrows, callouts, comments, statistics, and captions explaining the figures, alongside the text.
The color has particular importance for visualization, marketing and advertising; it can greatly affect the mood of consumers and their decisions. The proper use of illustrations and colors in tourist infographics allows you to present tourist facilities and services in the most favorable form.
Travel Infographics solution greatly extends the ConceptDraw DIAGRAM functionality making it the best travel infographics design software. The included libraries contain a large variety of ready-made travel infographic vector clipart, design objects and travel infographics icons for drawing exceptional travel infographics and business travel infographics, travel illustrations, presentations, diagrams, schematics, plans, maps, posters, billboards, advertising, marketing, and other materials on the subject of travel and tourism, outdoor activities and extreme sports. This solution contains professionally-designed samples and travel infographics template, and is intended for all specialists in the travel sphere, travel agents, marketers, advertisers, PR specialists, travelers and all other people related with tourism and rest.
-
Buy this solution $25 -
Solution Requirements - This solution requires the following products to be installed:
ConceptDraw DIAGRAM v18 - This solution requires the following products to be installed:
-
Compatibility - Sonoma (14), Sonoma (15)
MS Windows 10, 11 - Sonoma (14), Sonoma (15)
-
Support for this Solution -
Helpdesk
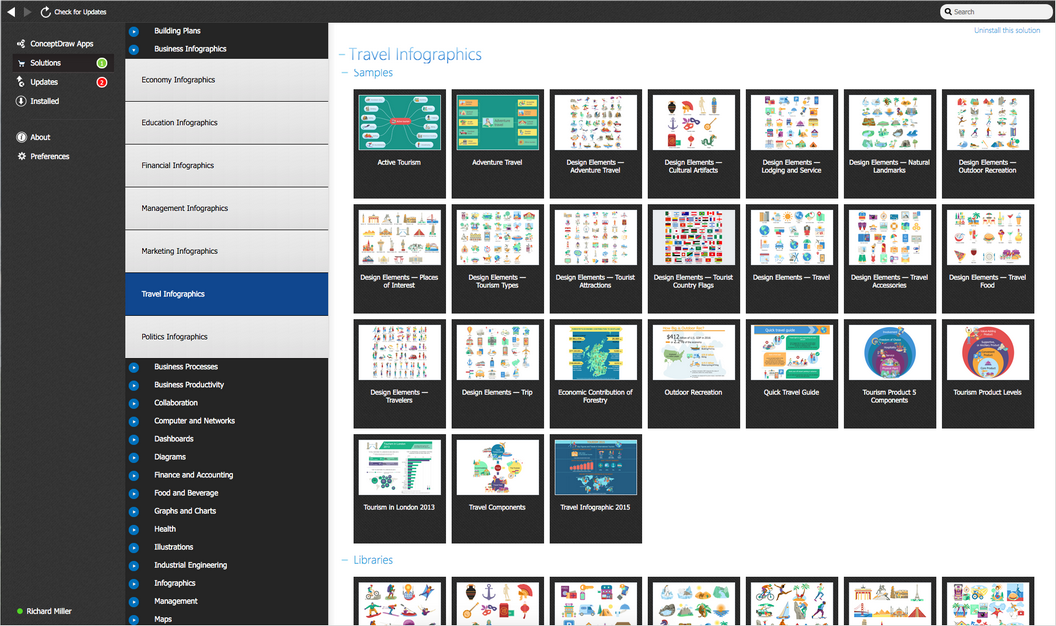
There are 14 stencil libraries containing 443 vector objects and 10 examples in the Travel Infographics solution.
Design Elements — Adventure Travel
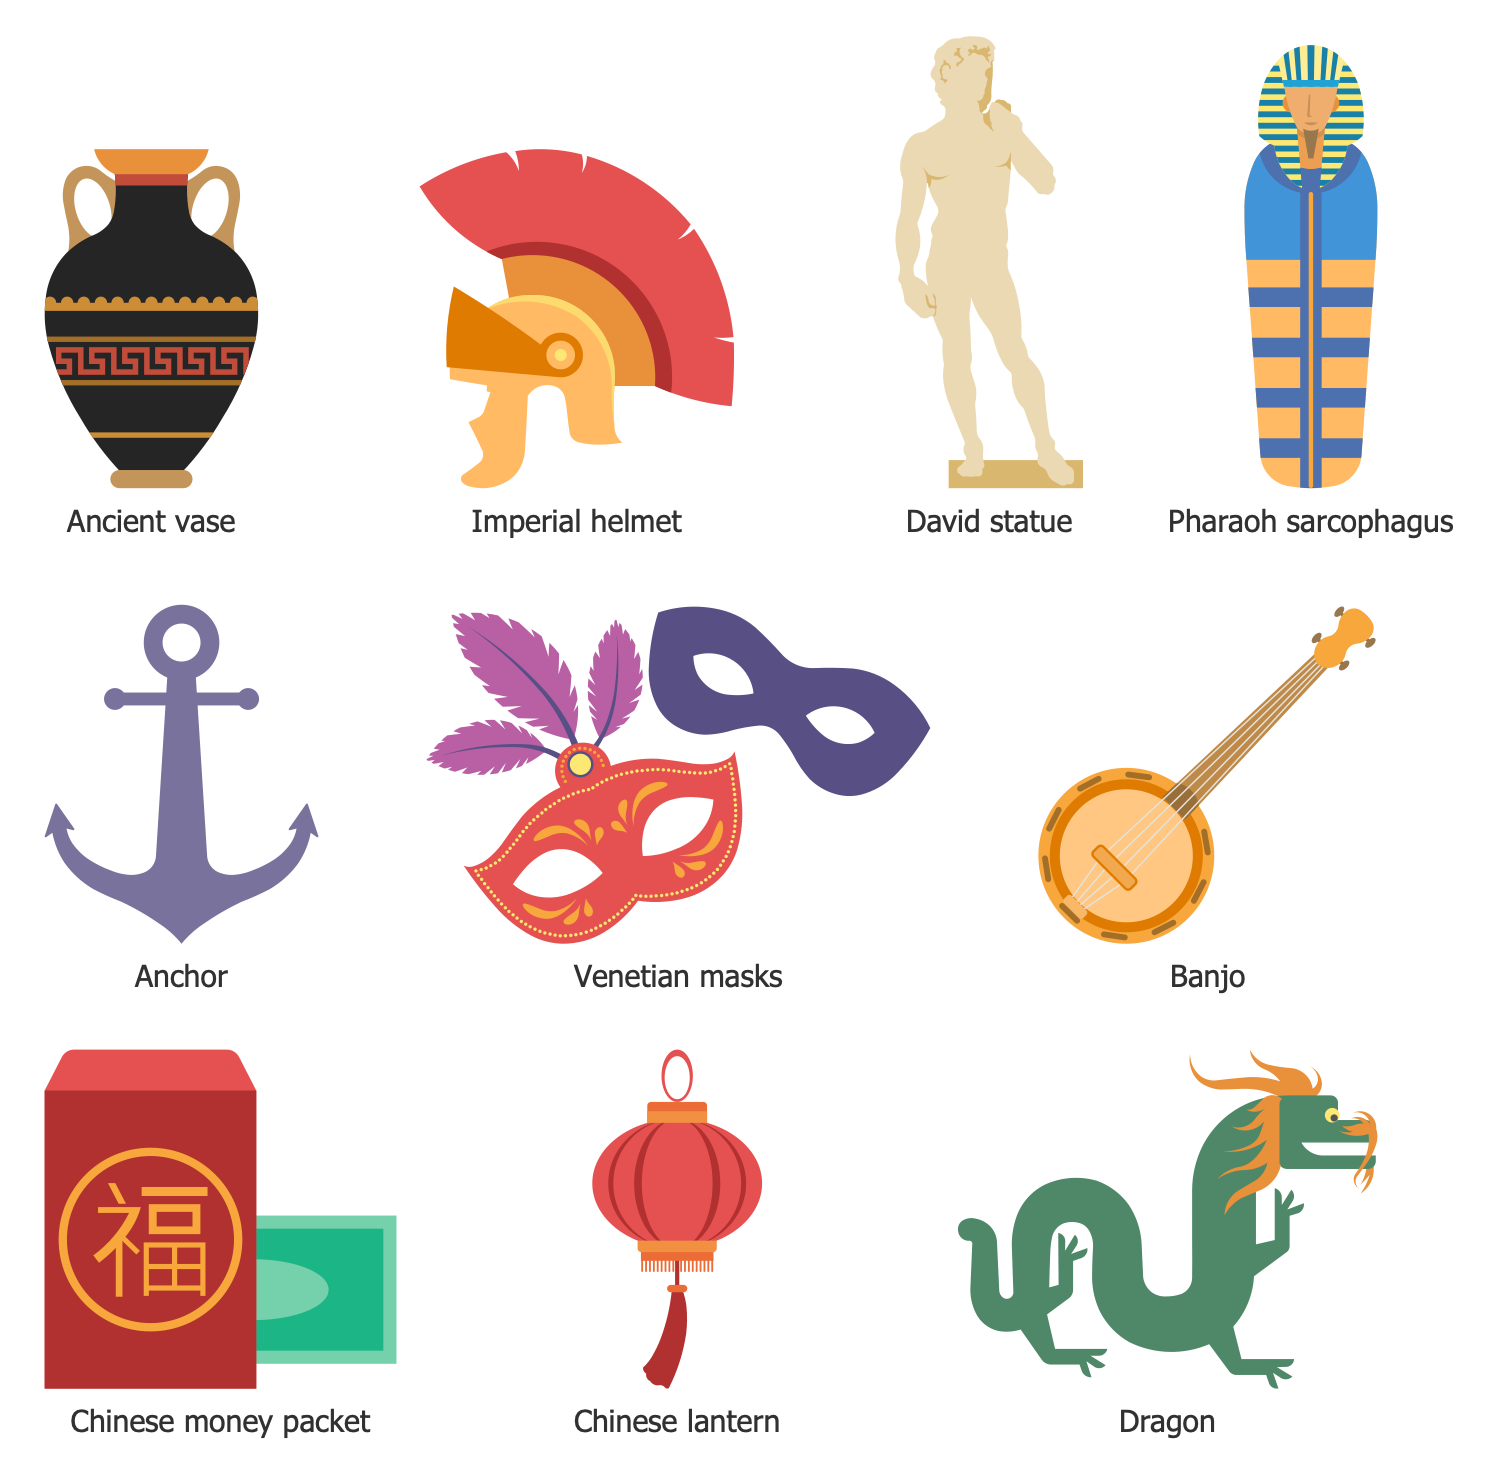
Design Elements — Cultural Artifacts
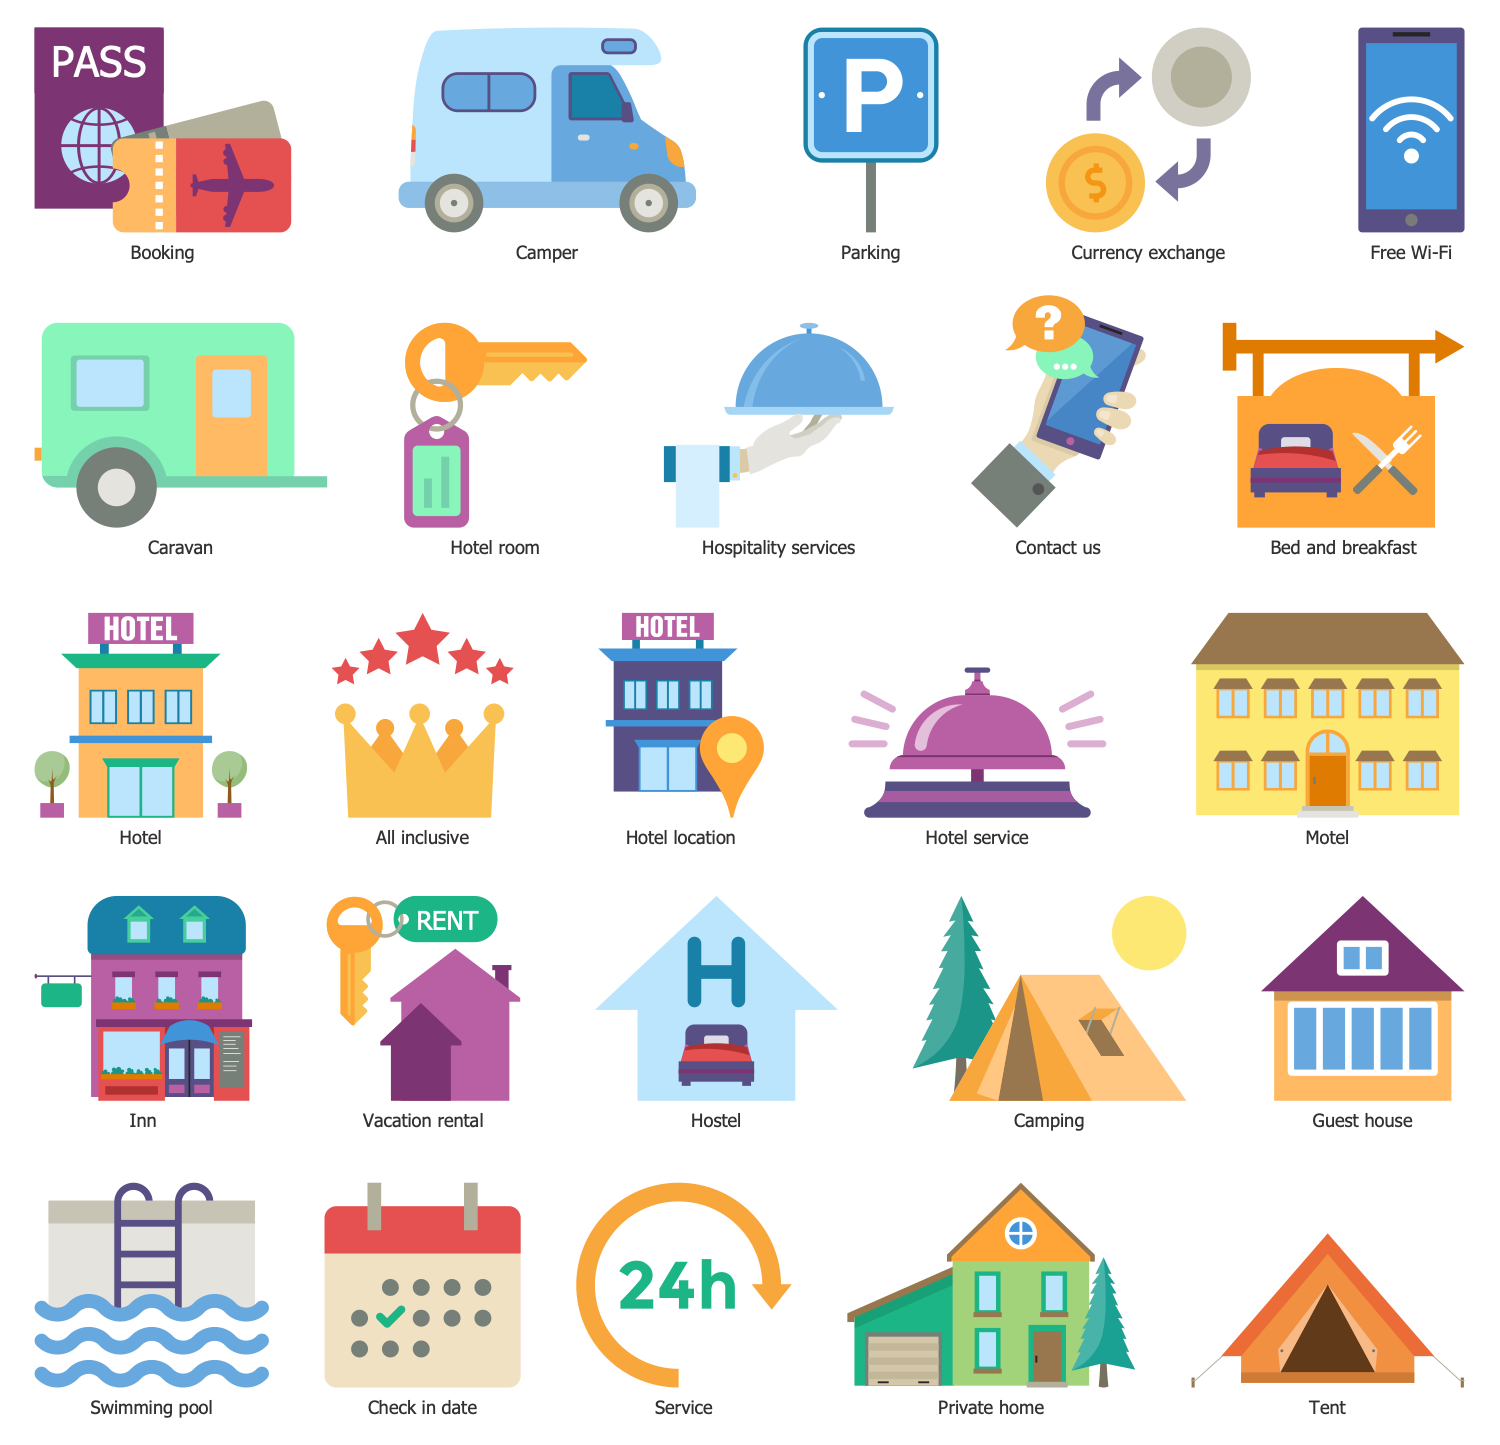
Design Elements — Lodging and Service
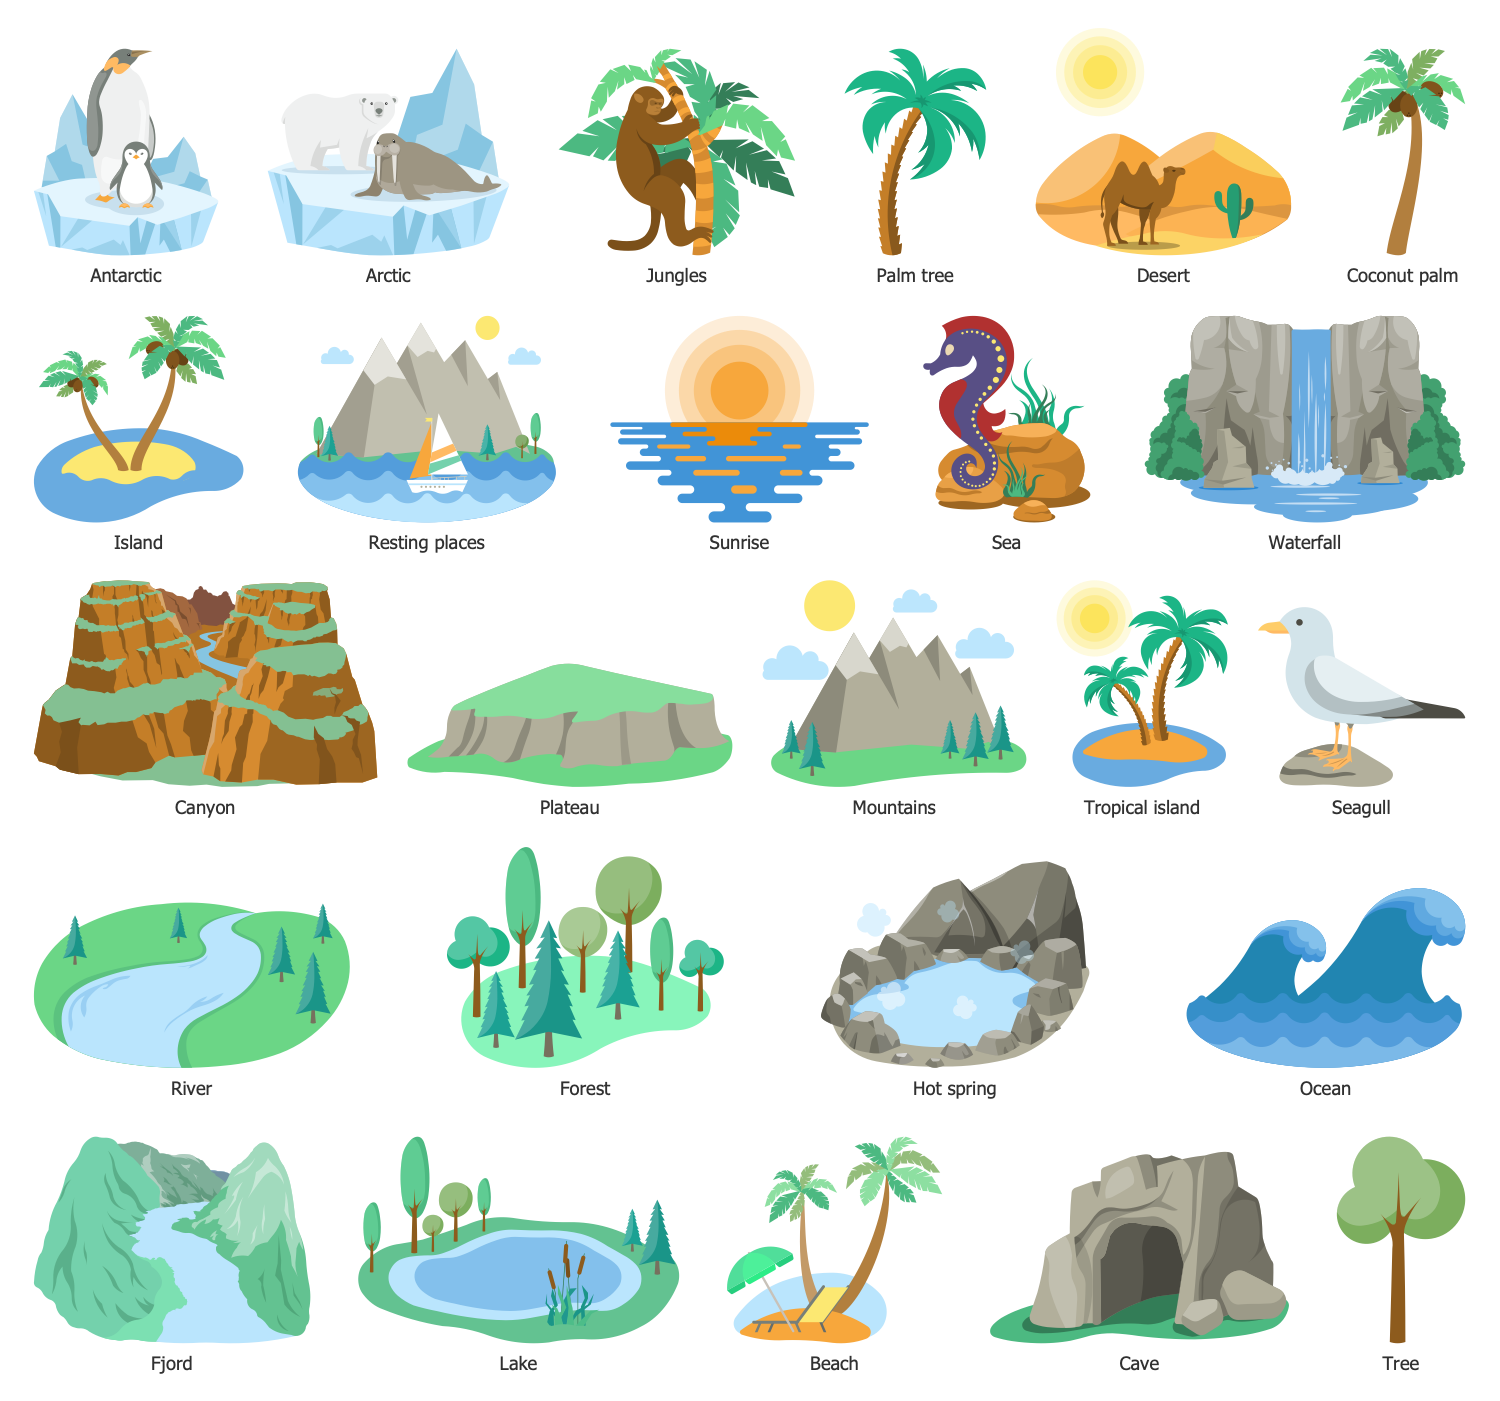
Design Elements — Natural Landmarks
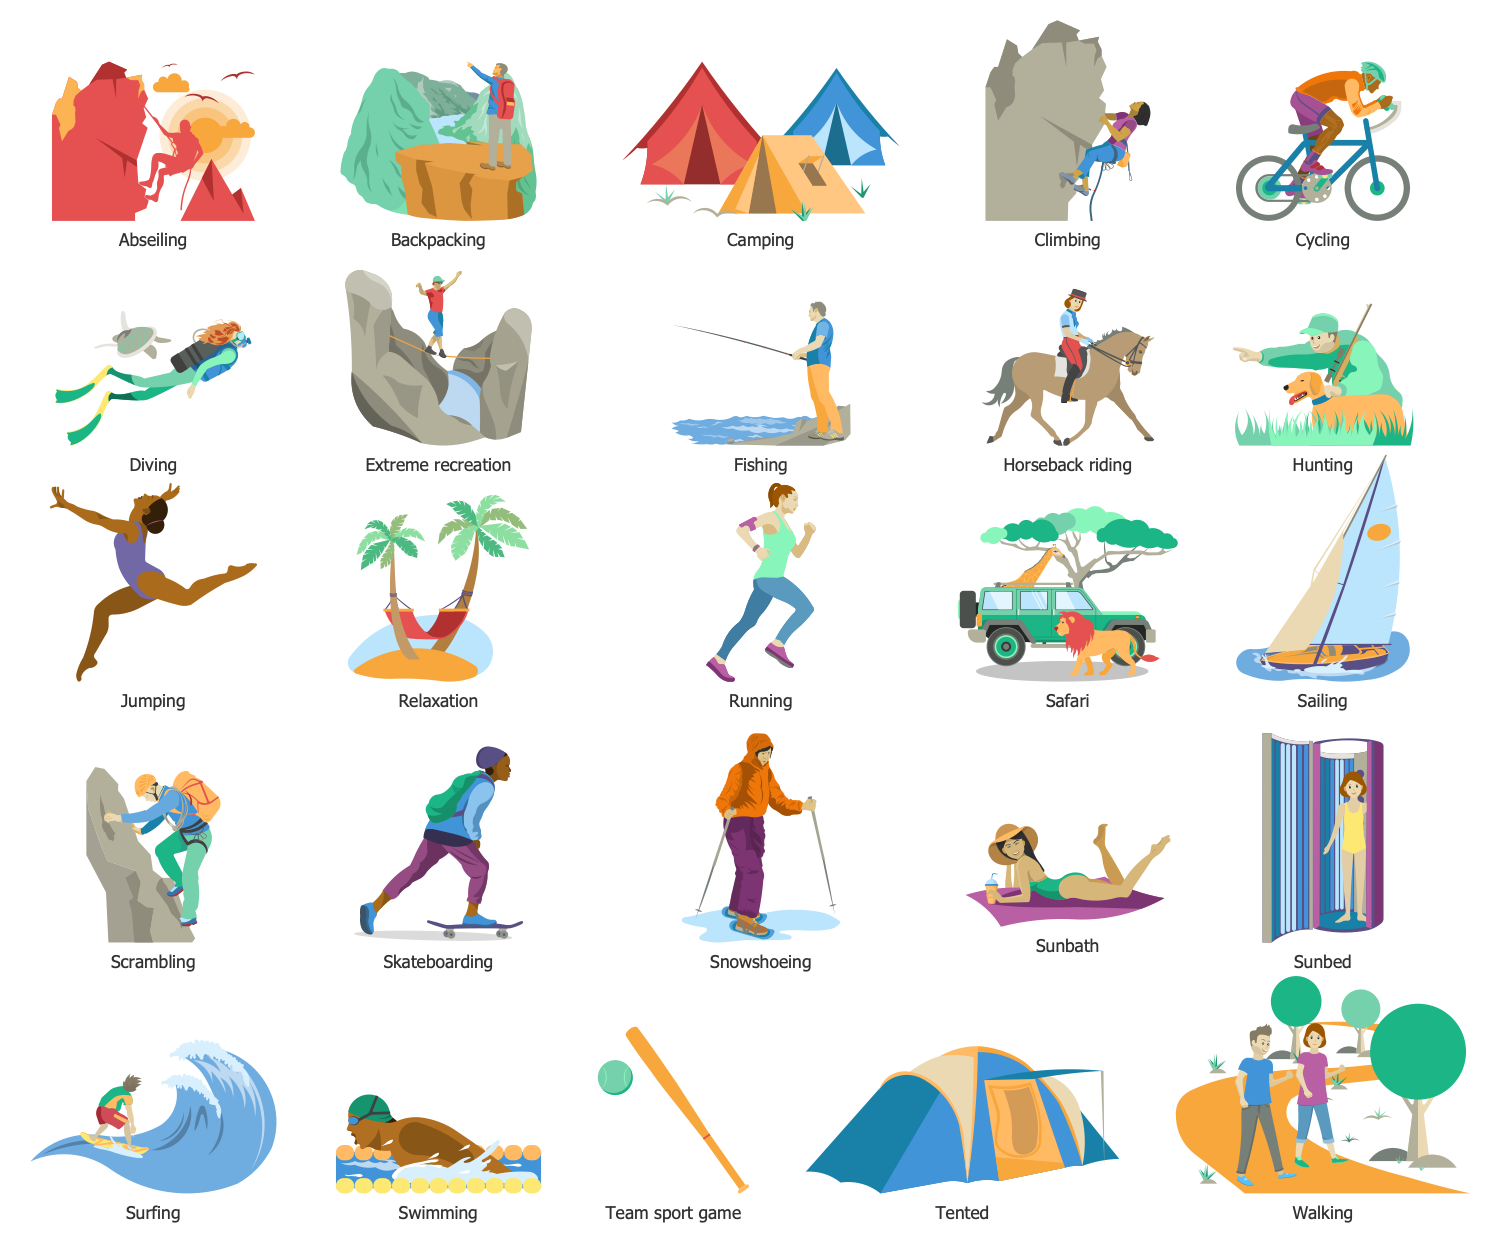
Design Elements — Outdoor Recreation
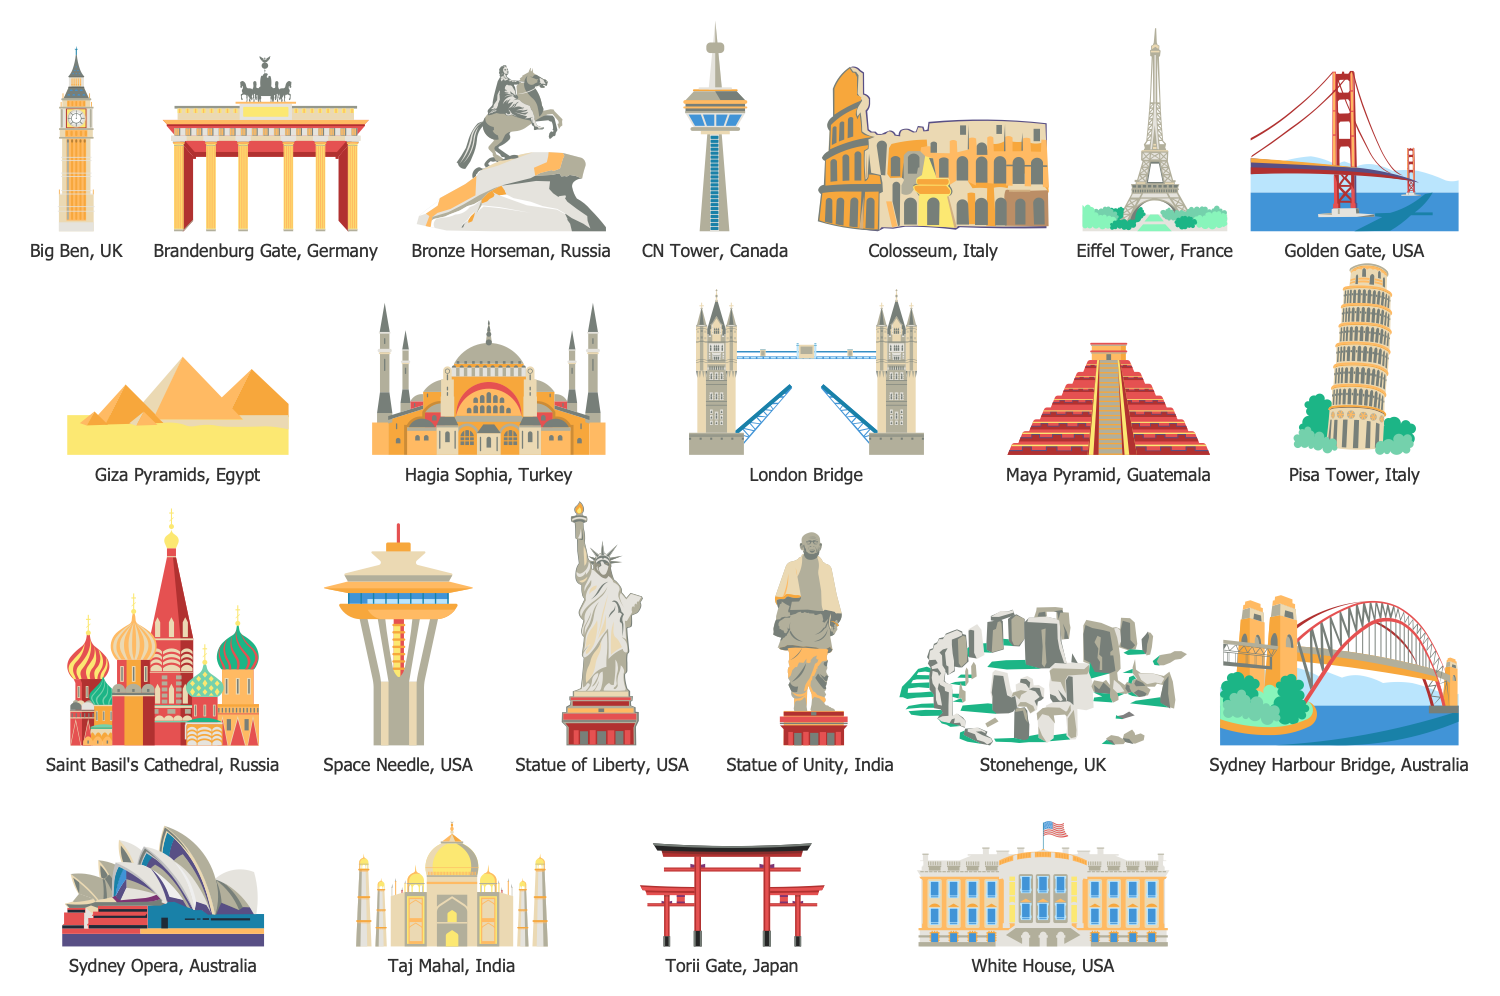
Design Elements — Places of Interest
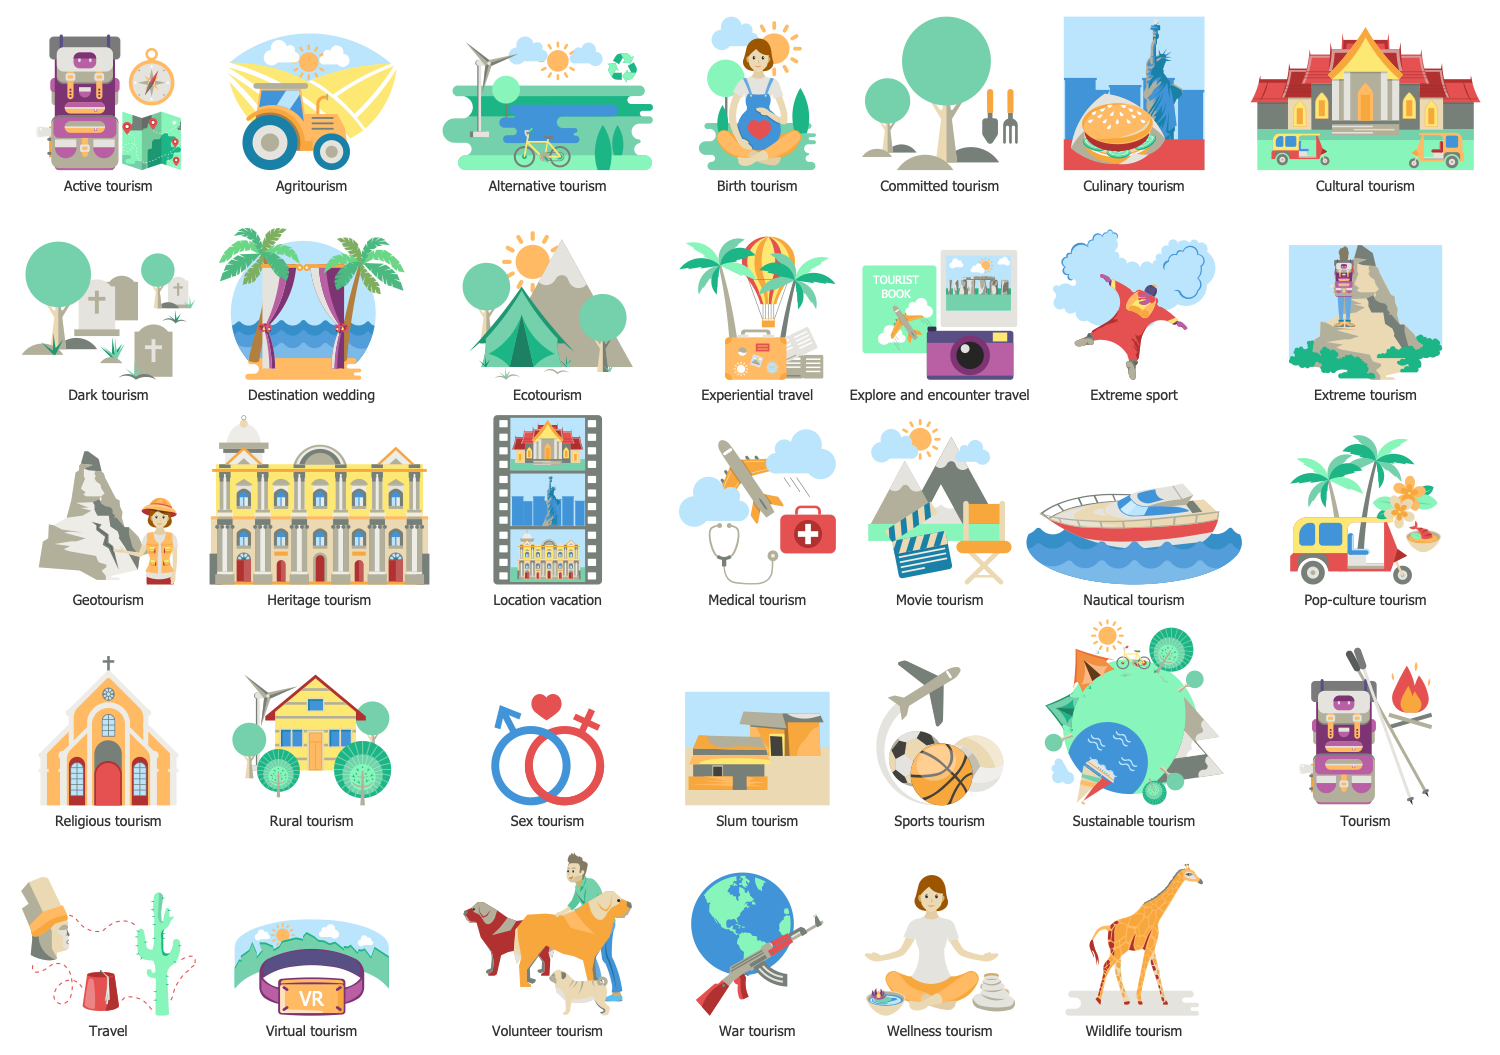
Design Elements — Tourism Types
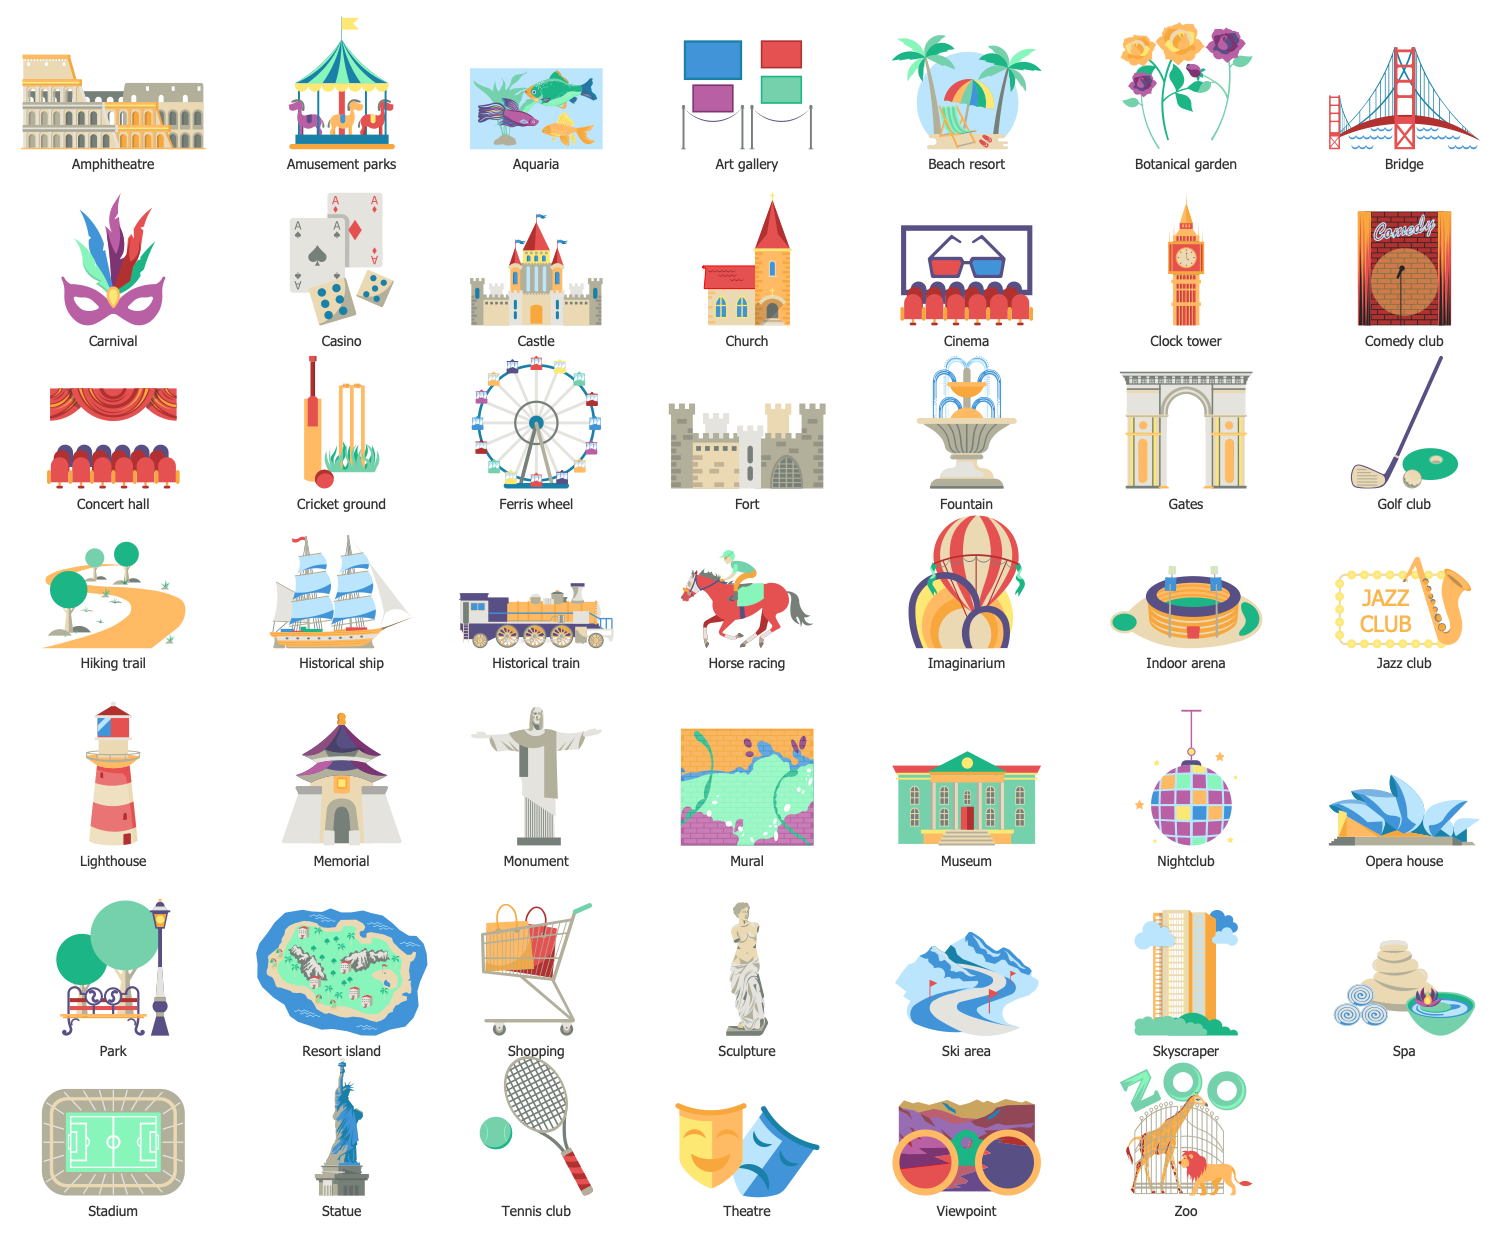
Design Elements — Tourist Attractions
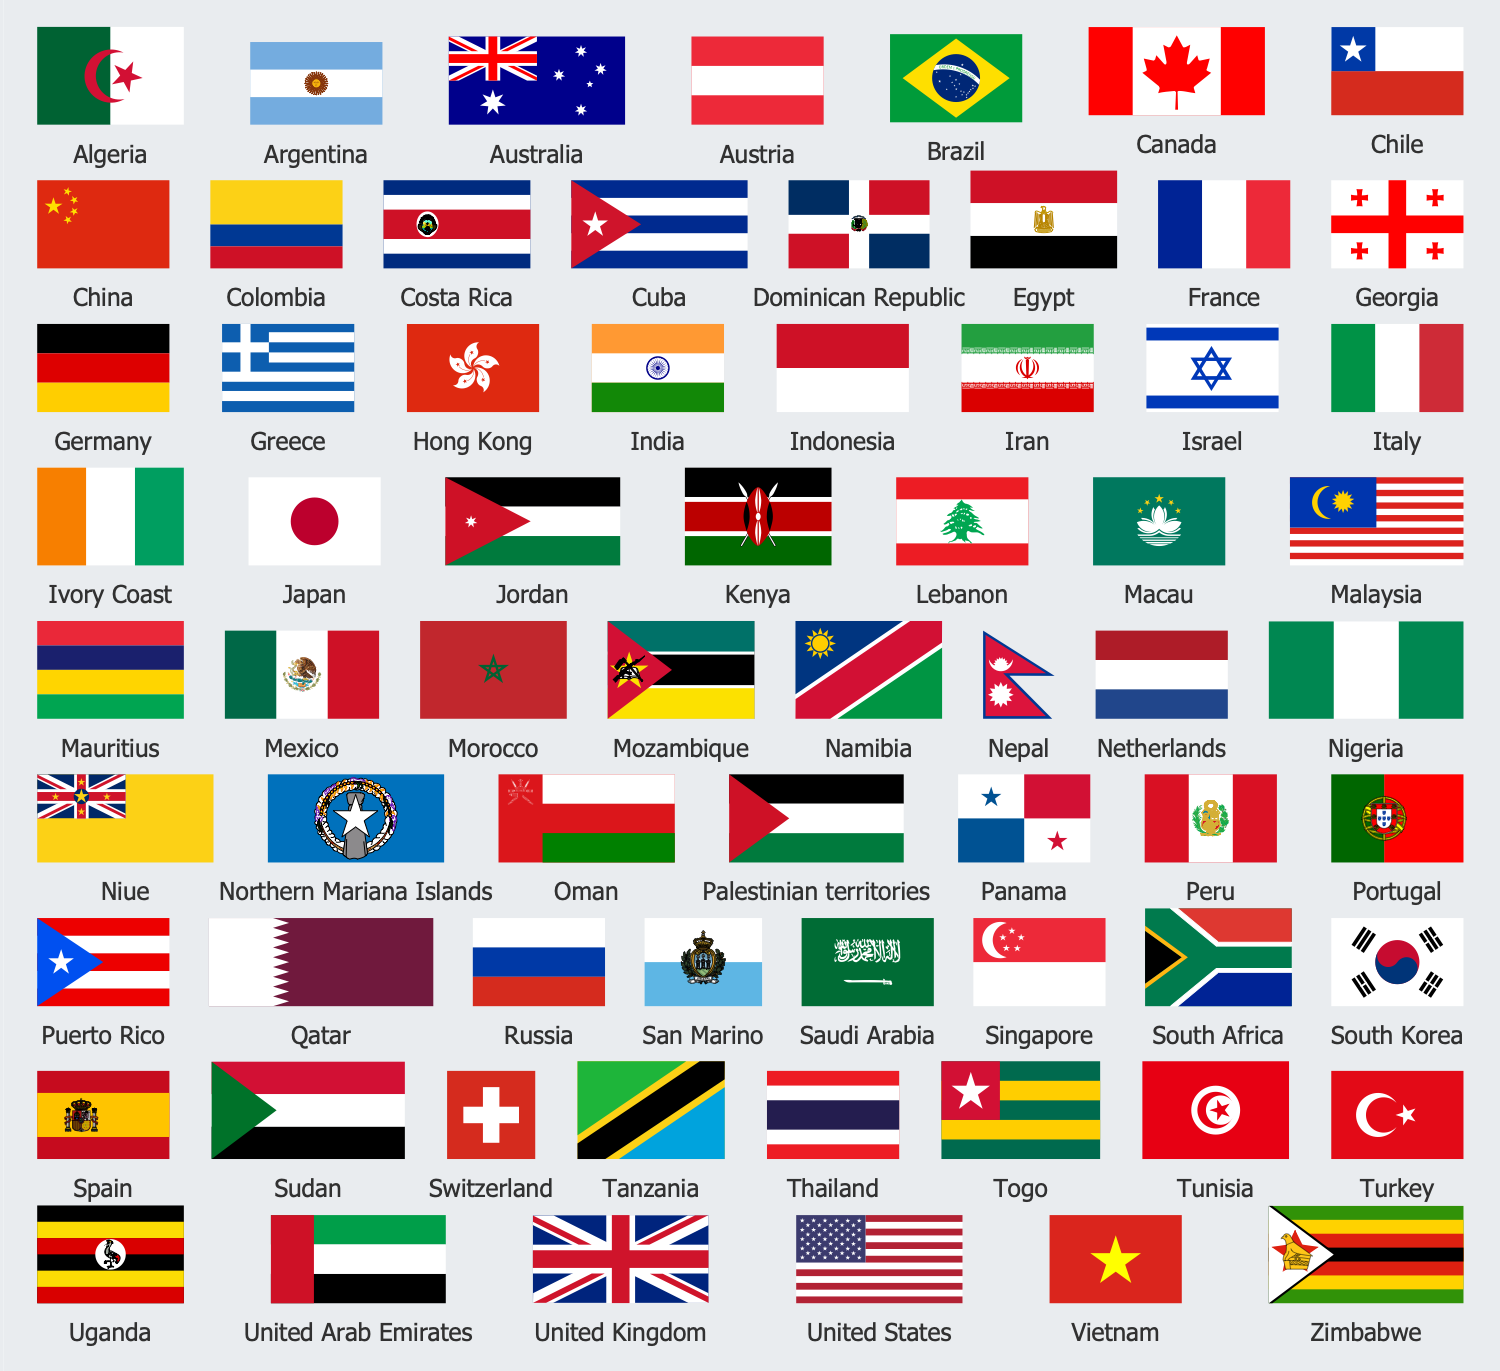
Design Elements — Tourist Country Flags
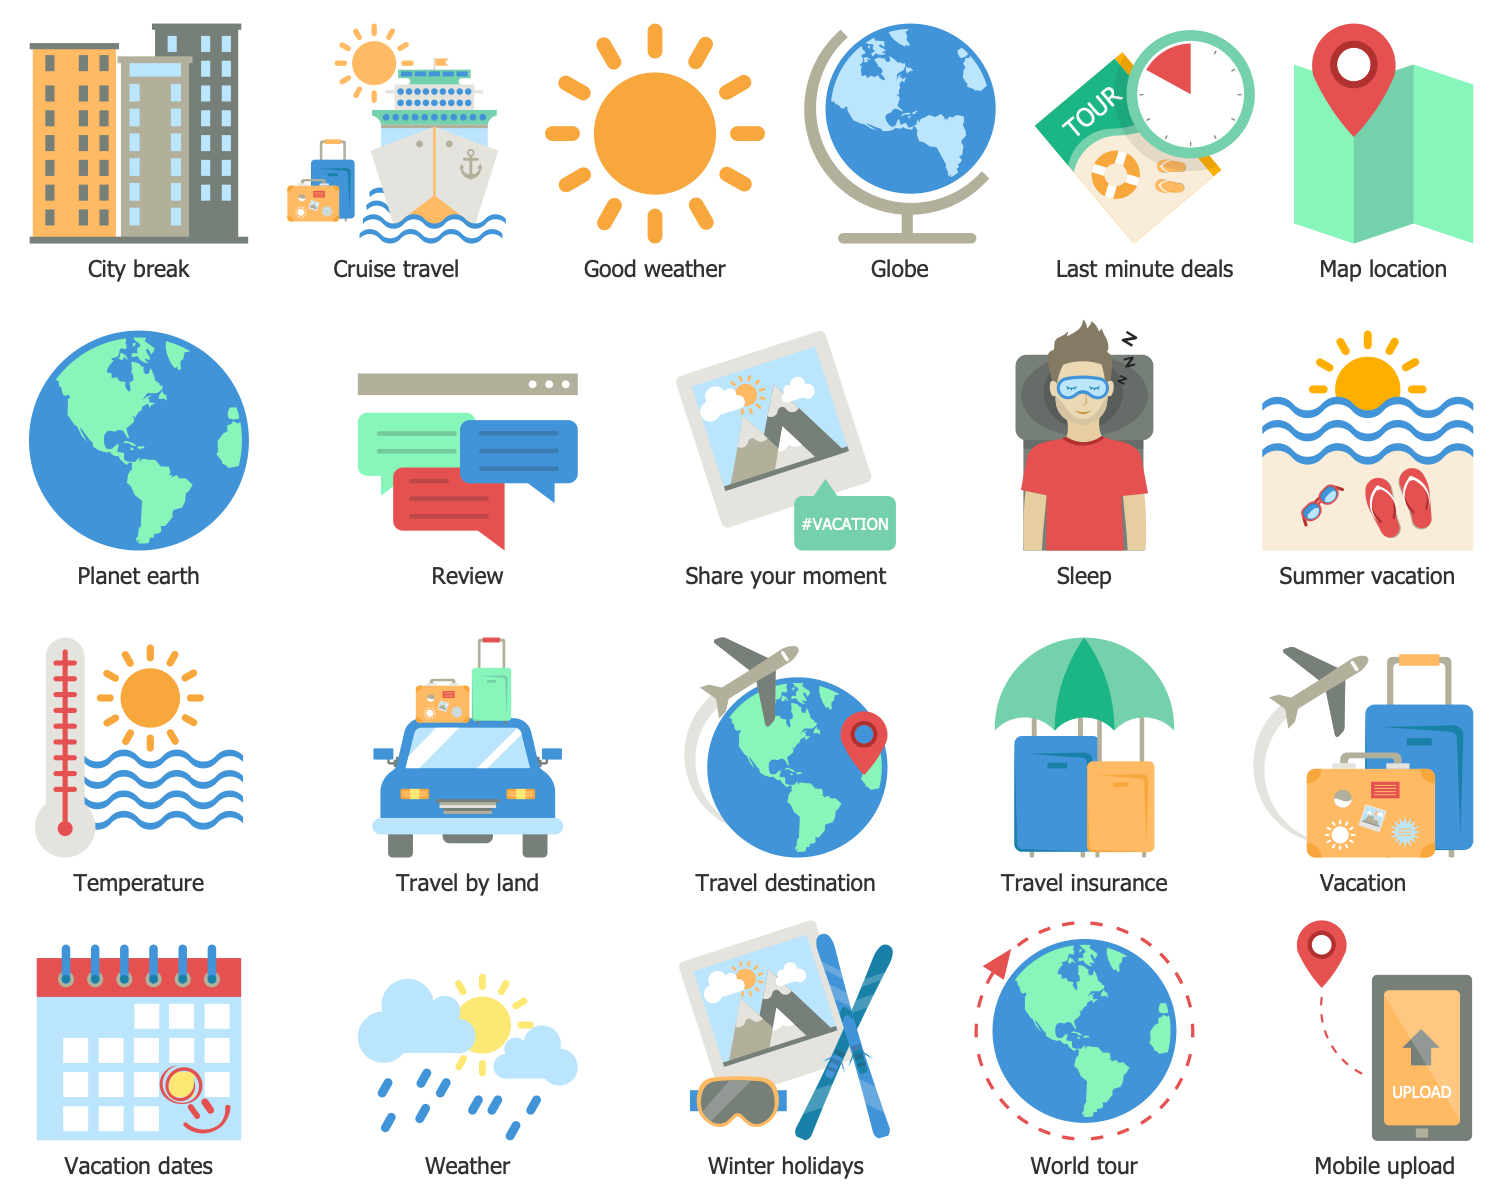
Design Elements — Travel
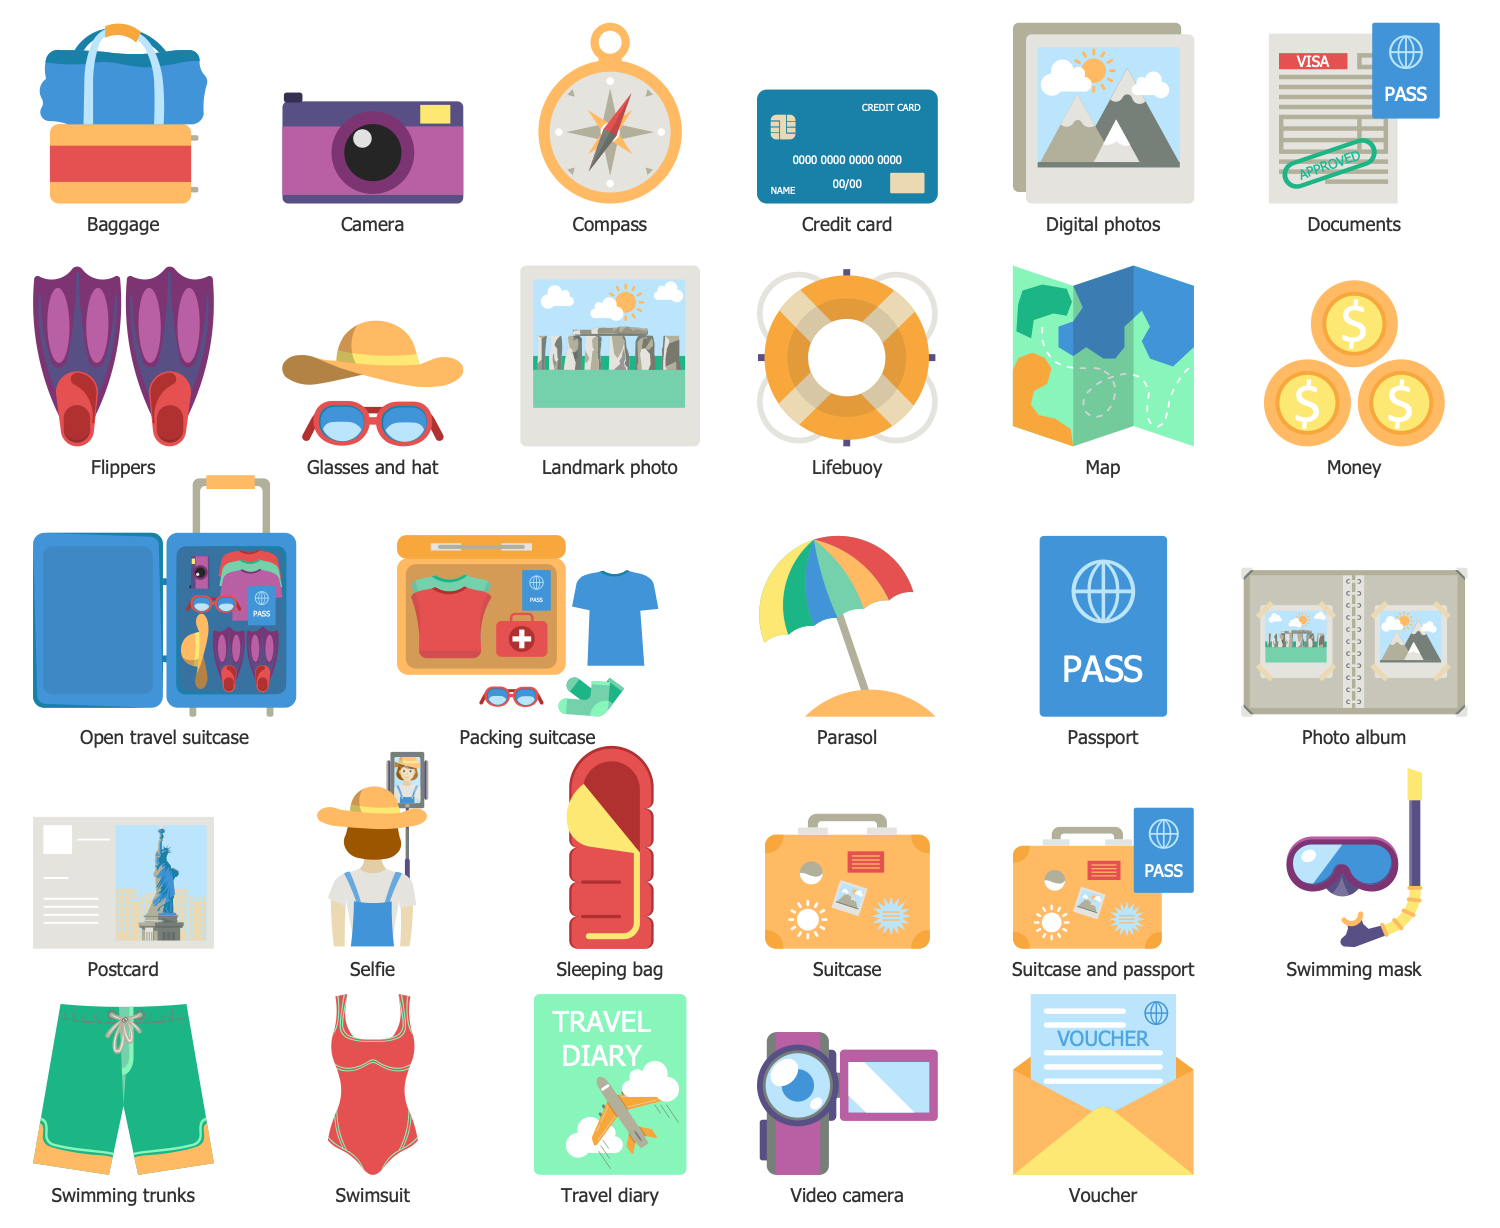
Design Elements — Travel Accessories
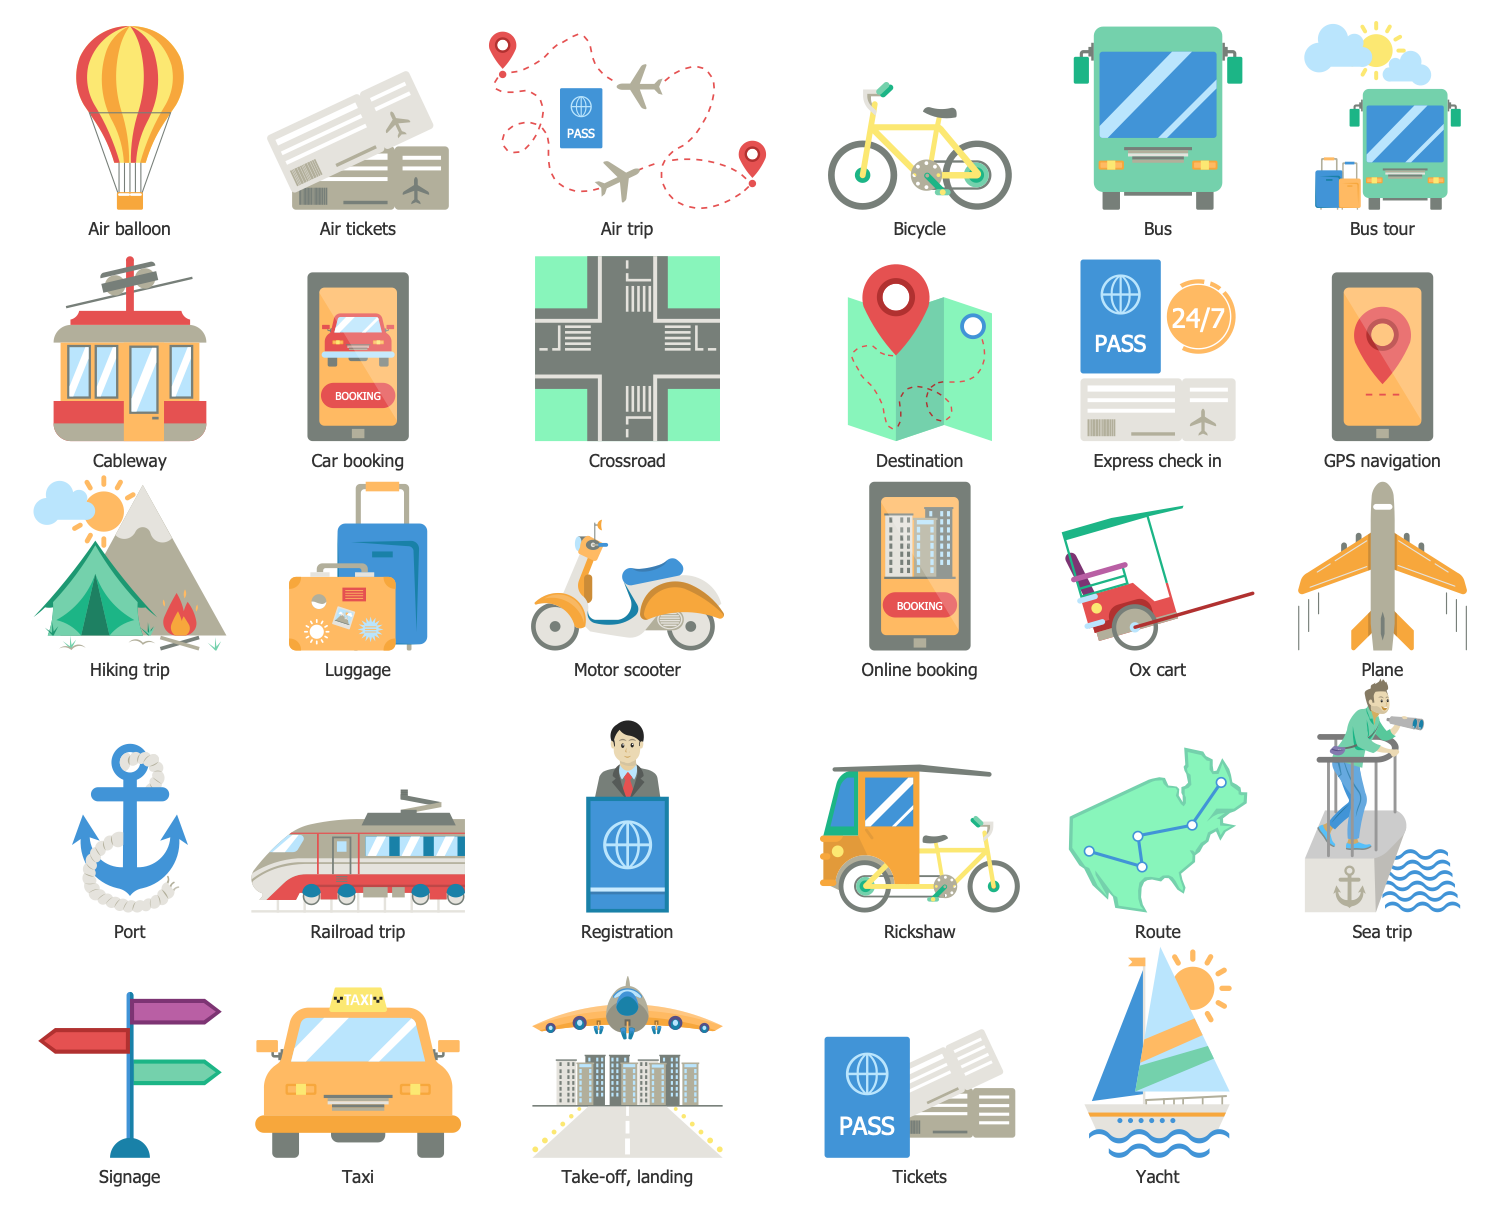
Design Elements — Travelers
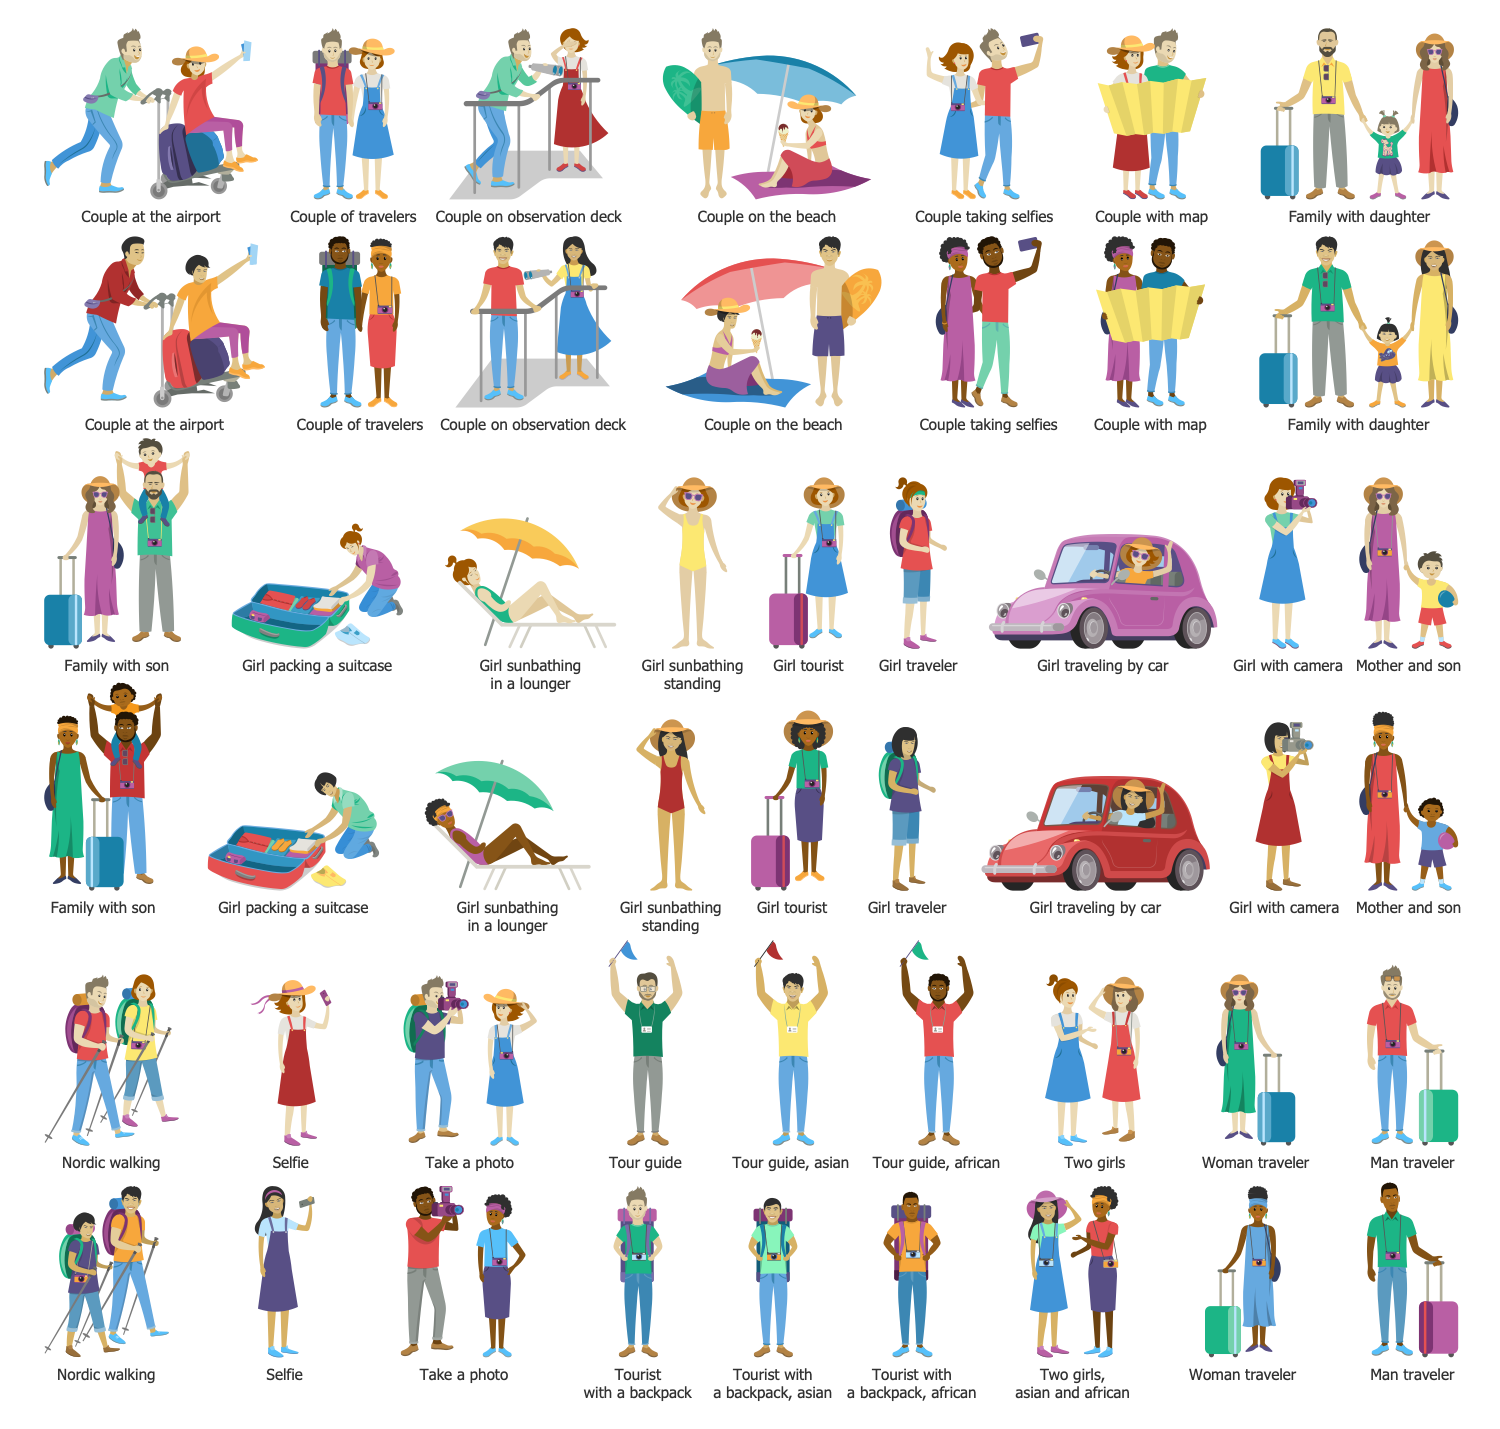
Design Elements — Travel Food
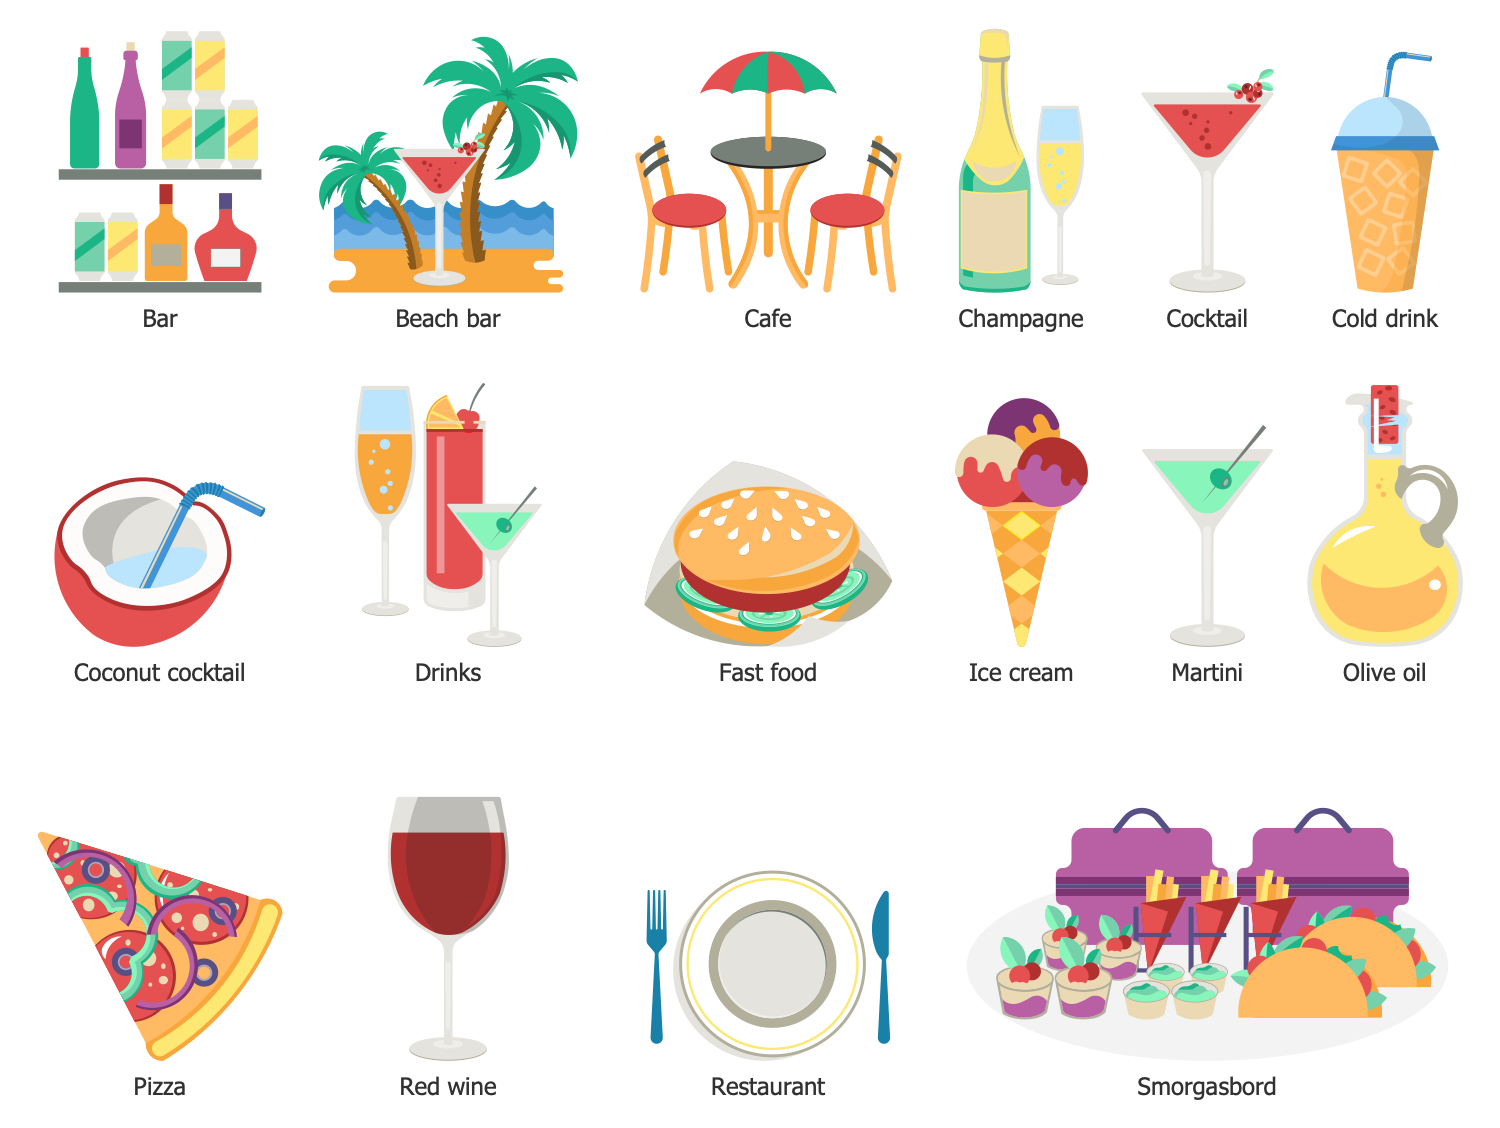
Design Elements — Trip
Travel Infographics Examples
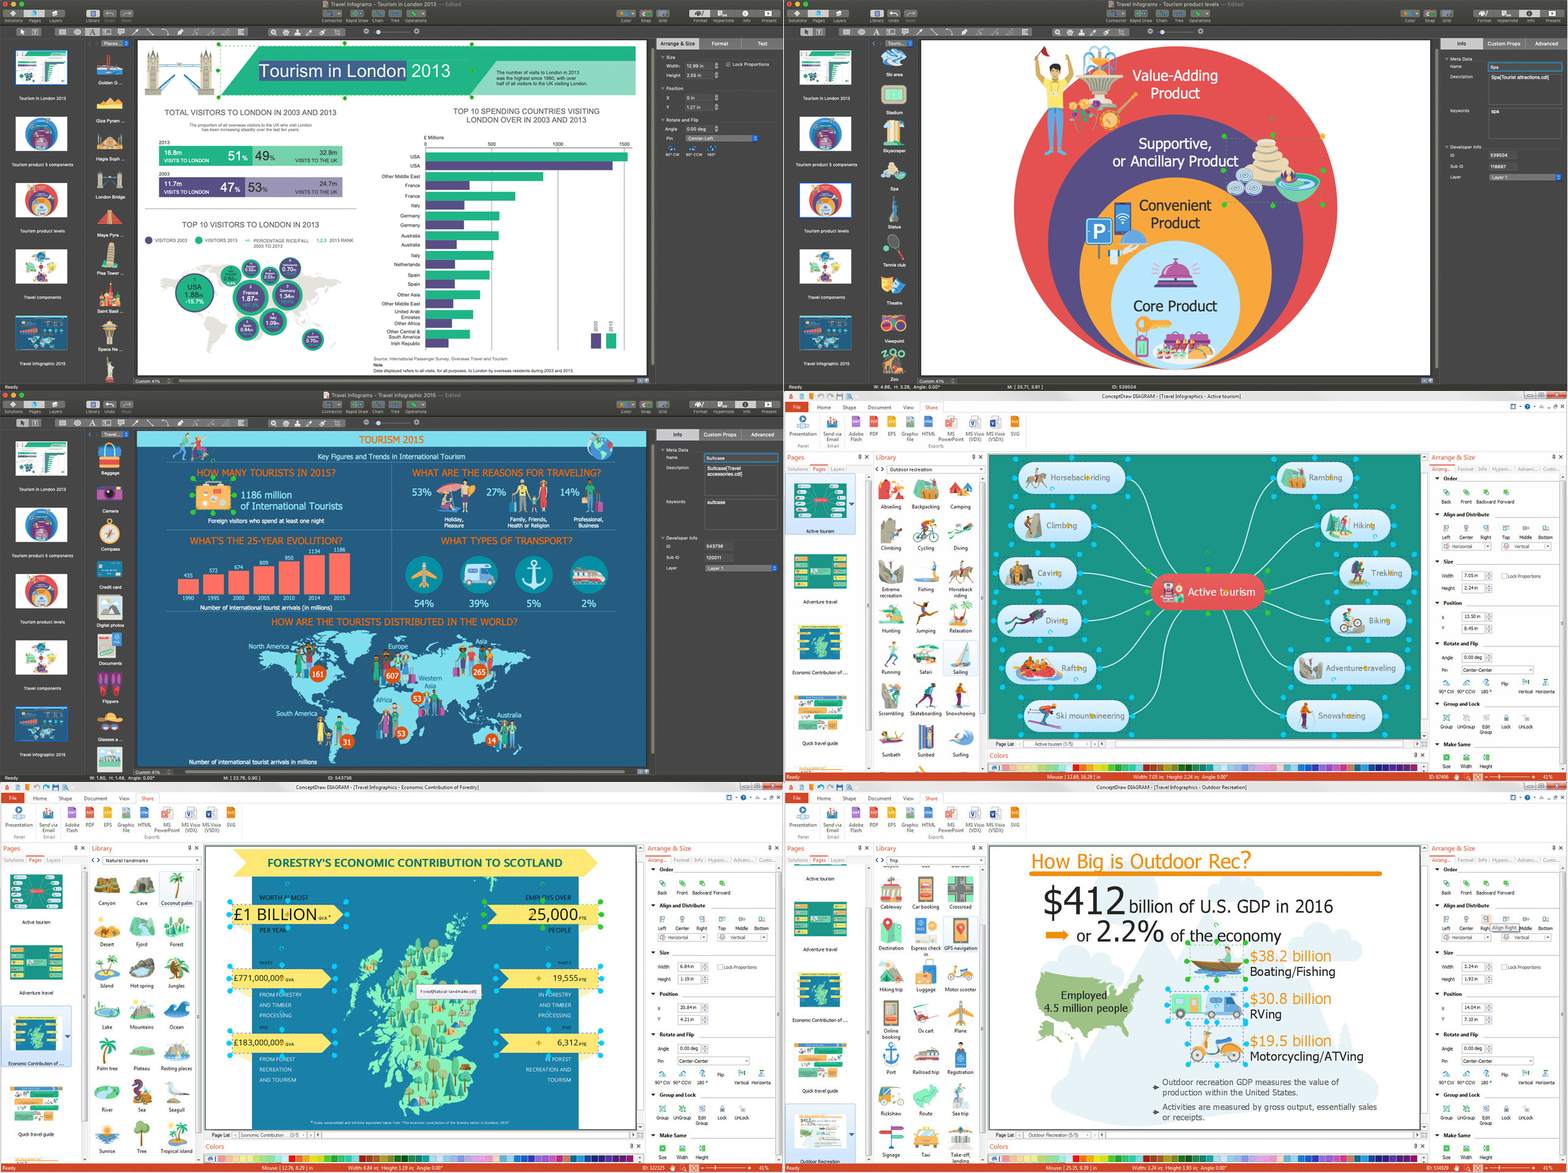
There are a few samples that you see on this page which were created in the ConceptDraw DIAGRAM application by using the Travel Infographics solution. Some of the solution's capabilities as well as the professional results which you can achieve are all demonstrated here on this page.
All source documents are vector graphic documents which are always available for modifying, reviewing and/or converting to many different formats, such as MS PowerPoint, PDF file, MS Visio, and many other graphic ones from the ConceptDraw Solution Park or ConceptDraw STORE. The Travel Infographics solution is available to all ConceptDraw DIAGRAM users to get installed and used while working in the ConceptDraw DIAGRAM diagramming and drawing software.
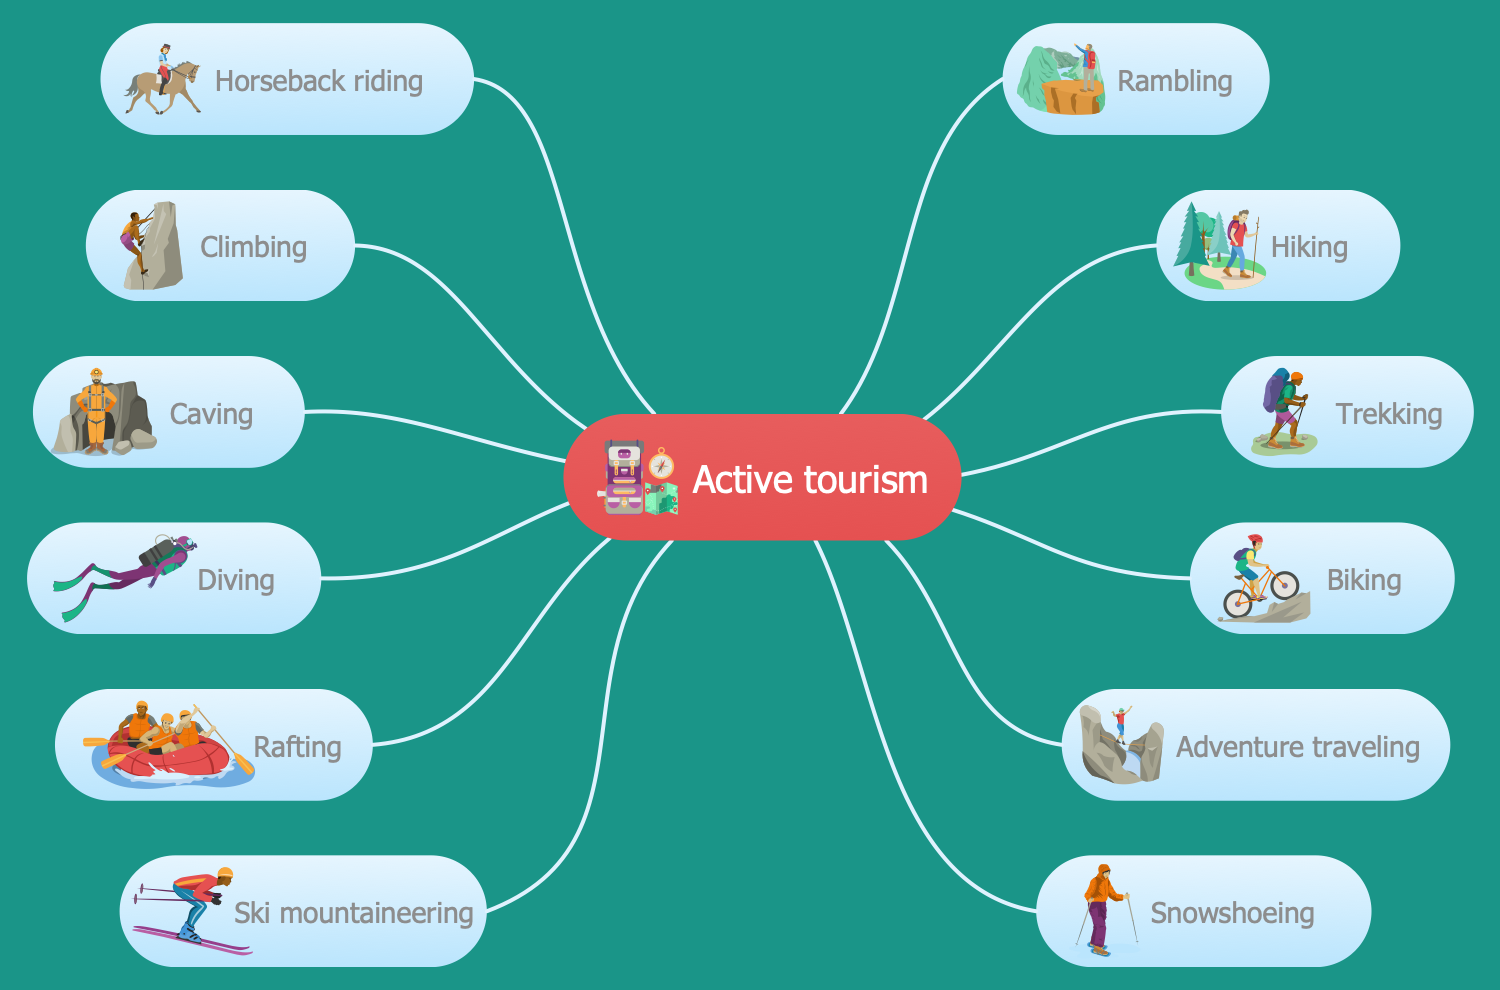
Example 1: Active Tourism
This diagram was created in ConceptDraw DIAGRAM using the combination of libraries from the Travel Infographics solution. An experienced user spent 5 minutes creating this sample.
This infographics sample is dedicated to active tourism and represents all variety of alternative tourism. It was designed in ConceptDraw DIAGRAM software in the form of a Mind Map with the “Active tourism” main topic and several branches surrounding it, which represent the following kinds of the active tourism: horseback riding, climbing, caving, diving, rafting, ski mountaineering, rambling, hiking, trekking, biking, adventure traveling, and snowshoeing. The alternative tourism is a fashionable modern term that appeared not so long ago but gains more popularity. At the moment it has already acquired a lot of fans and even was divided into several directions. Typically, it combines tourist products and tourist services that differ from traditional mass tourism and is its opposite. In most cases, the alternative tourism supposes the active tourism, it is developed according to the concepts and principles of the exploration or the committed tourism, introduces the travelers to the non-standard places and attractions, unique people and practices.
Example 2: Adventure Travel
This diagram was created in ConceptDraw DIAGRAM using the combination of libraries from the Travel Infographics solution. An experienced user spent 5 minutes creating this sample.
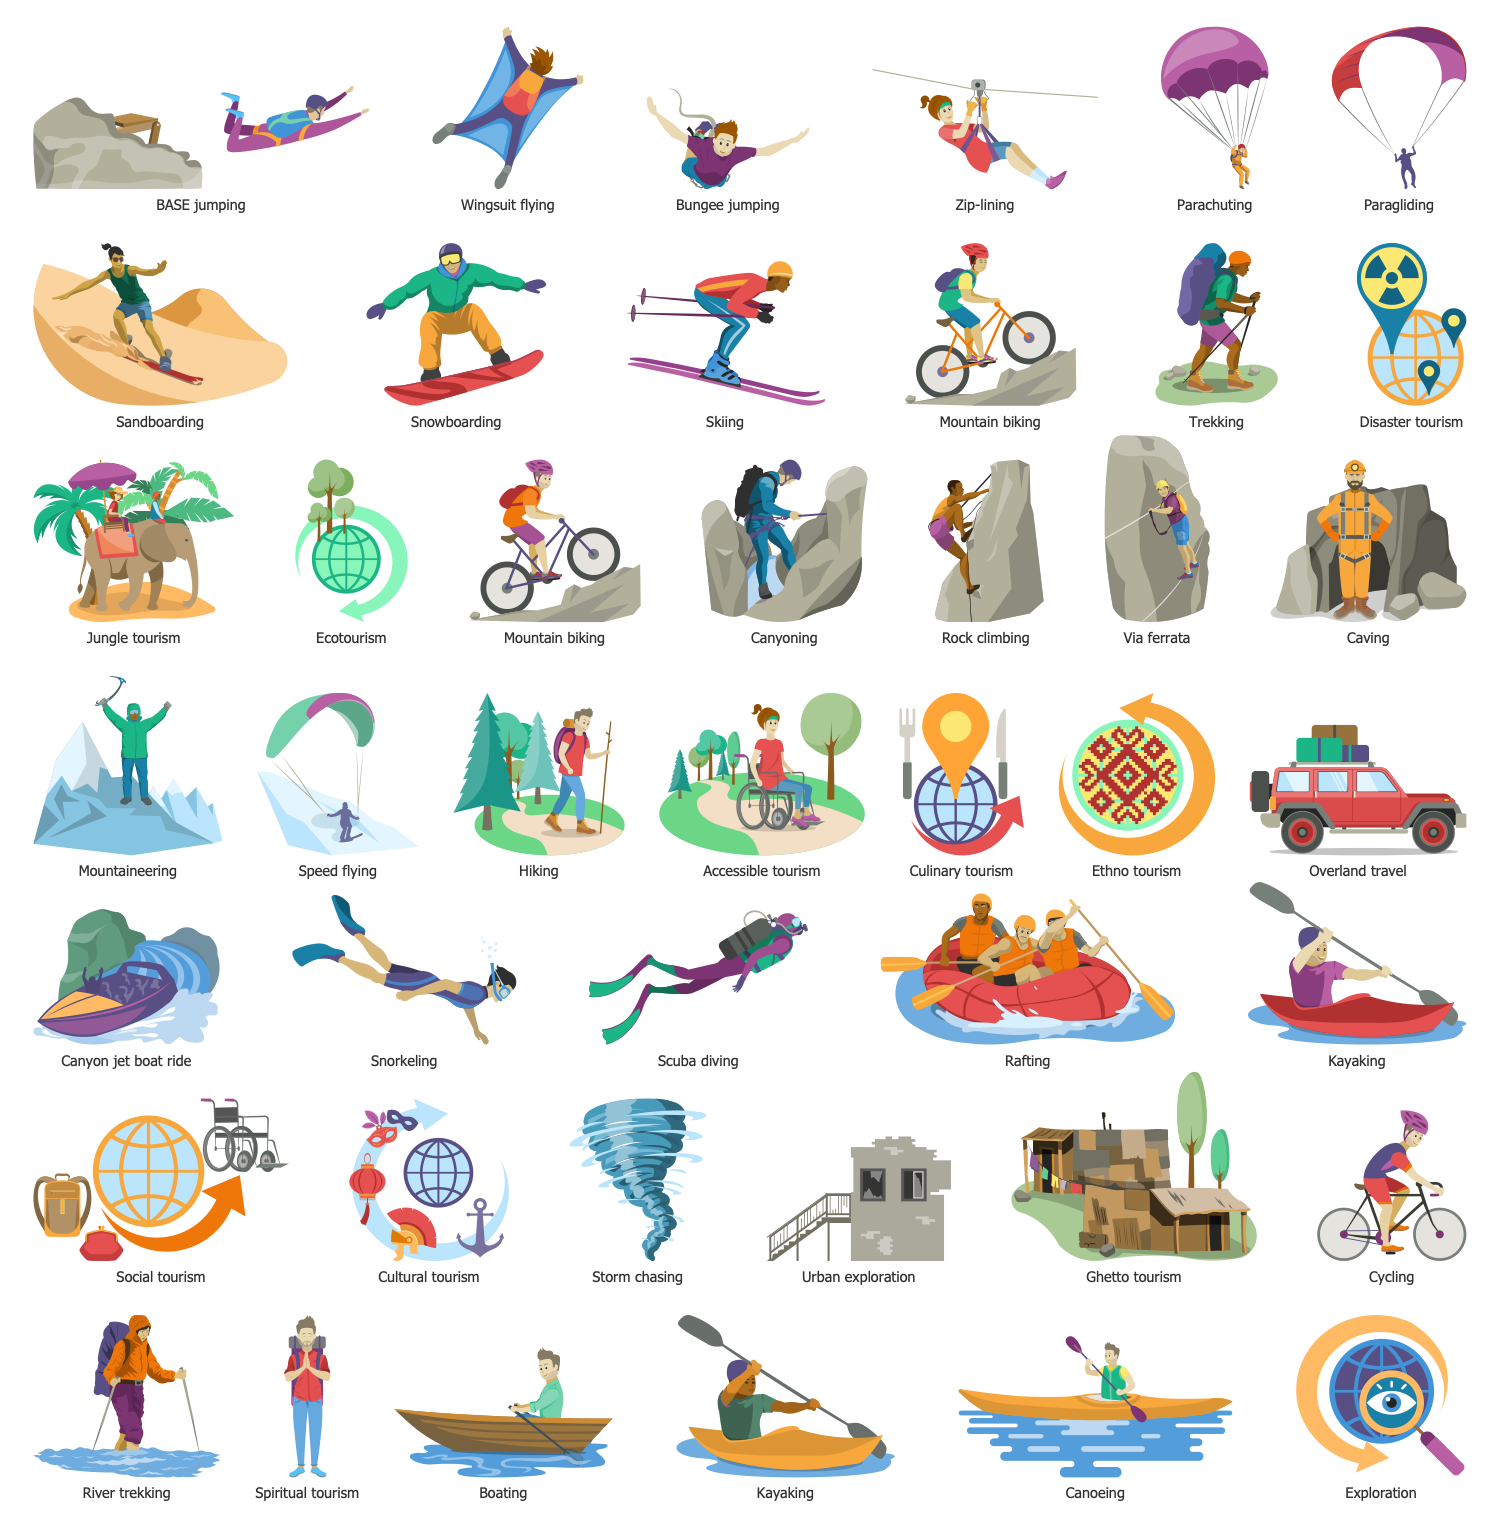
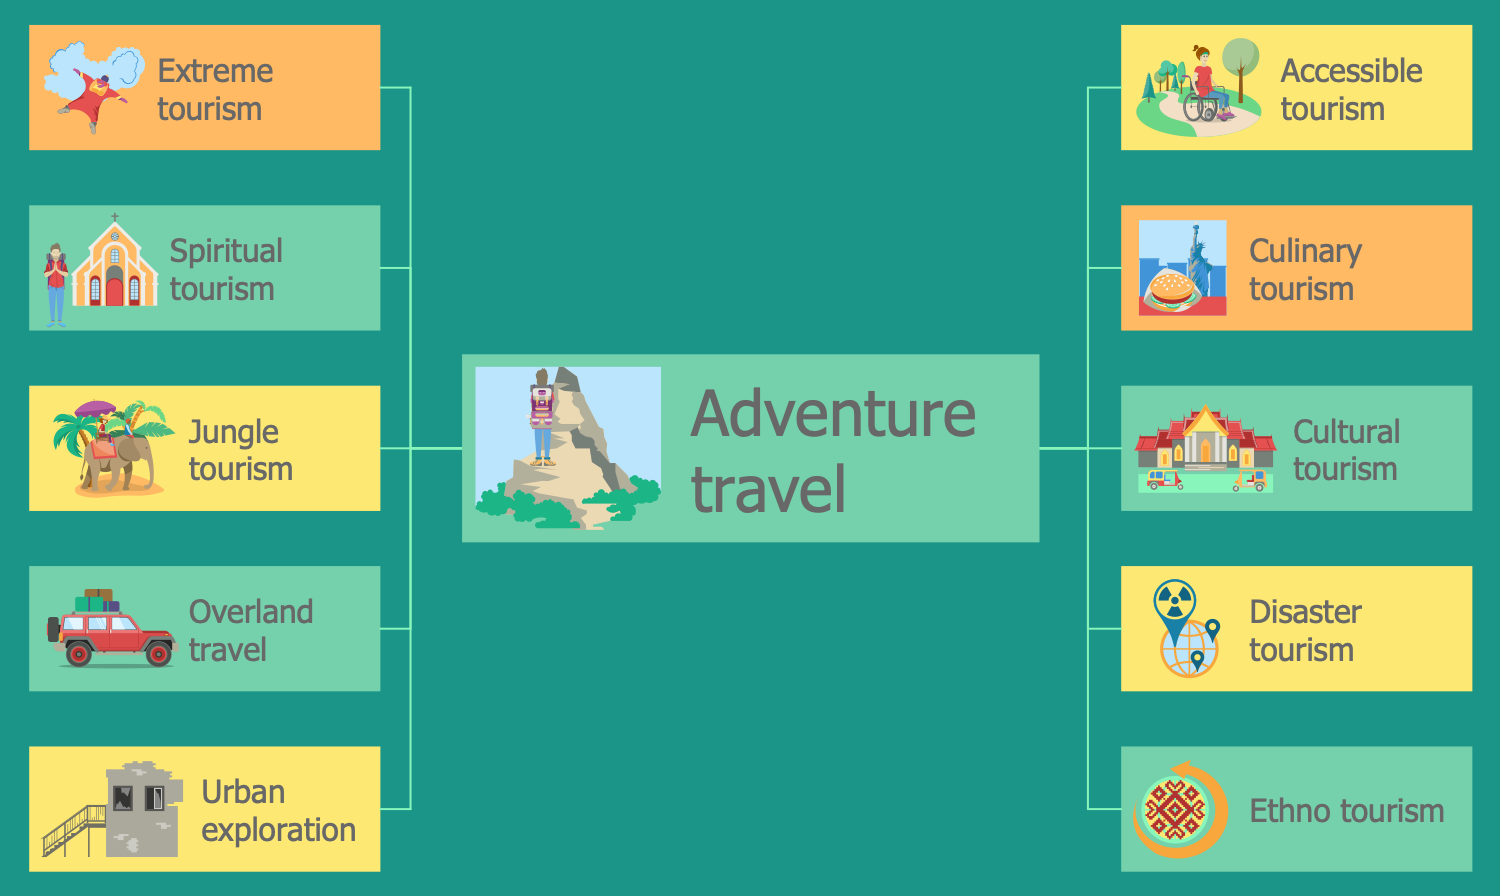
This sample represents the adventure travel that is a type of tourism associated with the organization of non-standard tours to exotic and environmentally clears natural areas. Typically, these are the group tours that suppose the unusual travel, unconventional vehicles, quite strong physical activity and have a high cost. This type of tourism includes extreme tourism, spiritual tourism, jungle tourism, overland travel, urban exploration, accessible tourism, culinary tourism, cultural tourism, disaster tourism, ethno tourism. The adventure tourism requires careful preparation on the part of both organizers and participants. It is always associated with a certain risk, so it is needed a serious approach to the organization of tourists' safety, presence of highly qualified instructors, creation of interesting adventure routes, the organization of camps and tourist equipment, obtaining appropriate licenses and allowances on hunting, fishing, exporting trophies, etc. The good physical fit, quick response, dexterity, and ability to make non-standard decisions are required from participants. The main purpose of organizers is to reduce the risk to a minimum and to make the tour the most interesting, exciting, and comfortable.
Example 3: Economic Contribution of Forestry
This diagram was created in ConceptDraw DIAGRAM using the combination of libraries from the Travel Infographics solution. An experienced user spent 15 minutes creating this sample.
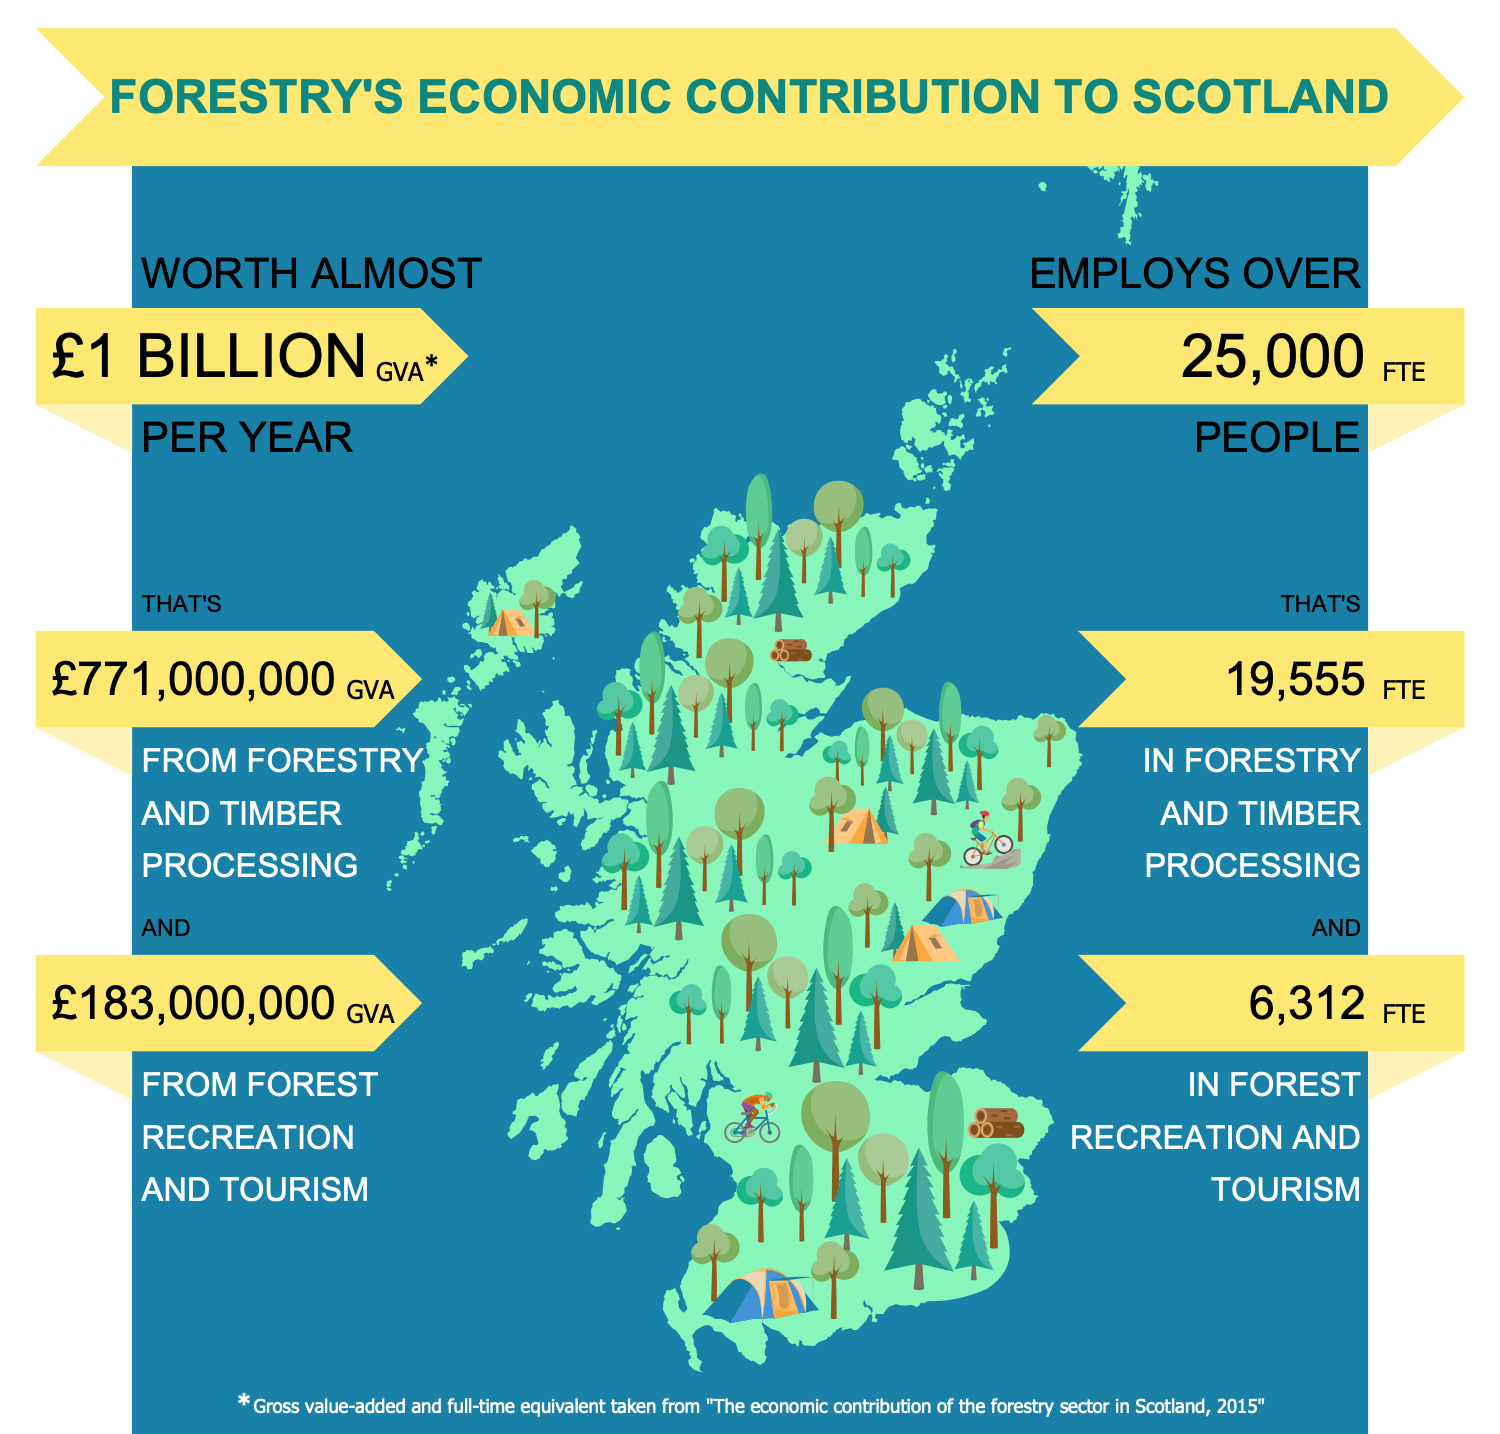
This infographic sample is dedicated to the forestry’s contribution to the economy of Scotland. The sample was designed on the base of the data and illustration from the official website of Scottish Forestry that is an organization established as an executive agency of the Scottish Government on 1 April 2019. This illustration reflects the data from the report on the economic value of the forestry sector in Scotland, in 2015. According to the report and this diagram, the Scottish forestry contributes nearly £1 billion GVA to Scotland's economy per year. The forestry's and timber processing economic contribution to Scotland is £771 million GVA, while the contribution of forest recreation and tourism is £183 million GVA. The employment levels are up and now there are more than 25,000 FTE people working in this sector, among them 19,555 FTE people in Scotland are employees of the forestry and timber processing, and the forest recreation and tourism employ 6,312 FTE people in Scotland. Using this sample as a travel infographics template, you can depict the key performance indicators in the tourism sector for other countries.
Example 4: Quick Travel Guide
This diagram was created in ConceptDraw DIAGRAM using the combination of libraries from the Travel Infographics solution. An experienced user spent 20 minutes creating this sample.
This sample represents the illustrated quick travel guide made in the form of an infographic. This guide is a brief instruction on one page. There are proposed five main points, which will make your trip easier and more comfortable. The first recommendation is to travel light and carry everything on your carry on; the extra luggage fees are very expensive. For more comfort, book a front seat in the airplane and your off airport parking in advance, this will significantly save your time. If you can, it is recommended to take the train, because it is the most precise kind of transport, choosing which you don't need to worry about the unexpected change of weather, cancellations or changing the time of flights, you don't need to come much in advance for check-in, to take care of the luggage weight or forbidden things in hand luggage, etc. And the last one, it is cheap to use the last minute deals.

Example 5: Outdoor Recreation
This diagram was created in ConceptDraw DIAGRAM using the combination of libraries from the Travel Infographics solution. An experienced user spent 15 minutes creating this sample.
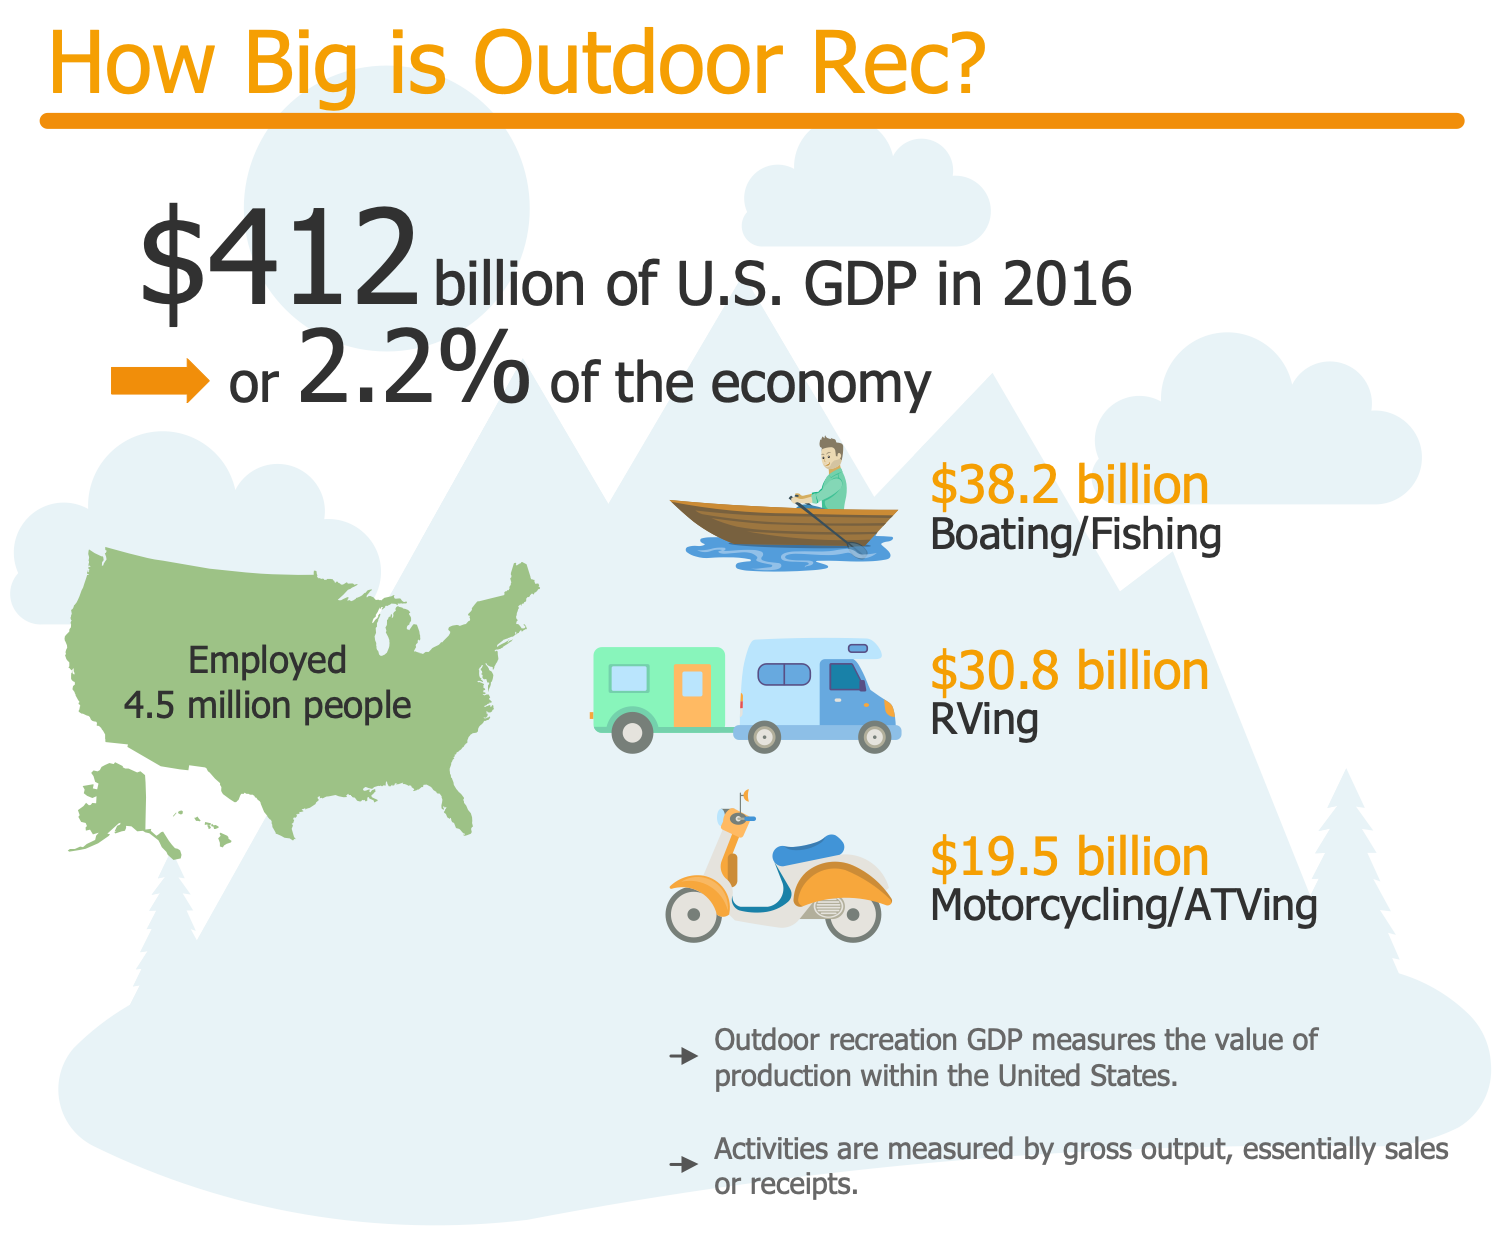
This infographic sample is based on the data from the website of the U.S. Bureau of Economic Analysis (BEA) and narrates how big outdoor recreation was in 2016. According to the published data, the outdoor recreation economy accounted $412 billion of U.S. GDP in 2016 or 2.2 % of the overall economy. You can also see that 4.5 million people were employed in outdoor recreation. It is generally accepted that the outdoor recreation activities comprise three categories: conventional core activities such as boating, fishing, bicycling, hiking, and hunting; supporting activities such as travel, tourism, local trips, construction, and government expenditures; and other core activities such as gardening and outdoor concerts. In the Outdoor Recreation Satellite Account in 2016, the great measure of receipts associated with the outdoor recreation economy was presented by the Boating/Fishing accounting $38.2 billion of the real gross output, RVing accounted $30.8 billion, and Motorcycling/ATVing activities accounted for $19.5 billion of the real gross output.
Example 6: Tourism in London 2013
This diagram was created in ConceptDraw DIAGRAM using the combination of libraries from the Travel Infographics solution. An experienced user spent 20 minutes creating this sample.
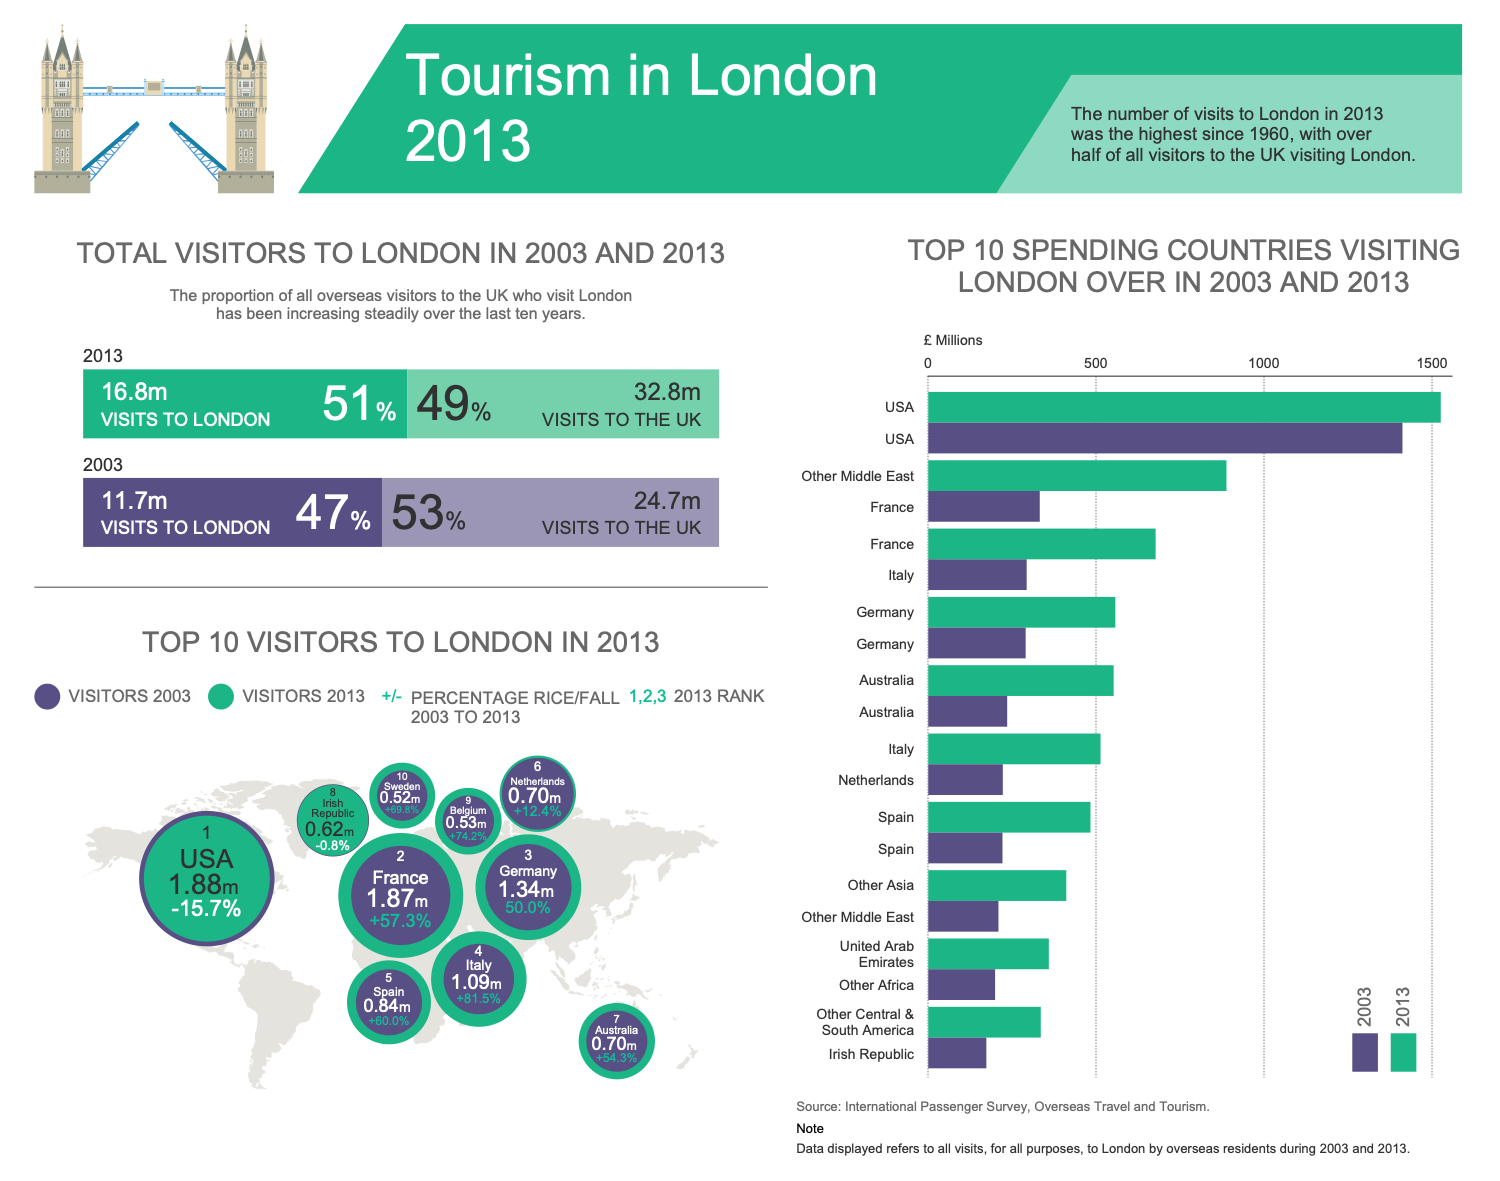
This infographics sample reflects the situation in a tourist sphere in London in 2013. The statistics shows that tourism in London in 2013 was very successful. Moreover, the number of visitors was the highest since 1960. It is also known that over half of all visitors to the UK visit London and the comparison of data showed that the quantity of London visitors steadily increased from year to year over the decade from 2003 to 2013. You can also see the summary charts with numbers of visitors by countries of residence and their percentage ratios. The data are presented as Top 10 for both 2003 and 2013, and are visually represented in the form of circles on the world map and in a form of a Bar Chart. The counted data include all residents visited London for any purposes. To display data for 2003, the purple color was used, while for 2013 was applied the green color. This visual distinction is convenient for correct and quick perception of the charts.
Example 7: Tourism Product 5 Components
This diagram was created in ConceptDraw DIAGRAM using the combination of libraries from the Travel Infographics solution. An experienced user spent 5 minutes creating this sample.
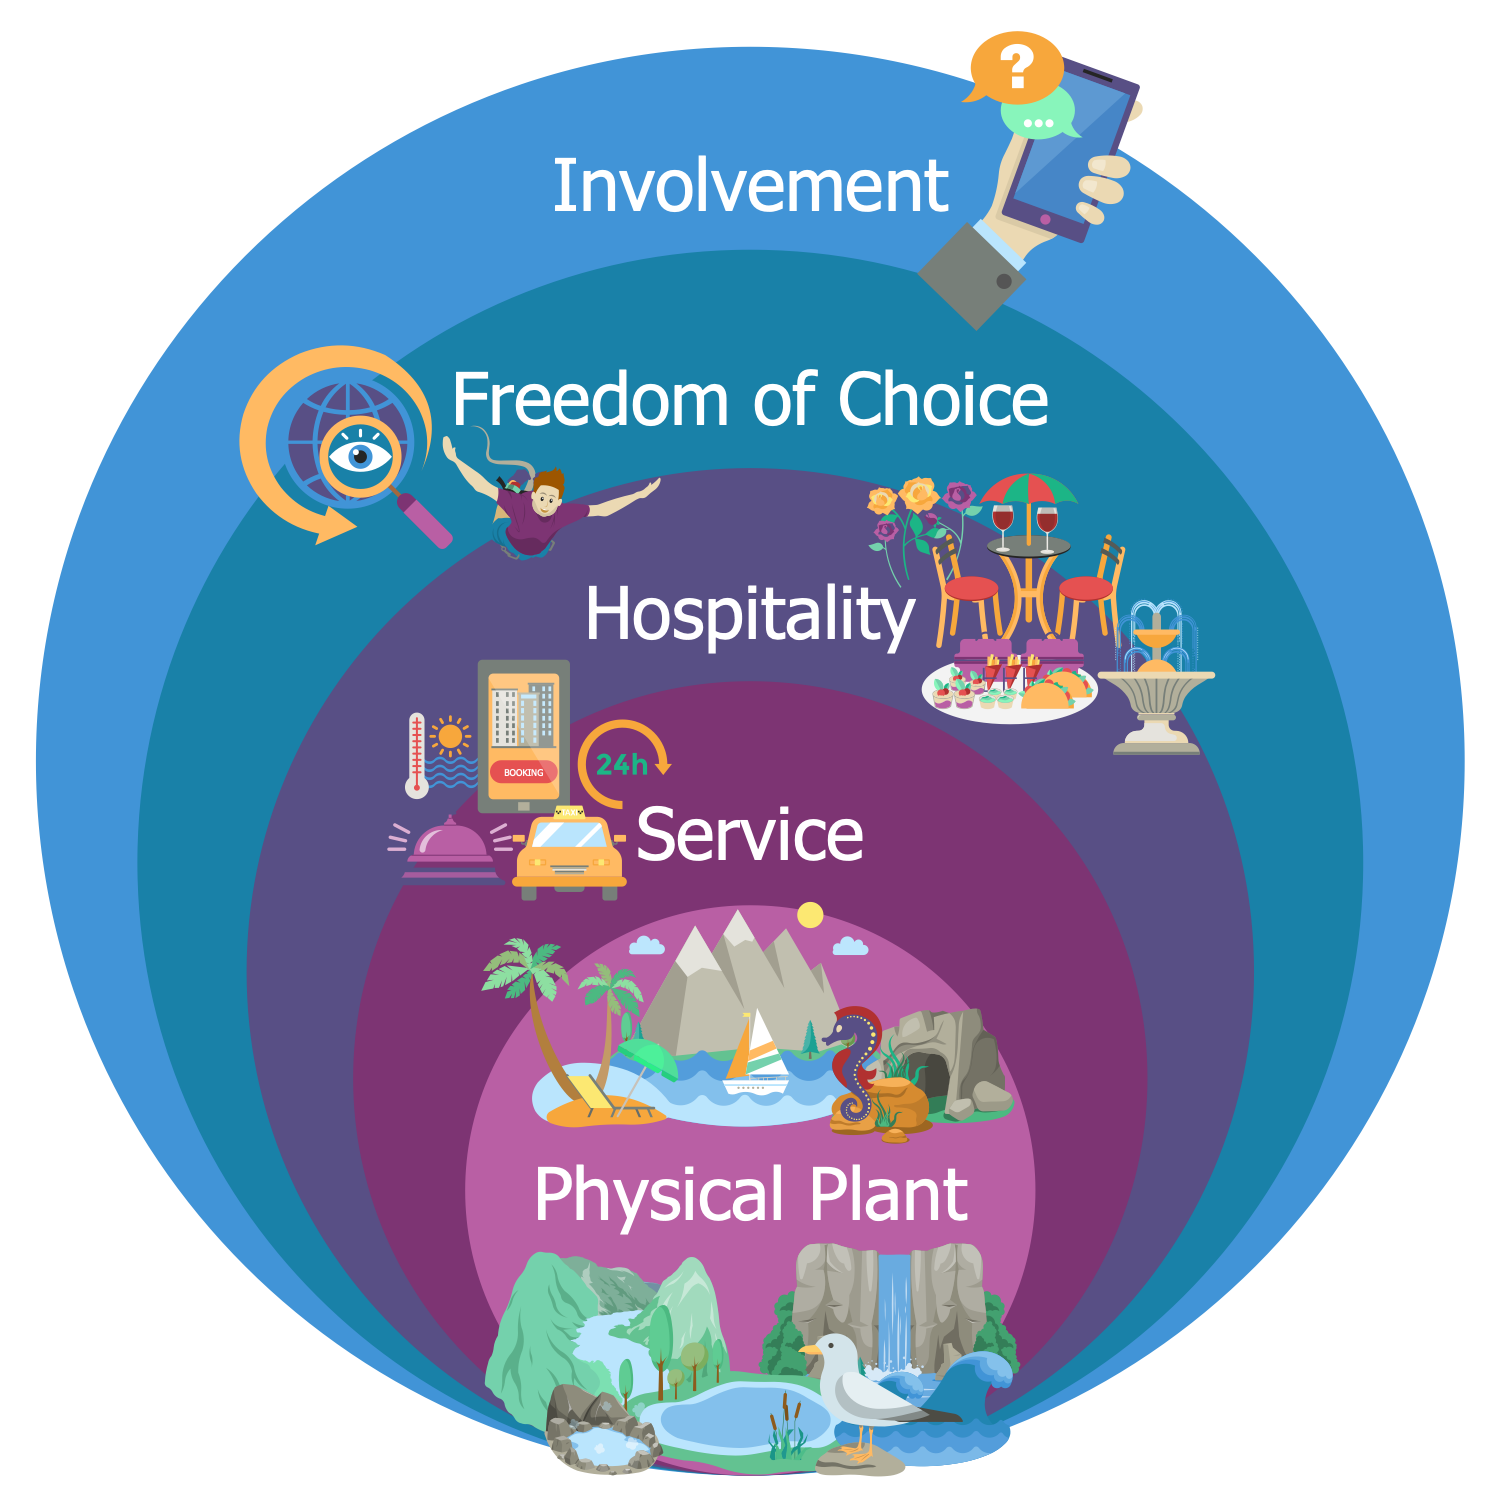
This sample represents the components of the tourism product. The main purpose of the tourist product is providing visitors with unique and inimitable emotions and impressions, showing them the sights, presenting the local culture and customs, at this all information need to be presented for tourists at the most interesting way. Five main components composing a good tourist product are presented on this diagram, these are the physical plant that represents the material objects, live nature objects, and resorts; the service, which assumes various infrastructure for tourists, helps to satisfy their needs and desires; the hospitality that supposes the readiness to provide visitors with the best service and comfort, and that is represented by various material and non-material factors including the physical environment, atmosphere, behavior and relation; the freedom of choice, which means that a tourist has several options and can choose the best one that suits his needs, desires, expectations, and budget; and finally it is involvement, which means that the visitors are involved in certain outsourcing services.
Example 8: Tourism Product Levels
This diagram was created in ConceptDraw DIAGRAM using the combination of libraries from the Travel Infographics solution. An experienced user spent 5 minutes creating this sample.
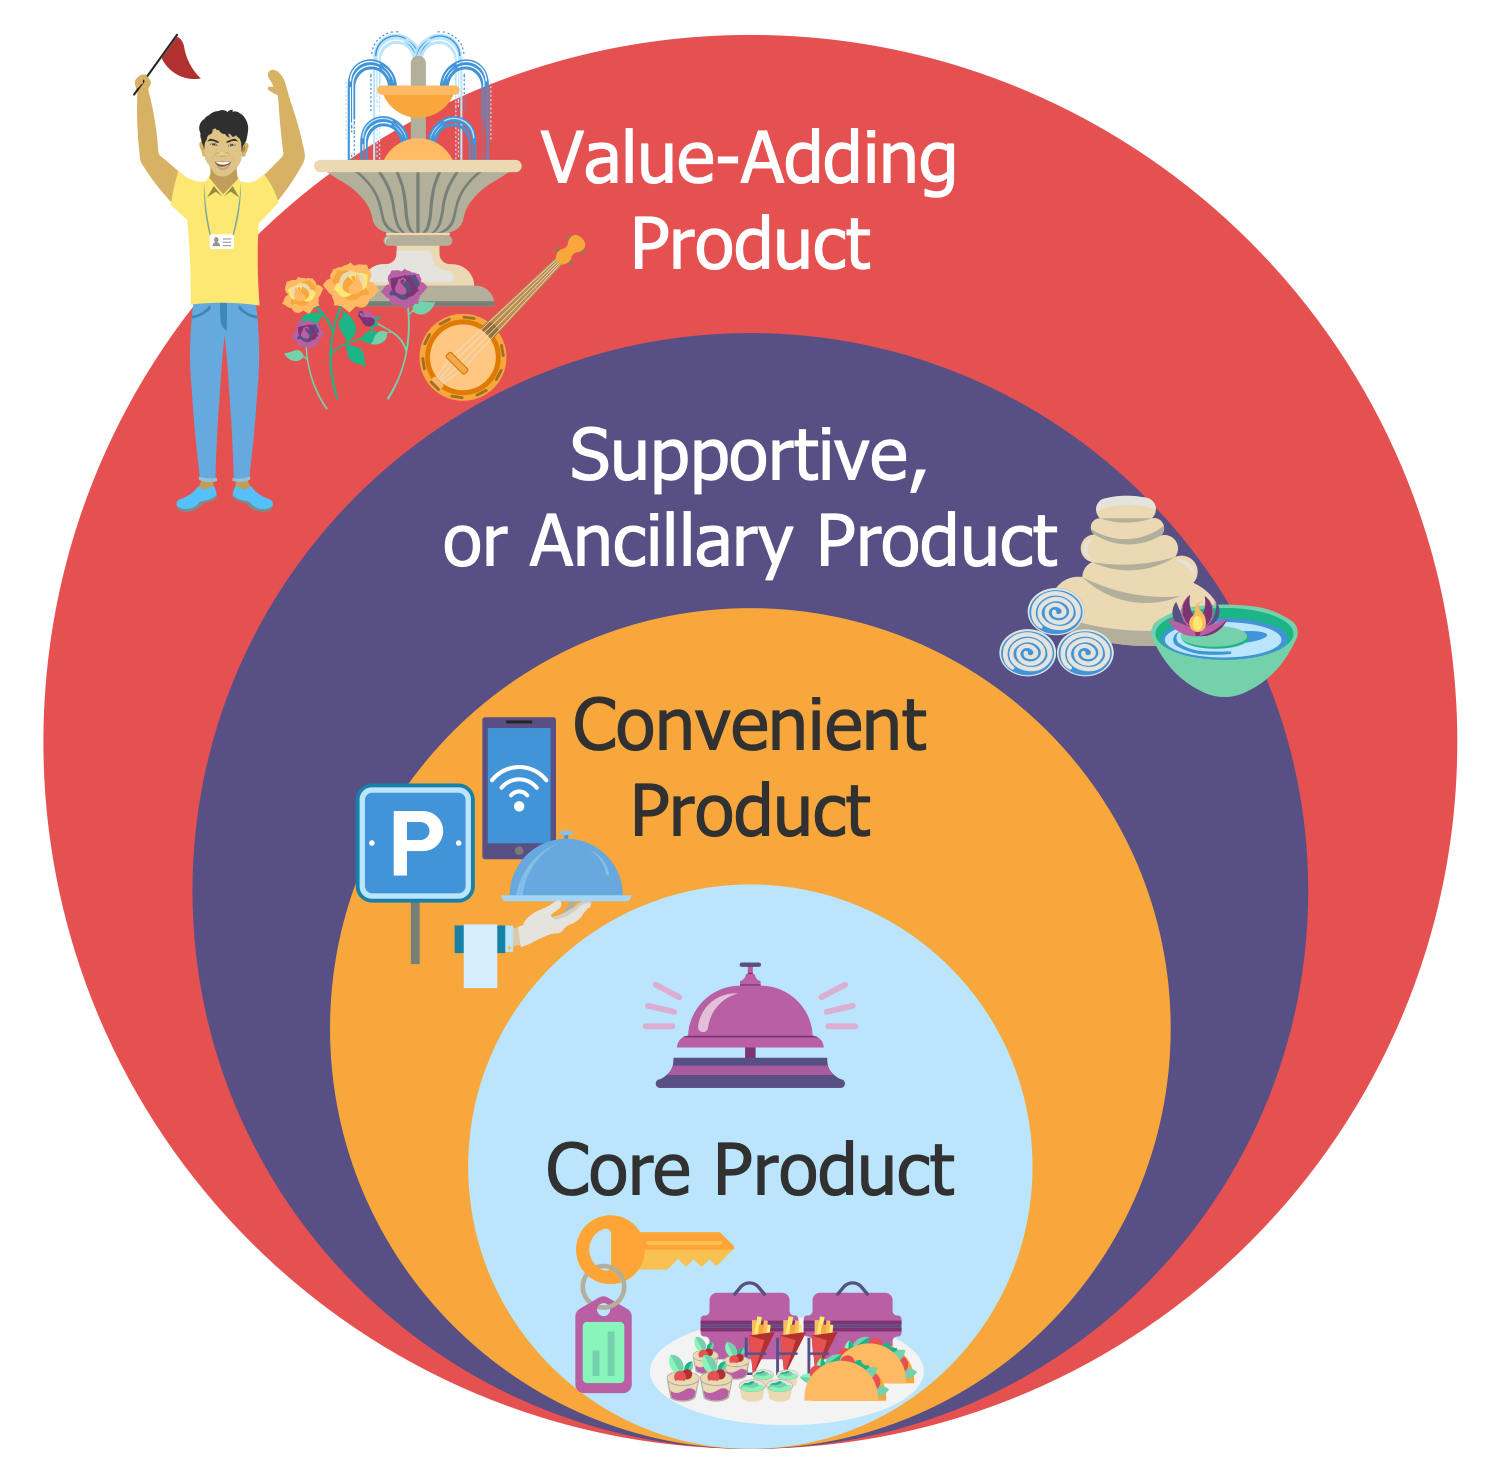
This sample illustrates the main levels that the tourism product passes in its development. There are represented four levels: core product, convenient product, supportive or ancillary product, and value-adding product. The core product lies at the basis, it is the main product that is designed for defined target groups with the basic needs. The convenient product is a product or service without which the main product can't be used. Then you can see the supportive or ancillary product, which adds to the main product the features that will beneficially distinguish it from the competitors. Finally, is represented the value-adding product that includes all the products and services that make the product more attractive, these are the high-level service, culture, hospitality, etc. This diagram is presented as circles nested one into another, beginning from the core one. Being bright through the use of eye-catching colors, this diagram is additionally decorated with vivid clipart, which makes it even more memorable.
Example 9: Travel Components
This diagram was created in ConceptDraw DIAGRAM using the combination of libraries from the Travel Infographics solution. An experienced user spent 5 minutes creating this sample.
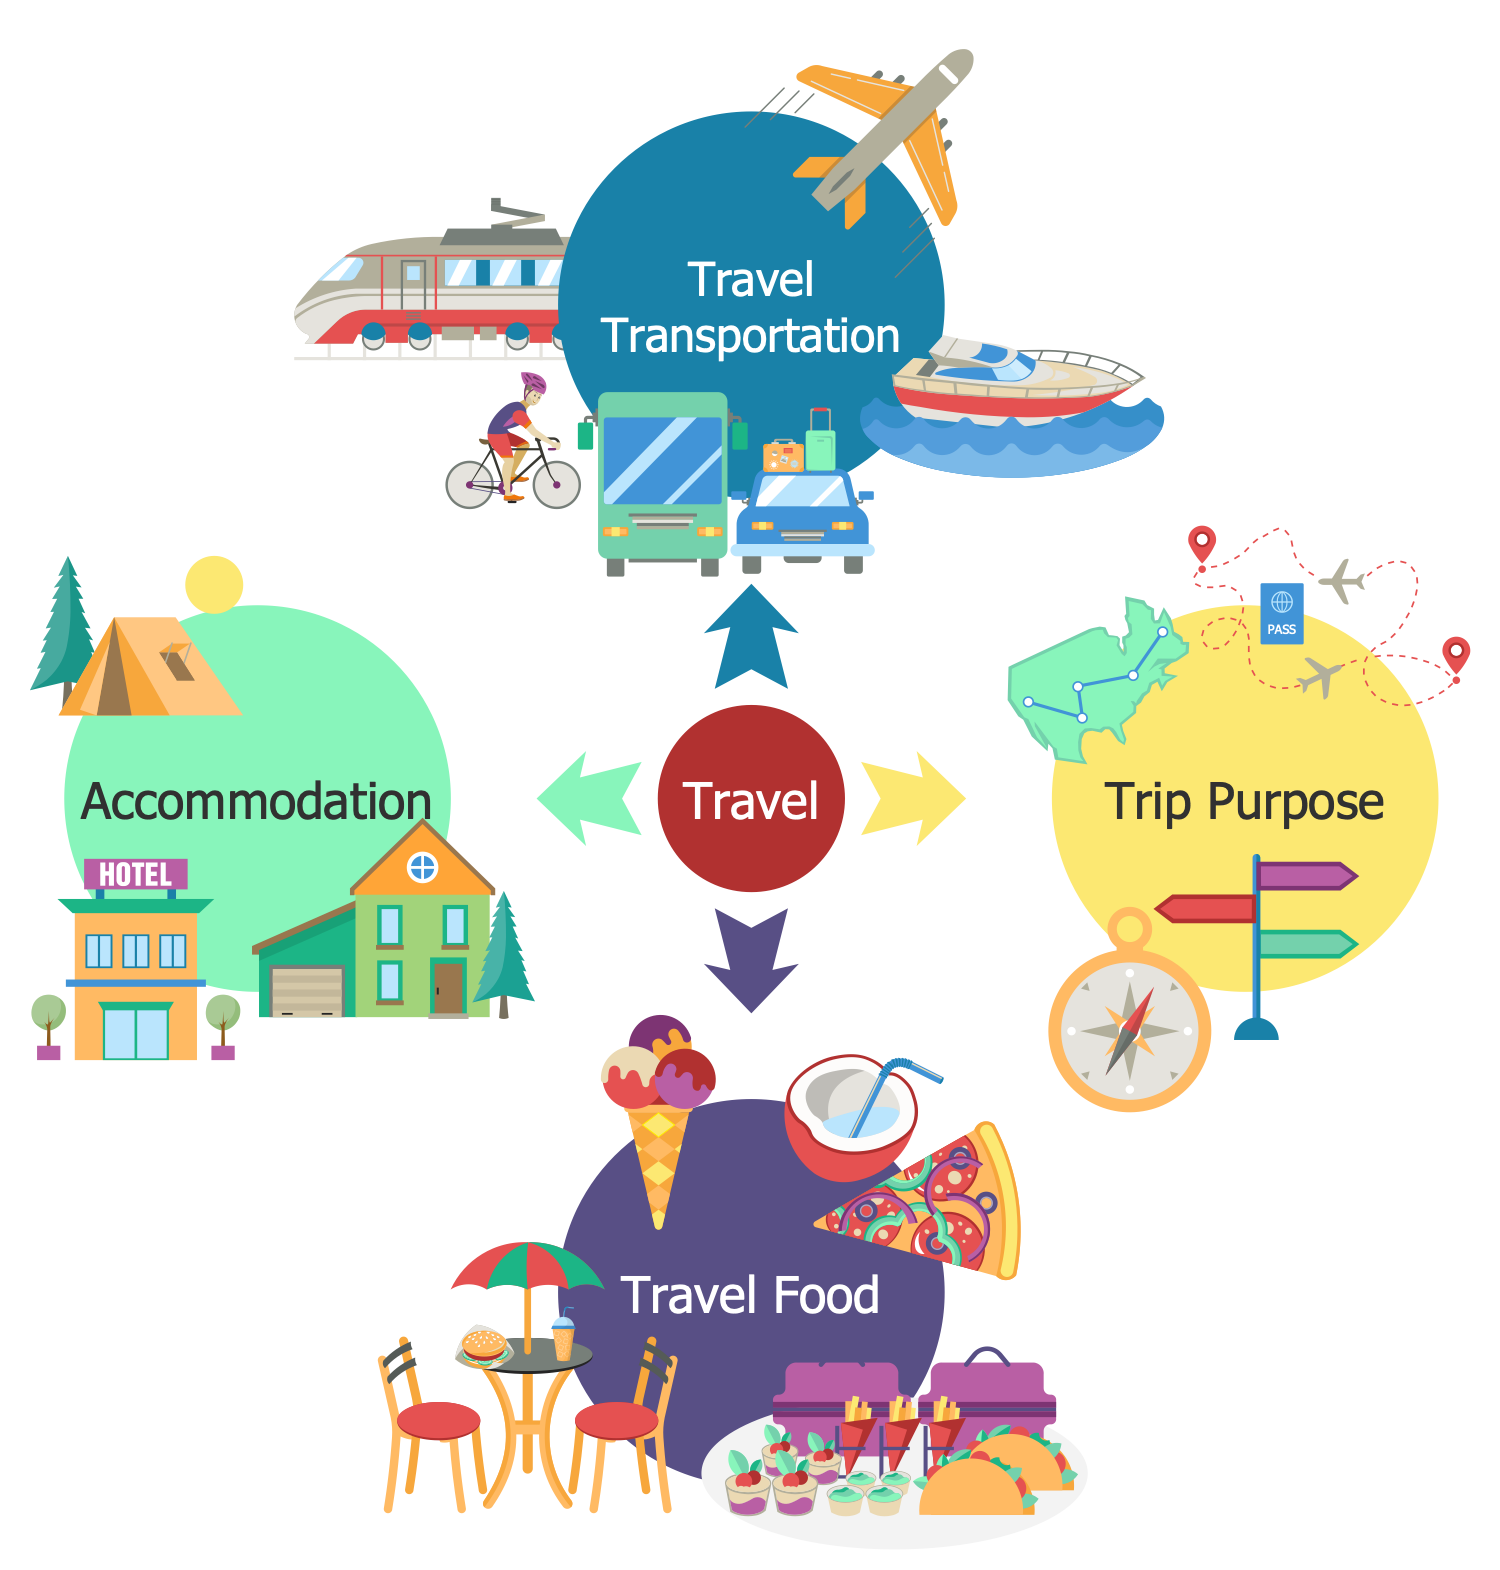
This sample represents the main travel product components. The travel product is a comprehensive complex set of the great number of services that are offered and sold to tourists, but the main components included to it are: the trip purpose (rest or work), travel transportation, accommodation, and travel food. The natural conditions, favorable environment, attractions, high-quality infrastructure and qualified tourism workers who provide these services, create comfortable conditions, propose interesting ideas and develop exciting tourist routes are equally important for the creation of an ideal tourist product. Only the correct combination of these basic components, good service, and infrastructure that meet the needs and expectations of travelers can make their rest and travel complete and unforgettable. Traveling is always associated with positive emotions, that's why the infographics and illustrations on the travel thematics are desired to be bright, colorful, positive and attractive. The best Travel Infographics solution from the ConceptDraw Solution Park provides you with a huge number of ready-made travel infographic vector objects, clipart objects, and travel infographics icons allowing to make your travel infographics exactly like this.
Example 10: Travel Infographic 2015
This diagram was created in ConceptDraw DIAGRAM using the combination of libraries from the Travel Infographics solution. An experienced user spent 30 minutes creating this sample.
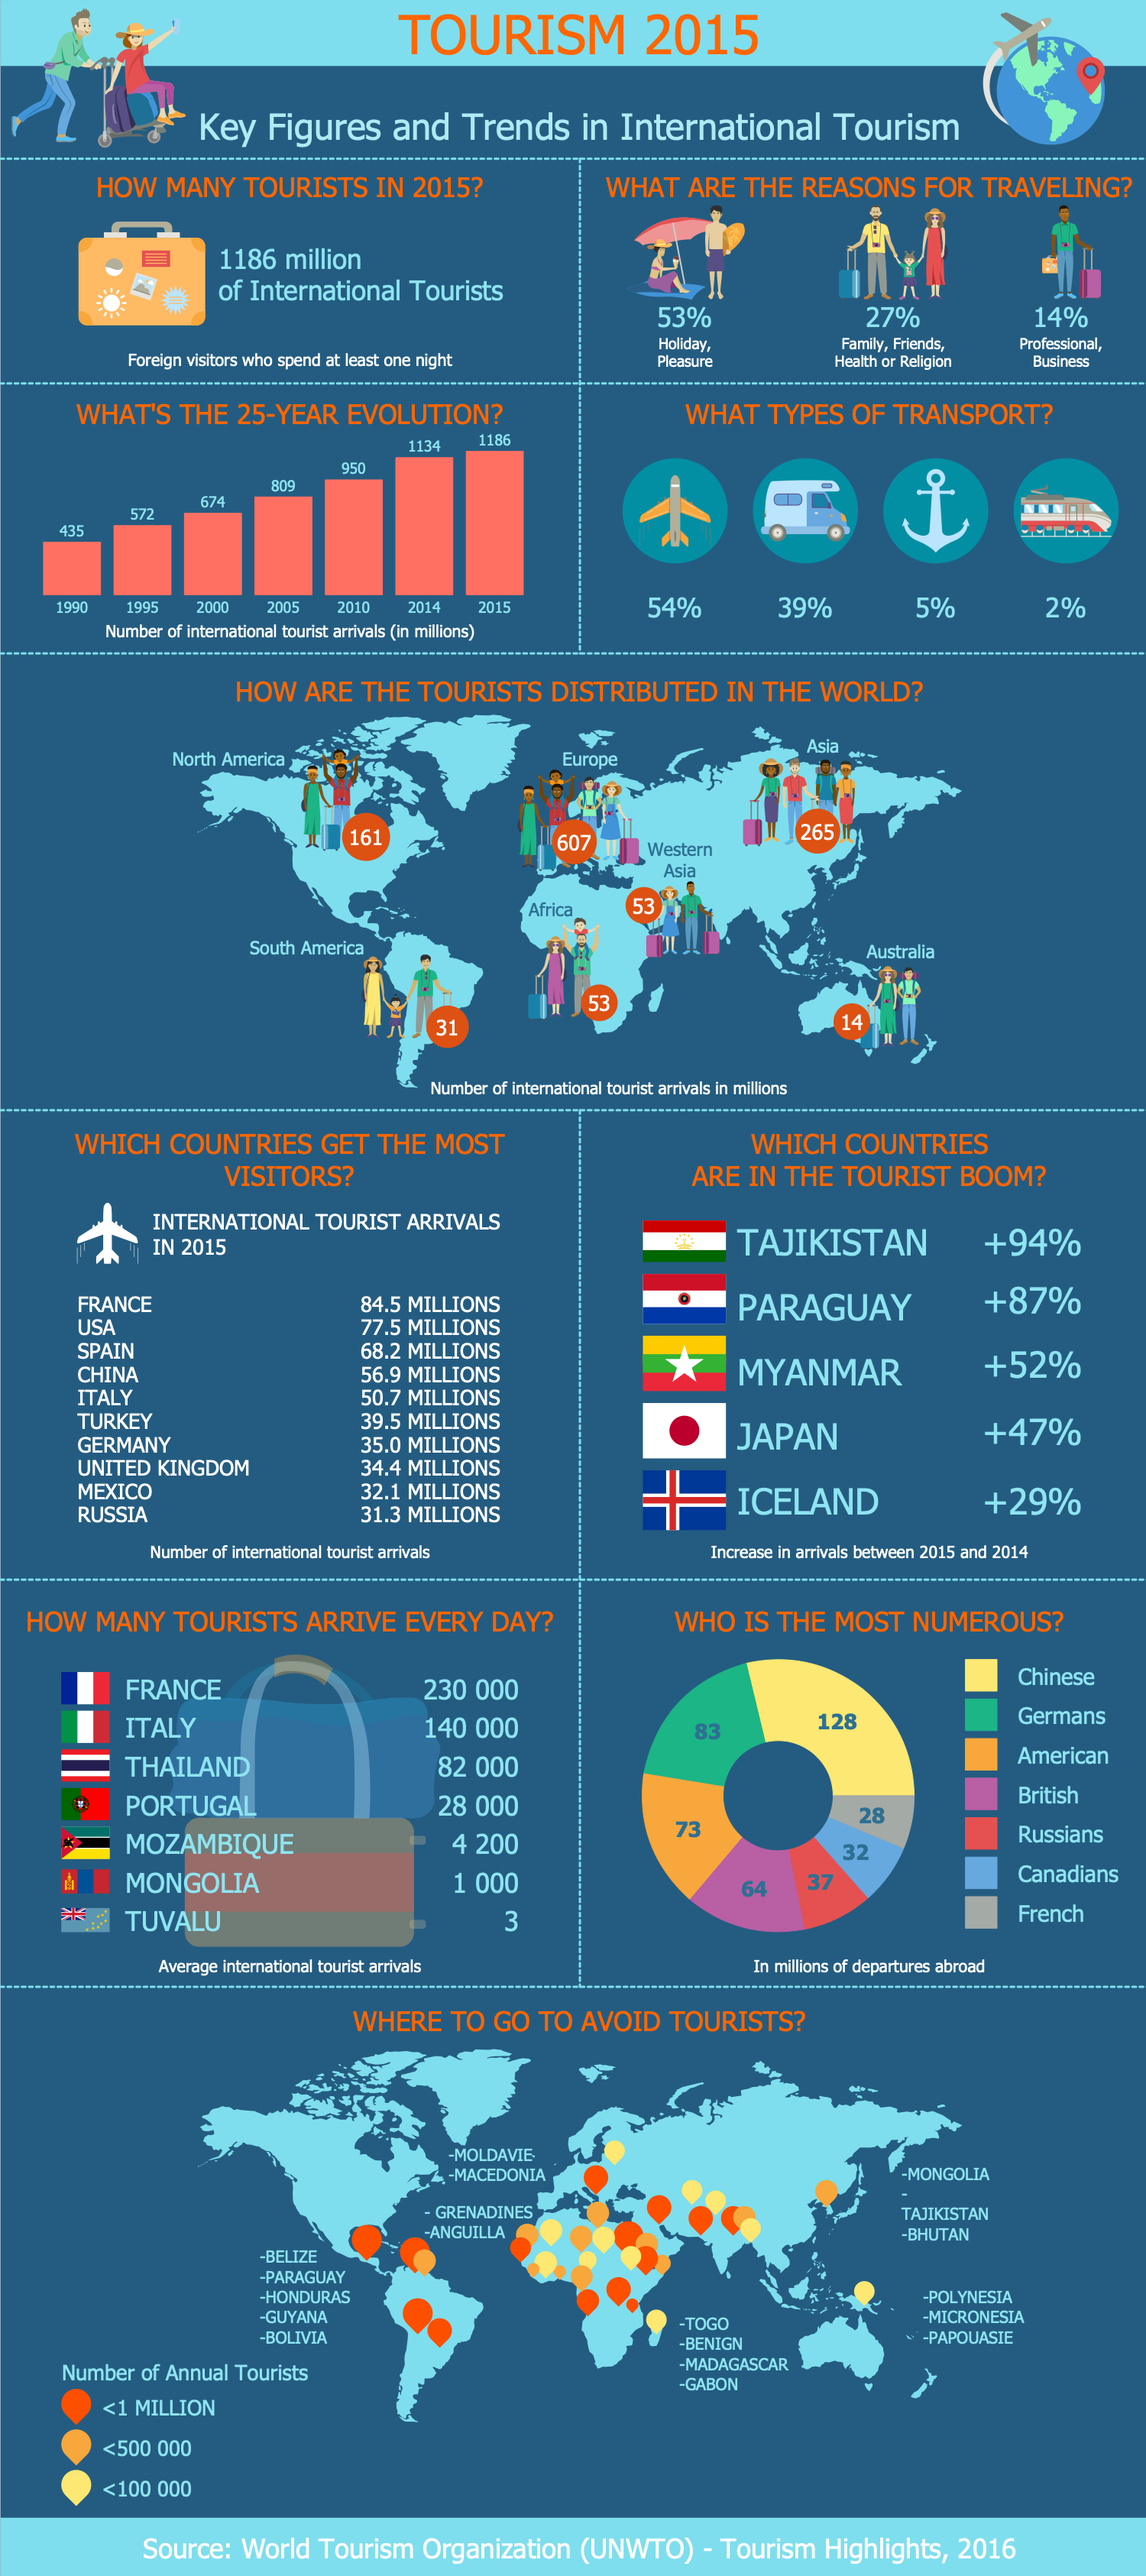
This business travel infographics sample represents the key figures and trends in international tourism in 2015. Here, you can find that there were 1186 million of international tourists in 2015. There are represented the results of a survey of travelers about the reasons of their traveling, thus 53% of tourists travel on holiday and for pleasure, 27% travel to family, friends, by reason of health or religion, and 14% travel for work and business issues. The included Bar Chart shows that the number of international tourist arrivals has steadily grown over the past 25 years and increased from 435 million in 1990 to 1186 in 2015. The most popular way to travel is by plane (54%), a little fewer of tourists use cars (39%), even less prefer maritime transport (5%), and the trains are least popular (2%). On the bright graphics, you can also see how the tourists are distributed in the world, which countries get the most visitors and are in the tourist boom, statistics on how many tourists arrive every day, what nationality is the most numerous among the travelers, and where you can go to avoid many tourists.
Inside
What I Need to Get Started
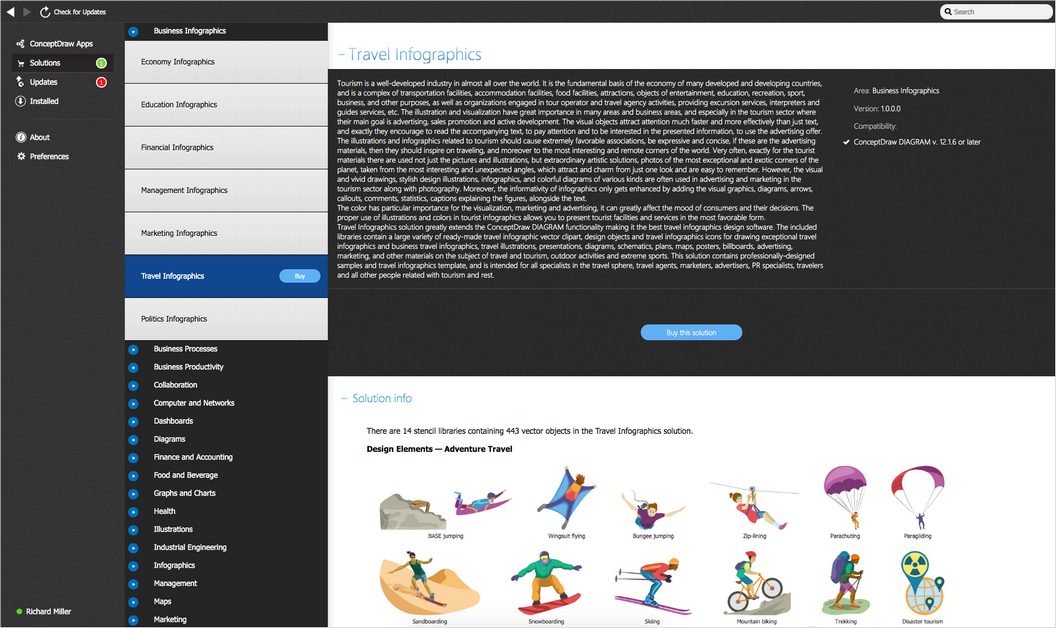
After ConceptDraw DIAGRAM is installed, the Travel Infographics solution can be purchased either from the Business Infographics area of ConceptDraw STORE itself or from our online store. Thus, you will be able to use the Travel Infographics solution straight after.
How to install
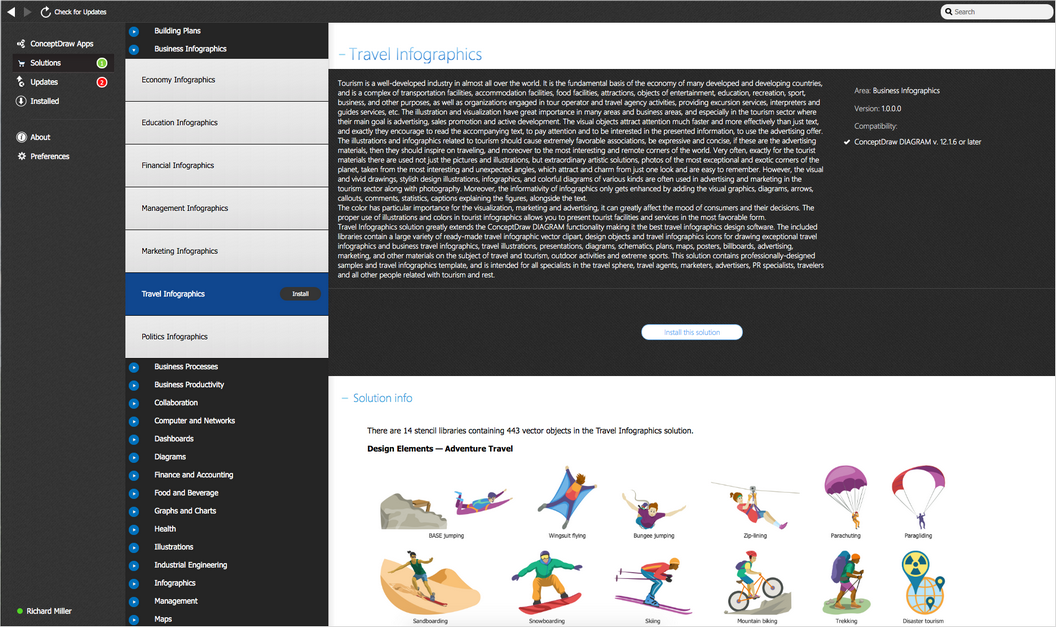
First of all, make sure that both ConceptDraw STORE and ConceptDraw DIAGRAM applications are downloaded and installed on your computer. Next, install the Travel Infographics solution from the ConceptDraw STORE to use it in the ConceptDraw DIAGRAM application.
Start using
Start using the Travel Infographics solution to make the professionally looking illustrations by adding the design elements taken from the stencil libraries and editing the pre-made examples that can be found there.
