ConceptDraw PROJECT Software Overview
ConceptDraw PROJECTProfessional Dynamic Project Management ConceptDraw PROJECT is designed to enable project managers to analyze the progress of projects and optimize the utilization of available resources. ConceptDraw PROJECT is an effective tool for new and experienced users with a fine balance of usability and powerful functionality.
| ||||||||||||||||||||||


TEN RELATED HOW TO's:
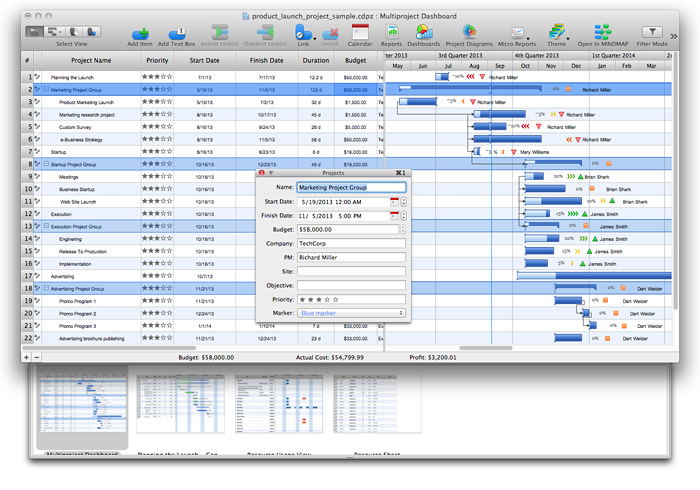
ConceptDraw PROJECT’s powerful reporting engine lets you generate a set of tabular reports with just one click, or visualize your project as Radial Tasks Structures, Work Breakdown Structures and Resource Calendars. It also provides you with dynamic Project Dashboards.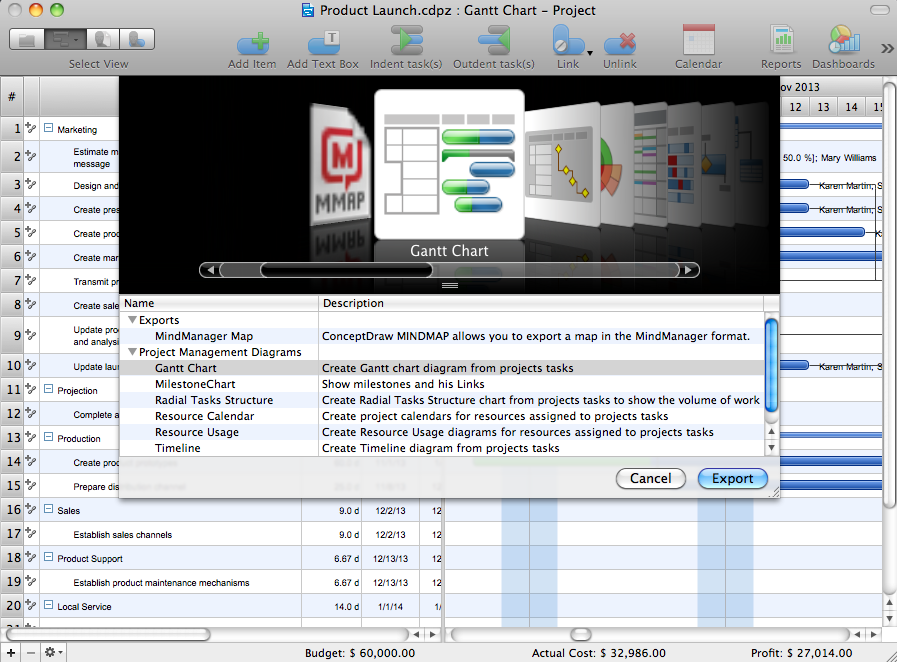
Picture: How to Report Task's Execution with Gantt Chart
A flowchart is a simple but very functional tool when it comes to understanding a workflow or to removing unnecessary stages from a process. When drawing flowcharts, keep in mind that there are four common types of flowcharts, like document flowcharts and data flowcharts that show control over a data or document flow over a system. To show controls on a physical level, use system flowcharts. In addition, to show controls in a program, you can draw a program flowchart.
This flowchart diagram represents the piece of an article editing process, that involves the author and editor. It was created using the Basic Flowchart notation that consists from the basic flowchart symbols. The start and the end of the process are indicated with "Terminator" symbols. The "Process" symbols show the action steps consisting from making edits and searching for a compromise, when the author does not agree with the suggestions of the editor. The "Process" symbol is the general symbol in process flowcharts. The "Decision" symbol indicates a branching in the process flow. There are two branches indicated by a Decision shape in the current flowchart (Yes/No, Disagree/Agree). This basic flowchart can be used as a repeating unit in the workflow diagram describing the working process of some editorial office.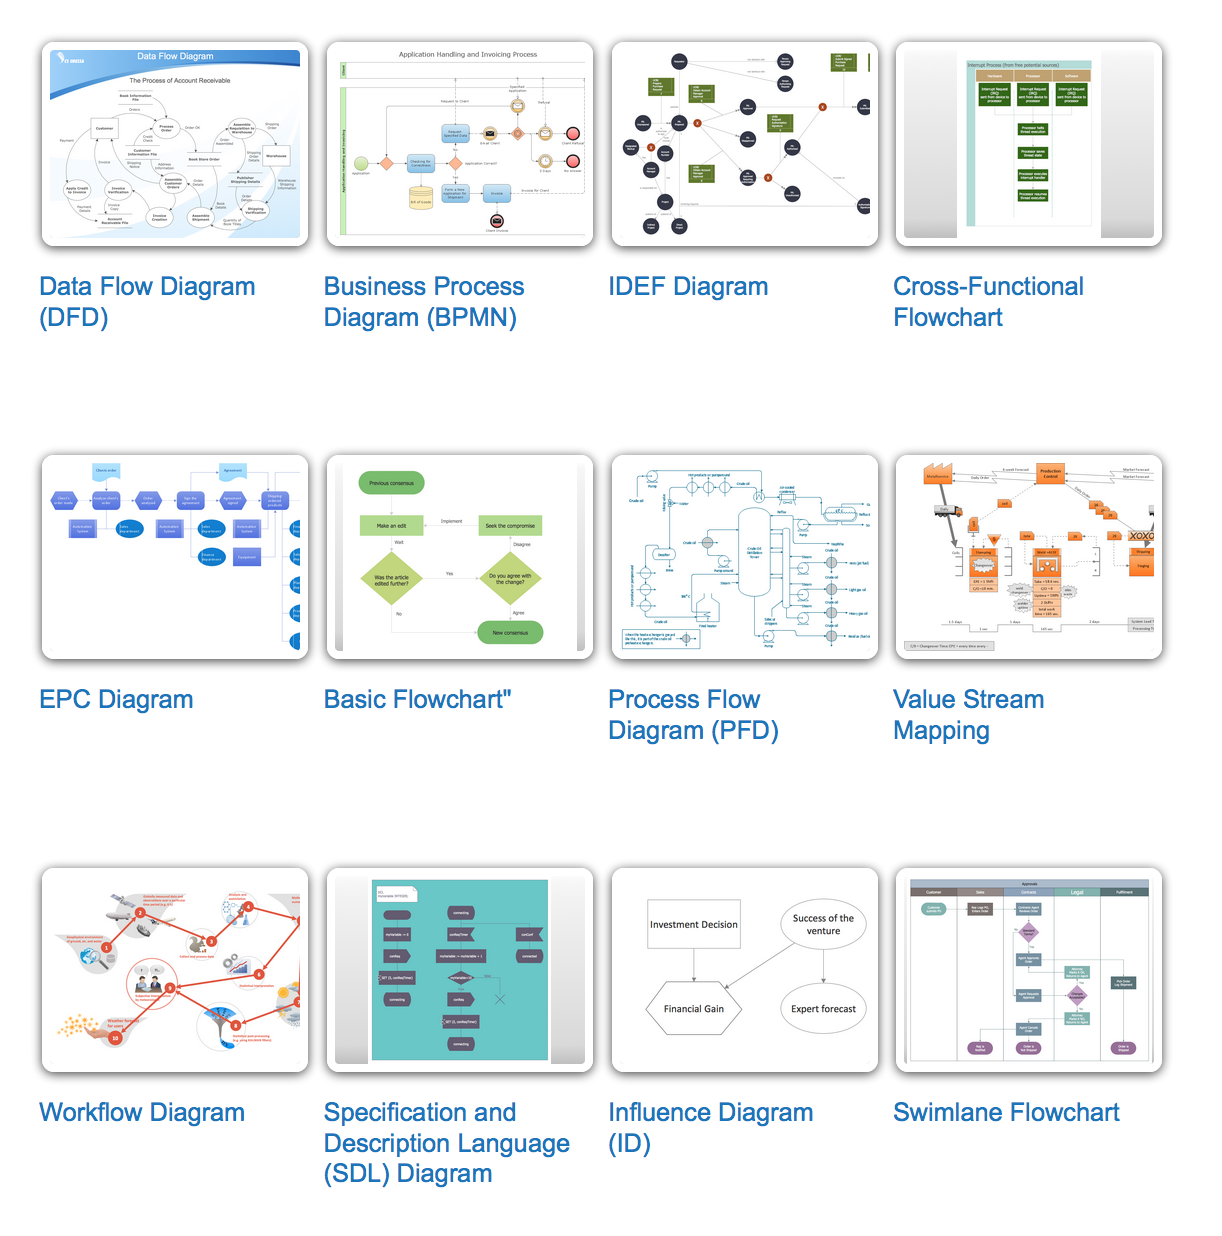
Picture: Types of Flowcharts
Related Solution:
Drawing of Family Emergency Plan is quite complex process. How can you make it? Usually you draw it accurately on the sheet of paper and this process takes much time. ConceptDraw DIAGRAM diagramming and vector drawing software offers you Fire and Emergency Plans Solution - the new method of quickly drawing Family Emergency Plan of any complexity.
Picture: Family Emergency Plan
Related Solution:
To begin managing a new project, you will need to define the individual Tasks that must be completed to deliver it. The default view for a new project in ConceptDraw PROJECT is the Gantt Chart.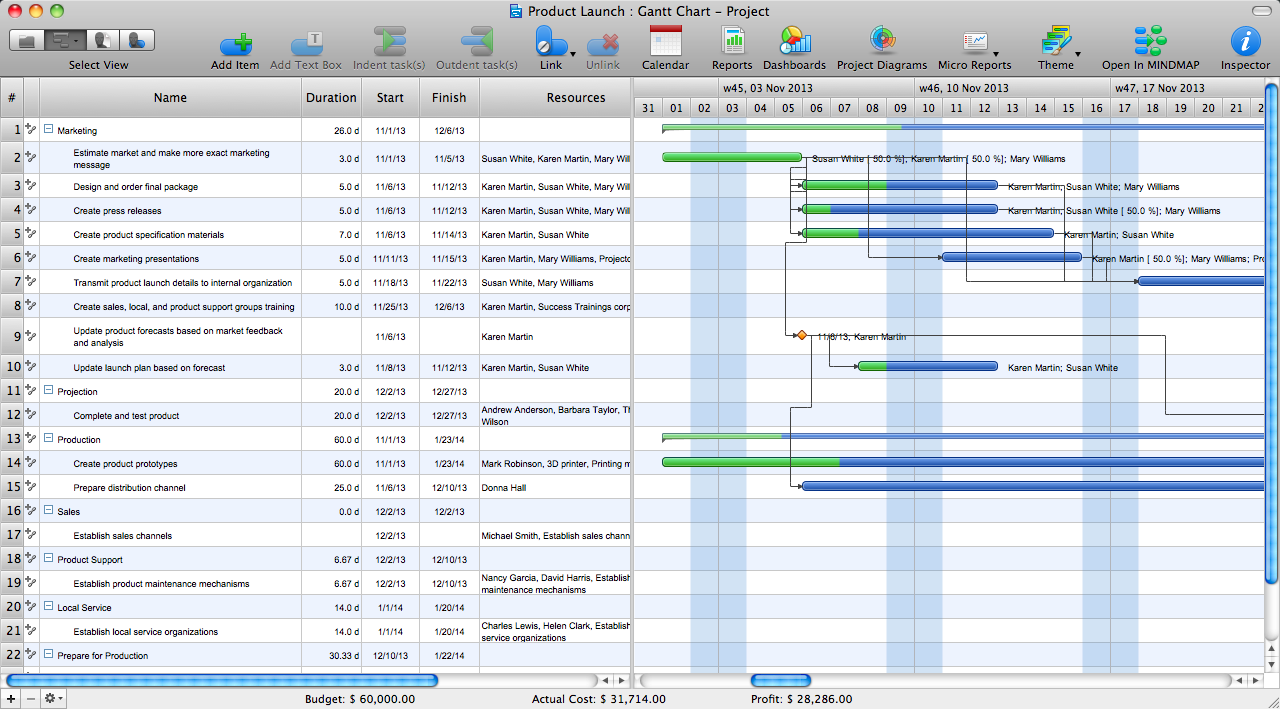
Picture: How to Create Gantt Chart
ConceptDraw DIAGRAM is a flowchart creating software. This software includes over 20 vector stencils in libraries. These objects allow you to create well-designed flowcharts.
Put an initial object from library to a page and use RapidDraw technology clicking on direction arrows to add new objects to the flowchart. This way you can make flowchart quickly.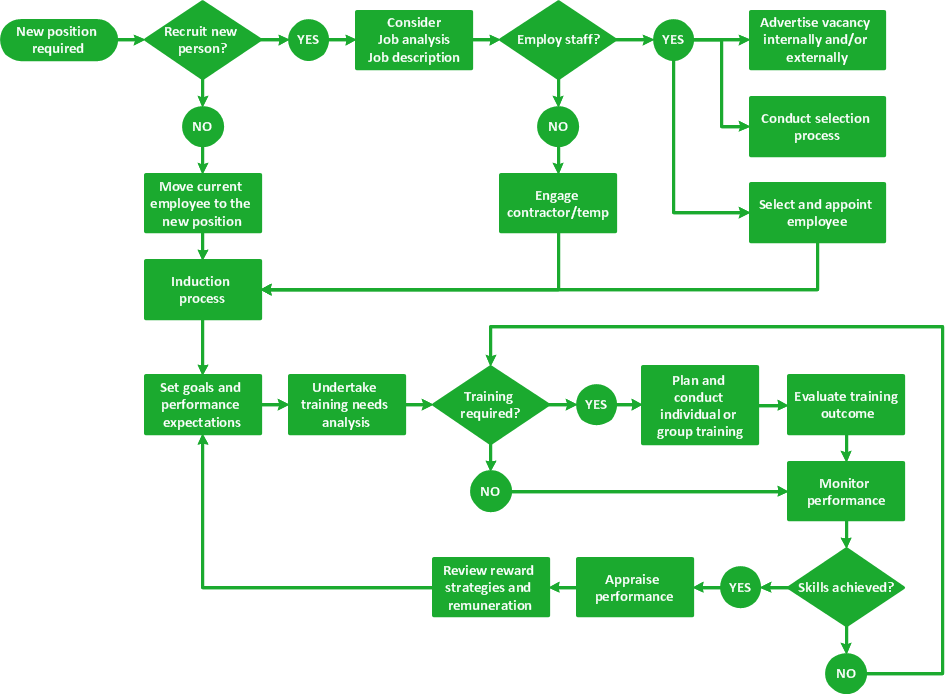
Picture: How To Create a Flow Chart in ConceptDraw
Related Solution:
While designing a conceptual data model, you should use appropriate software. For instance, ConceptDraw DIAGRAM is a user-friendly ER diagram tool that has a lot of samples and templates to facilitate your work. A clear entity-relationship diagram helps to define the relations between system’s components.
Software engineering is the section of a computer science engaged to design, realization, and support of complex software products. An ERD is a data modeling method that is widely applied in the software engineering practice. Commonly it is used for developing a structure of a a relational database. An entity relationship diagram is helpful for structuring and organizing databases that can be modeled using a relational structure. An entity relationship diagram is designed to depicts the interrelationships within the sets of entities which are accumulated in the database. Each entity represents a particular component of a data. Thus, ER diagrams depicts the logical structure of databases. ConceptDraw ER Diagrams solution provides software engineers with the professional tool for making entity-relationship diagrams.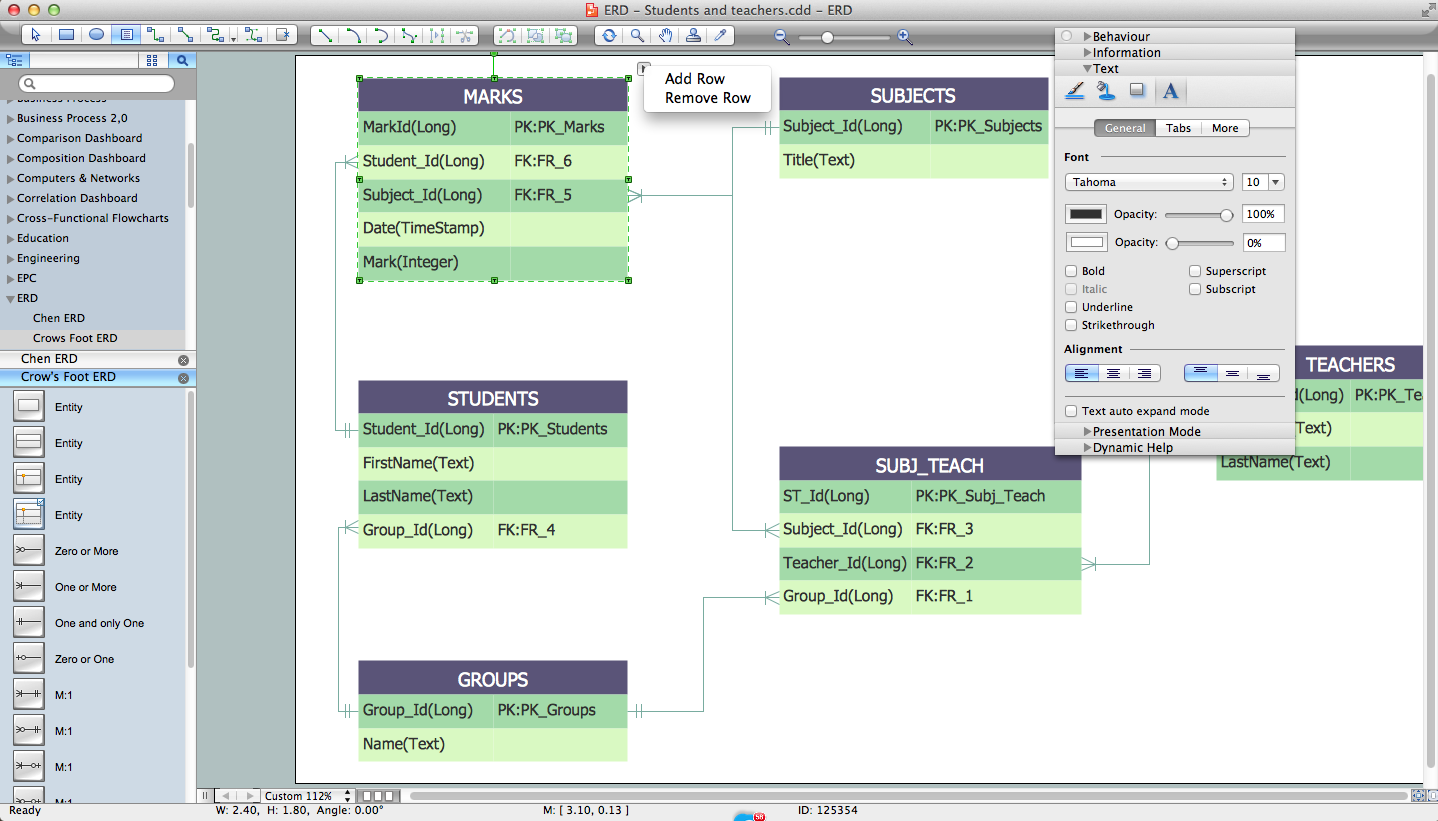
Picture: Entity Relationship Diagram Software Engineering
Related Solution:
ConceptDraw Column Chart software allows drawing column charts using predesigned objects or drawing tools. In ConceptDraw Column Chart software you can find a complete set of column chart tools and objects.
Picture: Column Chart Software
Related Solution:
ConceptDraw is your tool for driving social integration and managing change across and streamline social media processes of your organisation.This tool keeps the entire team on the same page allowing you to realize your social media strategy, improve the quality of your answers, and minimize the time it takes to respond.
Picture: Social Media Response Management DFD Charts - software tools
Related Solution:
Enterprise systems engineers almost every day face the necessity of network diagrams. We should also take into account that Cisco network design is not only limited to computer networks, but, furthermore, you can design telephone networks and much more. You can build an hierarchical model of your network to get better performance and reliability.
This network diagram represents the utilization of Conceptdraw DIAGRAM for network documentation creation. The diagram shows schematically the structure of a node of a large Internet service provider, which is completed on the basis of Cisco equipment. This diagram was designed using the vector library containing the images of Cisco equipment, supplied with Cisco Network Diagrams solution. In total, the solution has more than ten libraries including more than 500 vector icons of Cisco equipment.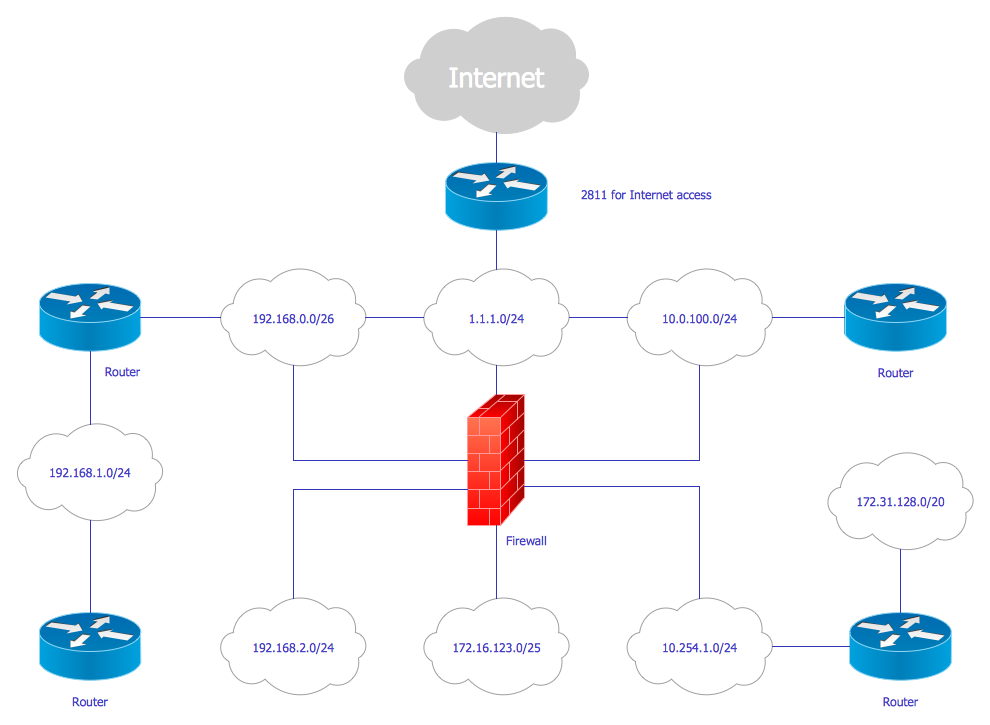
Picture: Cisco Network Design
Related Solution:
Creation of various types of Integration DEFinition (IDEF) diagrams - IDEF0, IDEF1X, IDEF2, IDEF3 and many other is a sufficiently complex process that requires powerful automated tools. ConceptDraw DIAGRAM diagramming and vector drawing software offers you such tool - IDEF Business Process Diagrams solution from the Business Processes area of ConceptDraw Solution Park.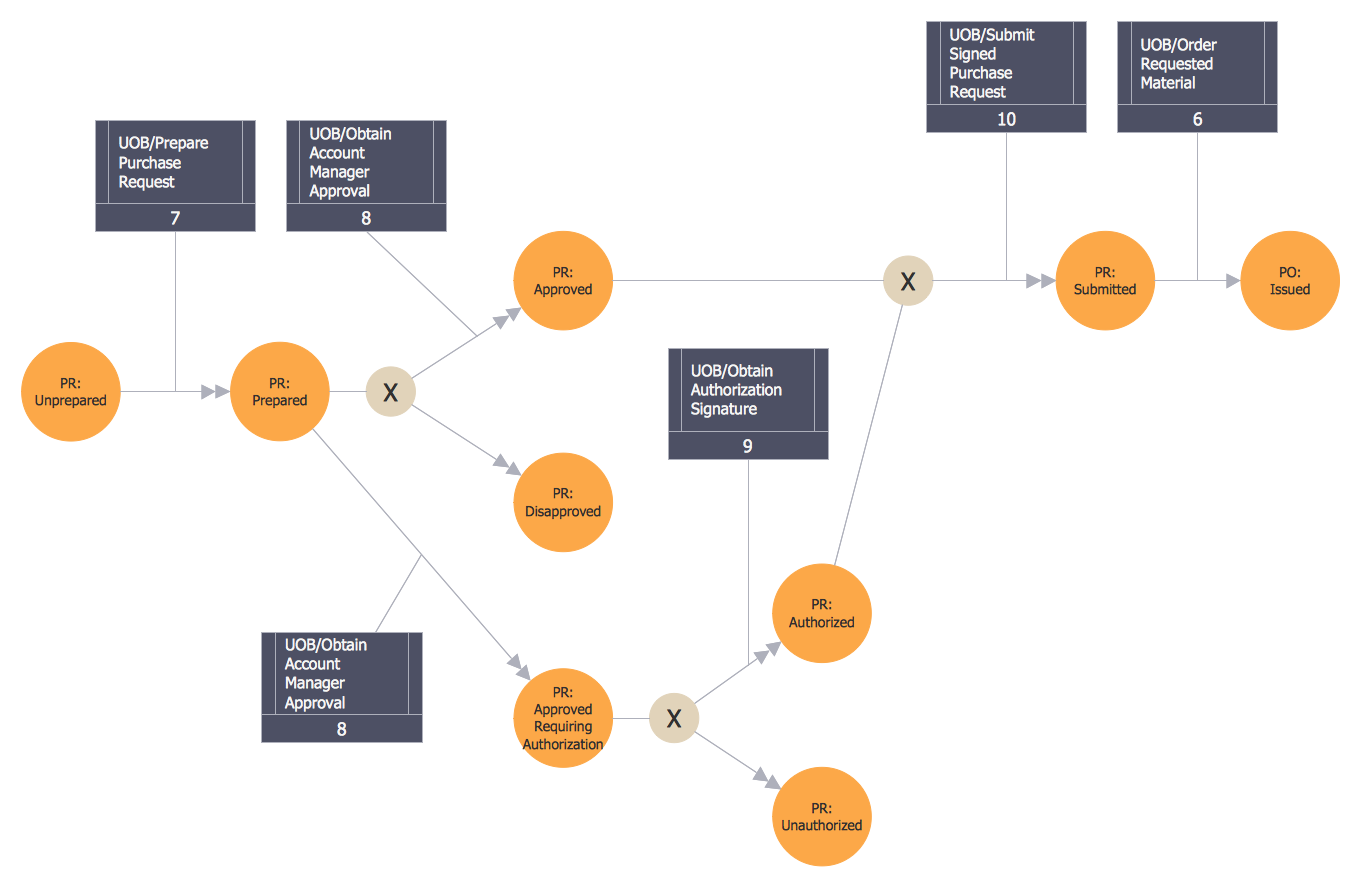
Picture: Integration Definition
Related Solution:
ConceptDraw
DIAGRAM 18