Corrective Action Planning
Management and Planning
ConceptDraw OFFICE suite is a software for Action planning. The Seven Management and Planning Tools solution is a toolset for the corrective plans making. Corrective action planning define people and groups involvement in corrective actions by roles, identify logical sequences of scheduled actions and critical path of problem solving, identify possible risks of action plan and propose preventive actions.
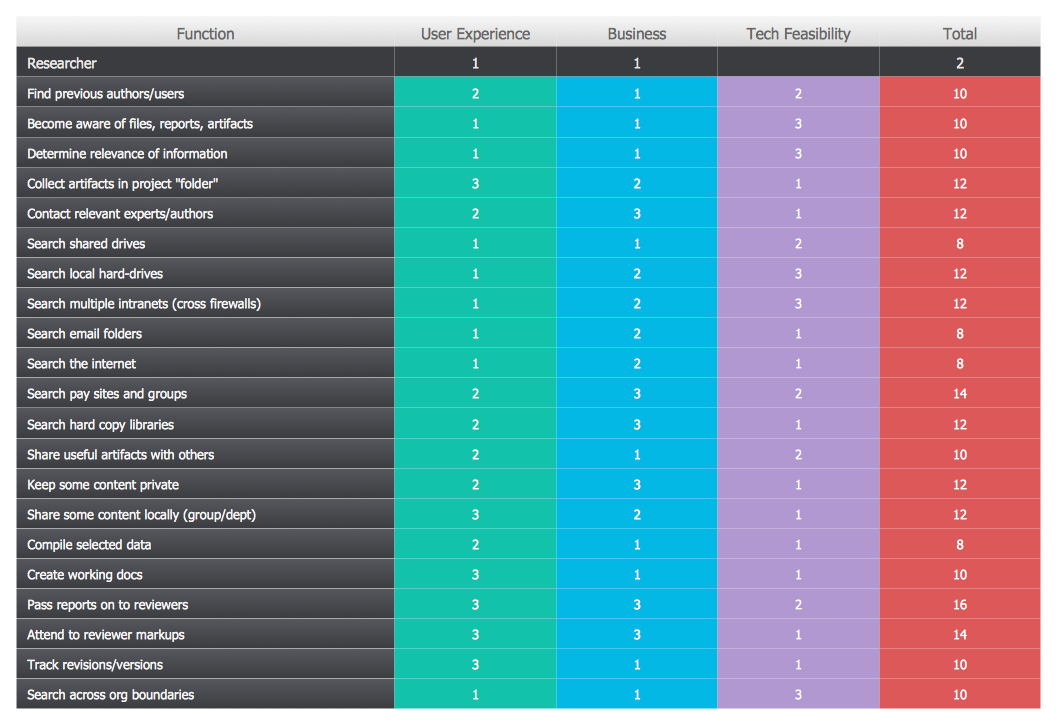
Pic.1 Corrective Action Planning. Opportunity Prioritization Matrix
The Prioritization Matrix ranks factors. The process allows one to identify the factors that are the first priority. These factors can then be analyzed for possible corrective actions. The Prioritization Matrix allows for the weighting of each identified criterion.
See also:
TEN RELATED HOW TO's:
The Total Quality Management Diagram solution helps you and your organization visualize business and industrial processes. Create Total Quality Management diagrams for business process with ConceptDraw software.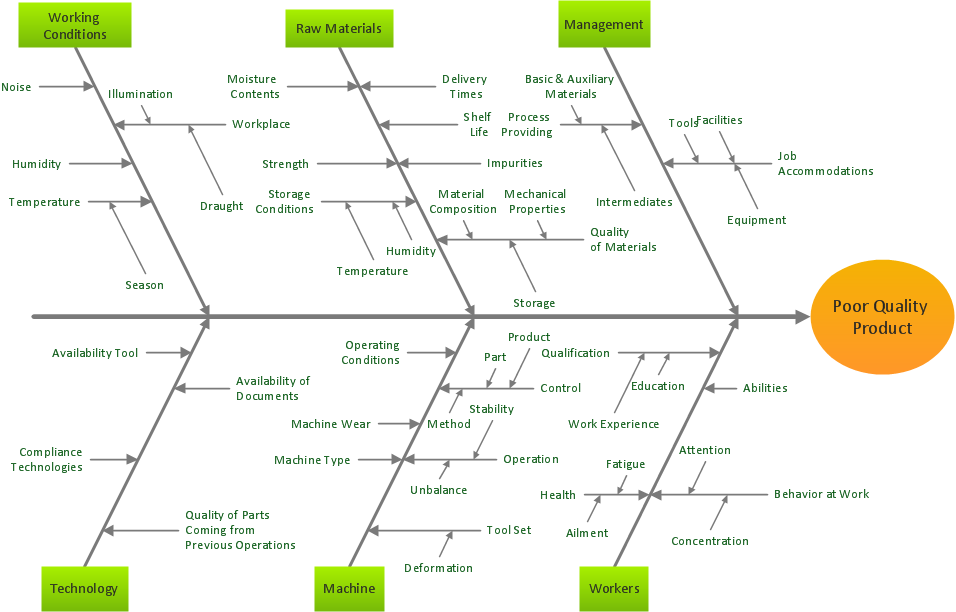
Picture: Total Quality Management Business Diagram
Related Solution:
Any hierarchical structure of any company can be represented as a triangle or a pyramid. You can create a pyramid diagram and pyramid chart of any complexity using special libraries included in ConceptDraw DIAGRAM. Actually, any knowledge or chain of facts can also be depicted as a pyramid.
A wide range of graph and chart are utilized in marketing to maintain documentation and various visual issues, that deal with marketing information and data. The marketing value pyramid can be created to illustrate how the value of company, or product is based on its competitiveness. To design this diagram we used ConceptDraw DIAGRAM drawing tools in conjunction with Pyramid solution for Solution Park.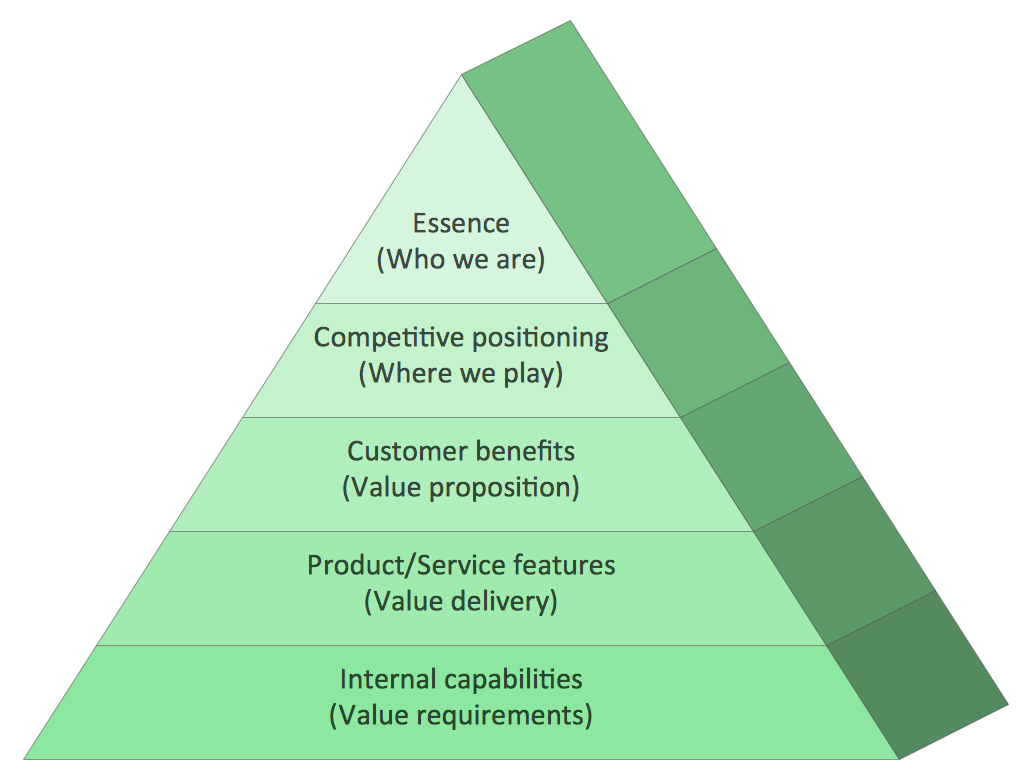
Picture: Pyramid Diagram and Pyramid Chart
Related Solutions:
Successful quality management implemented in a company of any size is a critical component of a company organization.
Picture: What is a Quality Management
Related Solution:
Use the Relations Diagram to create a relations factors map and to identify which factors are “drivers” and “indicators”. This diagram identifies causal relationships and determine what factors are causes or effects.
ConceptDraw OFFICE suite is a software for relation diagram making.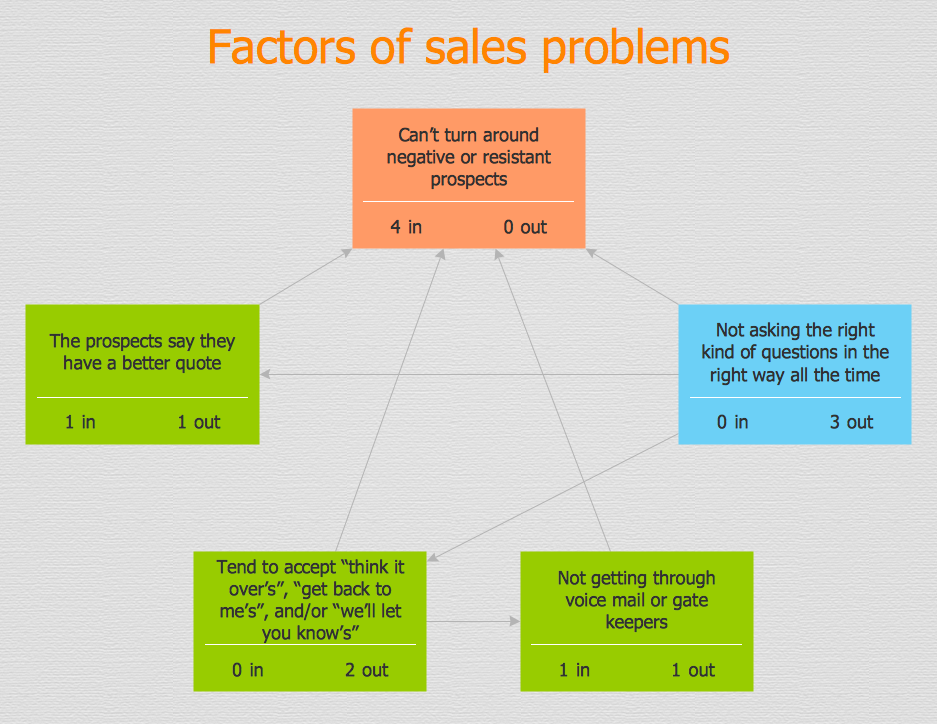
Picture: PROBLEM ANALYSIS.Relations Diagram
You can use many tools to create a representation of a system behavior or a scheme of objects relationships. Some of them are quite abstract and useless, and some, like UML tools help clarifying both the structure and the behavior of a system. There are various types of uml diagrams and tons of examples explaining the difference between them.
UML 2.2 specification has many kinds of diagrams. They are divided into two groups( structure and behavior diagrams). This class diagram shows the hierarchical structure of UML 2.2 specification. Class diagram - the most suitable tool for this task because it is designed to describe basic structure of a system. This diagram can be use as a visual aid for learning UML.
Picture: UML Tool & UML Diagram Examples
Related Solution:
ConceptDraw DIAGRAM is a Mac OS X and Windows platforms professional software to draw your own business process diagrams and flowcharts.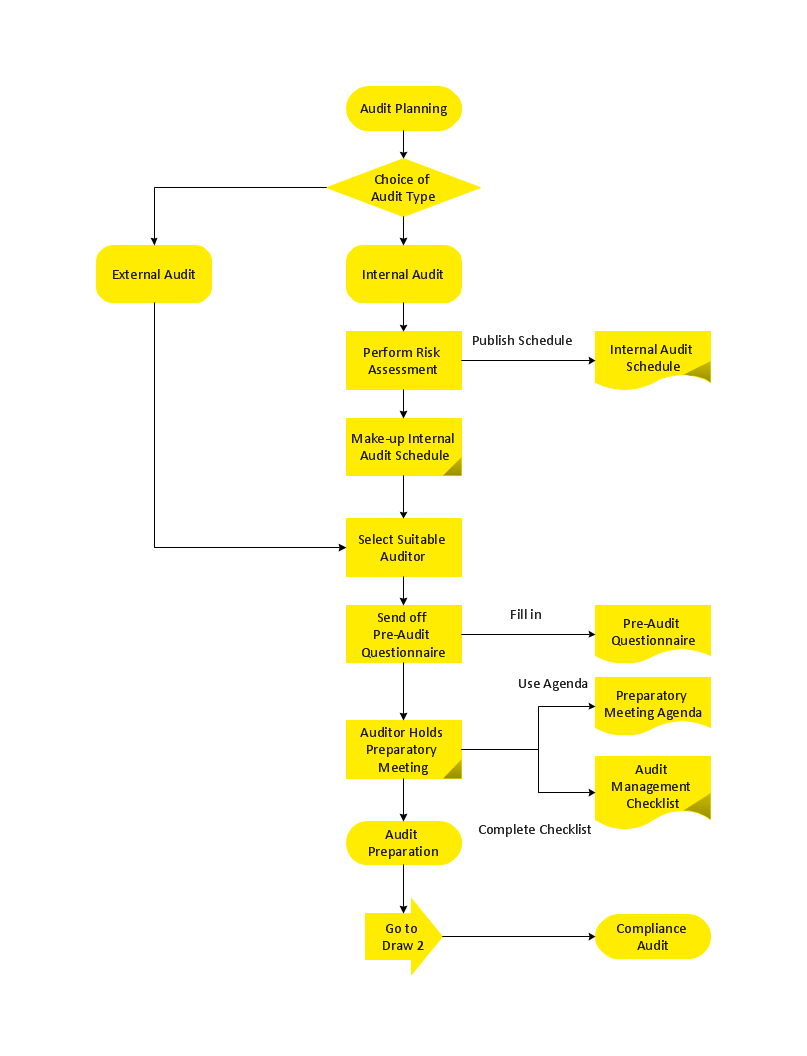
Picture: Professional Diagram and Flowchart Software
When deciding to start your own business, you have to take into account a bunch of different aspects. One of the ways to get inspired is to look through various restaurant floor plans samples or interior photos of already known establishments. This will help you, but keep in mind that a really unforgettable establishment must be unique.
This restaurant floor plan diagram was designed using ConceptDraw Cafe and Restaurant Floor Plan solution. It can be used as a sample while considering a custom restaurant design. With the help of this example you can estimate the amount of furniture best for a dining room or kitchen of the restaurant. In addition, this plan would be useful as a check list when you will consider a list of the furniture and equipment needed for all areas of the future restaurant.
Picture: Restaurant Floor Plans Samples
Related Solution:
Value Stream Map template helps you to create VSM diagrams using ConceptDraw DIAGRAM software.
Picture: How To create Value Stream Map (VSM)
Related Solution:
This sample shows the Influence Diagram. It was created in ConceptDraw DIAGRAM diagramming and vector drawing software using the Basic Diagramming Solution from the Universal Diagramming area of ConceptDraw Solution Park.
Influence diagram represents the directed acyclic graph with three types of nodes and three types of arcs that connect the nodes. Decision node is drawn as a rectangle, Uncertainty node is drawn as an oval, Value node is drawn as an octagon.
Picture: Influence Diagram
Related Solution:
House of Quality Matrix Software - Use the predesigned objects from the Involvement Matrix Objects Library from the Seven Management and Planning Tools Solution to create professional looking House of Quality Matrices in minutes.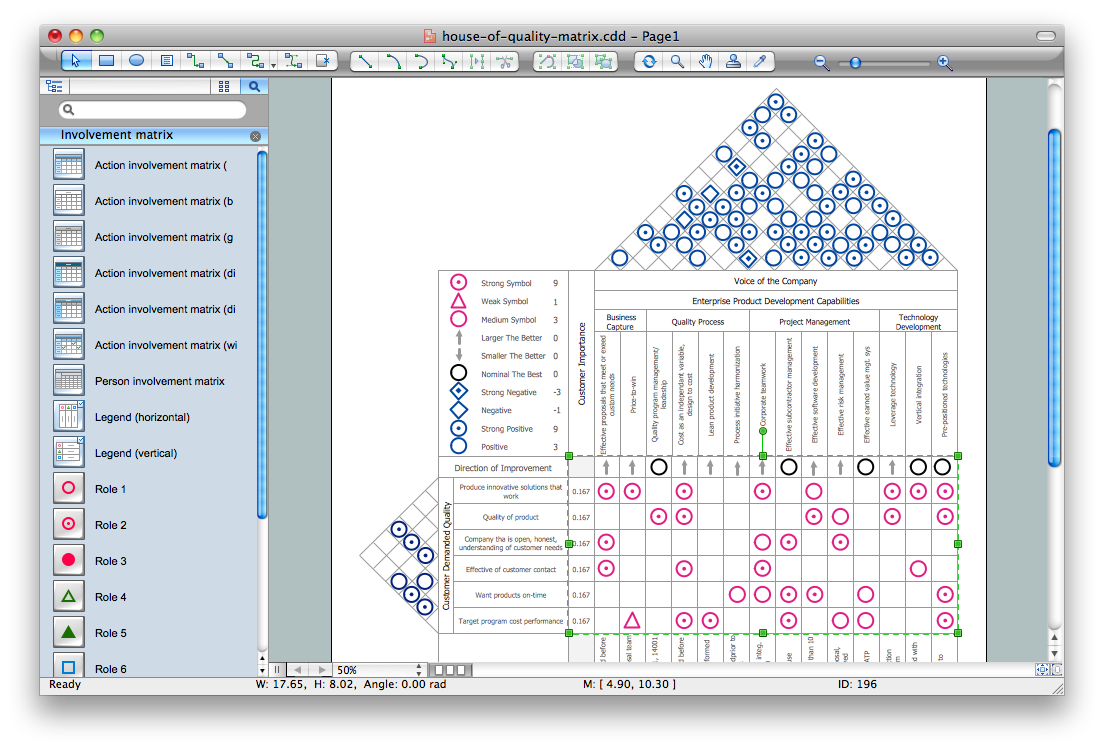
Picture: House of Quality Matrix Software
Related Solution:
ConceptDraw
DIAGRAM 18