CORRECTIVE ACTIONS PLANNING. Involvement Matrix
Management and Planning tools
ConceptDraw OFFICE suite is a software for corrective actions planning. The Involvement Matrix diagram is constructed for all highly prioritized corrective actions. It defines the participants and their roles. This diagram uses symbols to assign who participates, performs, consults, should be informed, checks the work, and accepts the results. The Involvement Matrix can identify the distribution of responsibilities and identify roles in a group or team.
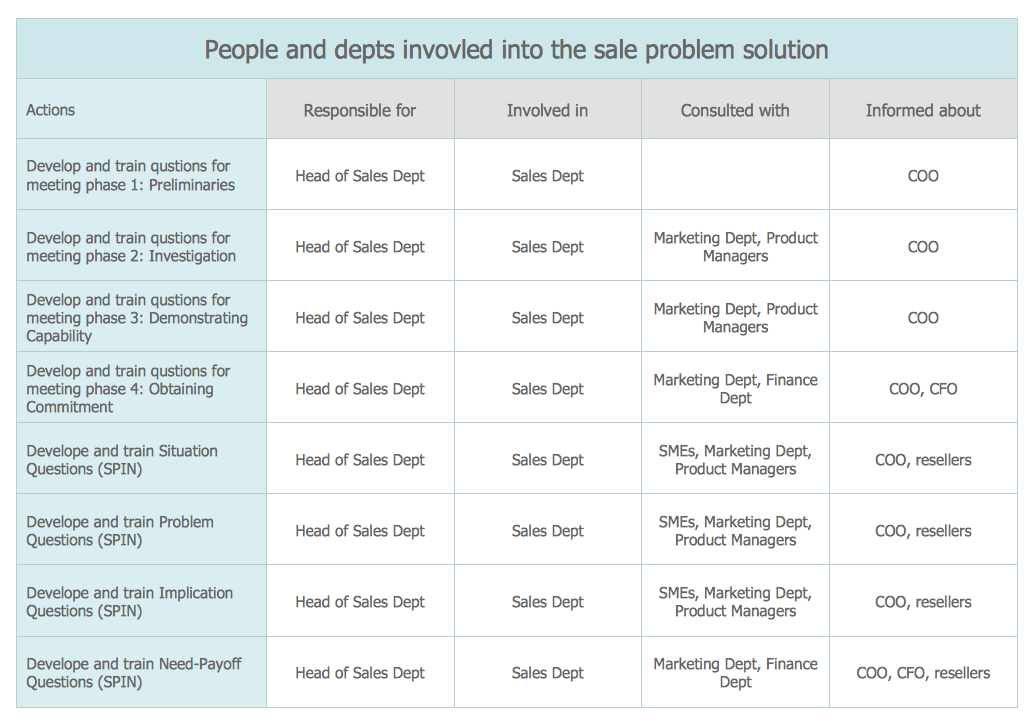
Pic.1. Involvement Matrix — Sale Problem Solution
The Involvement Matrix defines the level of involvement and nature of participation. The diagram shows the degree of involvement for all identified parties in the execution of corrective actions.
See also:
TEN RELATED HOW TO's:
ConceptDraw DIAGRAM is the best program to make workflow diagrams. With the new Arrows10 technology it brings features allow you make workflow diagrams faster then ever before. These features allow you to focus on thinking, not drawing, that makes ConceptDraw DIAGRAM the best program to make workflow diagrams.
Picture: Best Program to Make Workflow Diagrams
Related Solution:
There are many tools to manage a process or to illustrate an algorithm or a workflow. Flowcharting is one of those tools. However, it may be difficult to show complex processes that require multiple attributes or several people in a simple flowchart, so a cross-functional flowchart would be a solution for that situation. To create such flowchart, group processes and steps to labeled rows or columns, and divide those groups with horizontal or vertical parallel lines. It is worth mentioning that there are different types of cross-functional flowcharts, like opportunity or deployment flowchart.
This diagram shows a cross-functional flowchart that was made for a trading process. It contains 14 processes, distributed through 5 lines depicting the participants who interact with the process. Also there are connectors that show the data flow of information between processes. The cross-functional flowchart displays a detailed model of the trading process, as well as all participants in the process and how they interact with each other. The lines in the flowchart indicates the position, department and role of the trading process participants.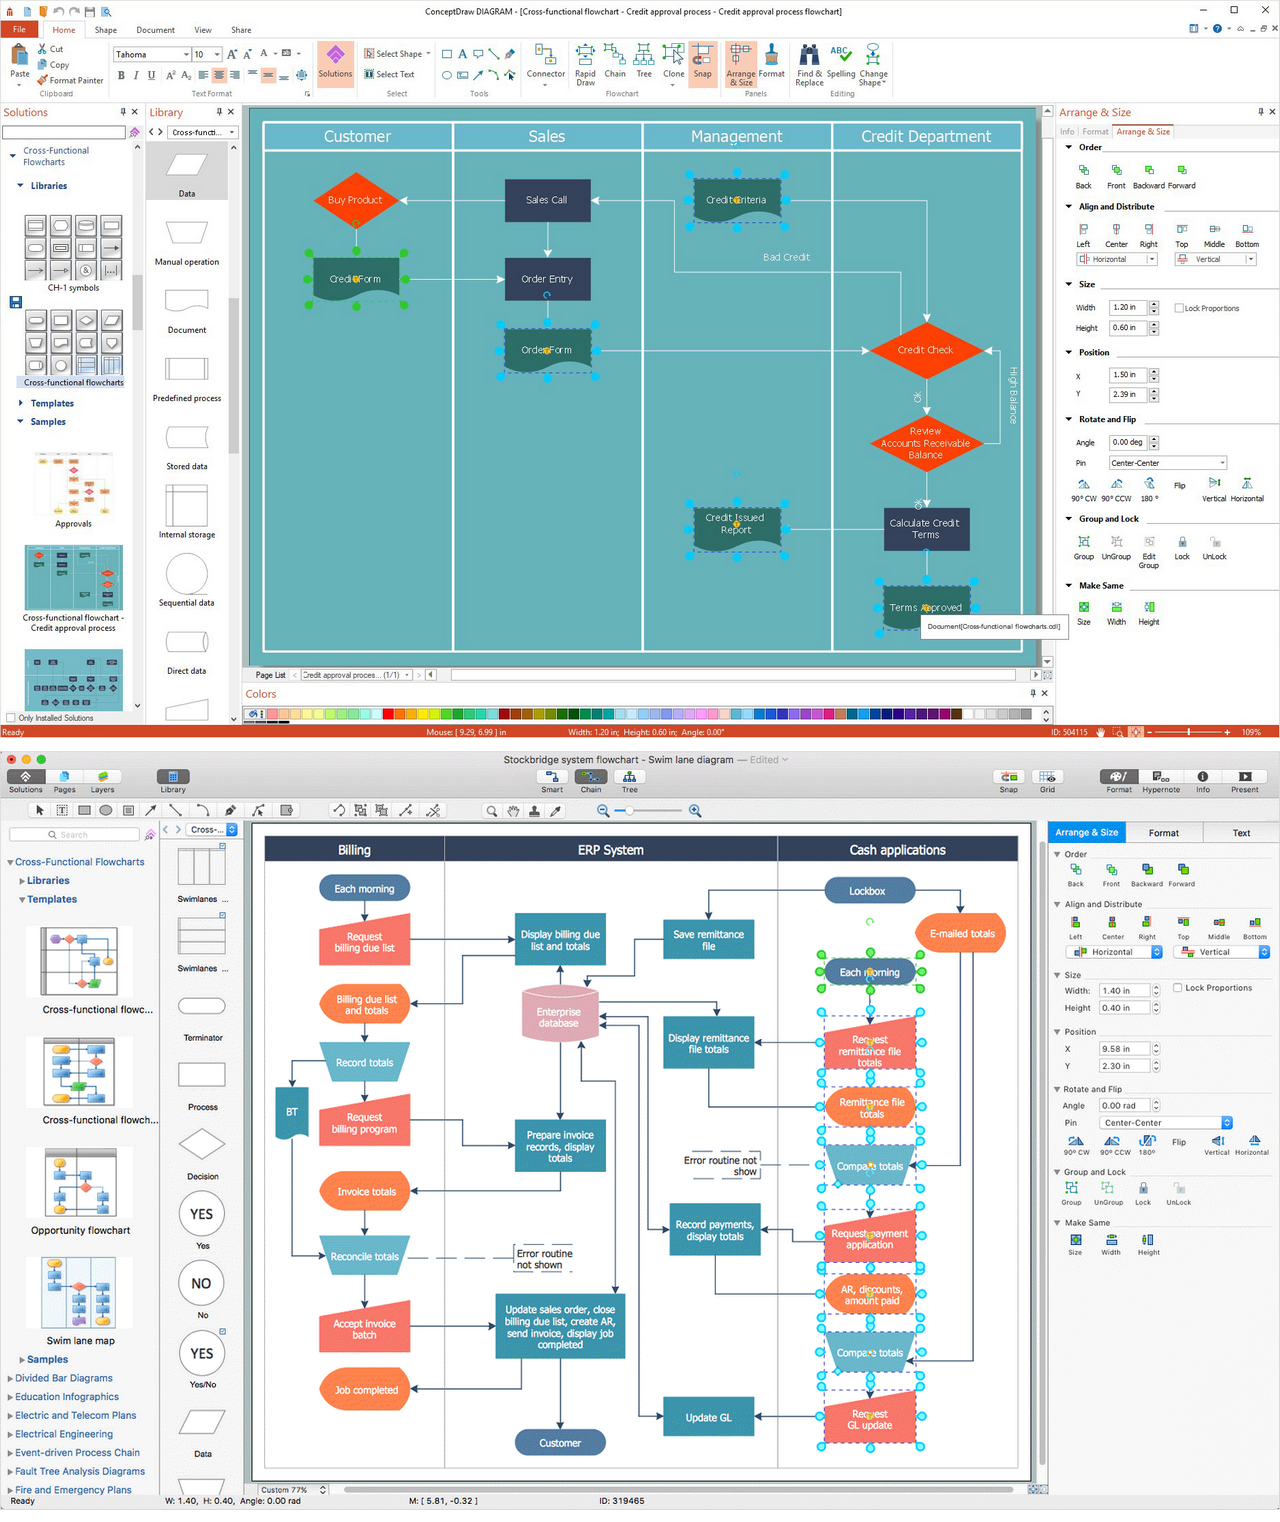
Picture: Cross-Functional Flowchart
Related Solution:
ConceptDraw PROJECT’s powerful reporting engine lets you generate a set of tabular reports with just one click, or visualize your project as Radial Tasks Structures, Work Breakdown Structures and Resource Calendars. It also provides you with dynamic Project Dashboards.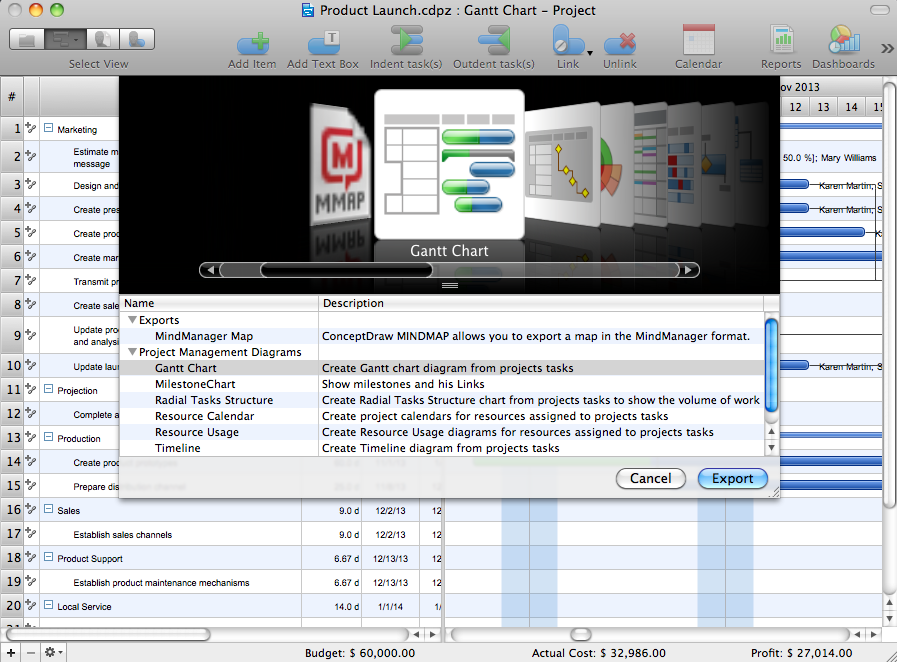
Picture: How to Report Task's Execution with Gantt Chart
This sample shows the Radar Chart that compares the internet dimensions in the four countries. The Radar Chart represents the multivariate data as a two-dimensional chart with three or more variables displayed on the axes that start in one point. The Radar Charts are used in the quality management, business, analytics and sport.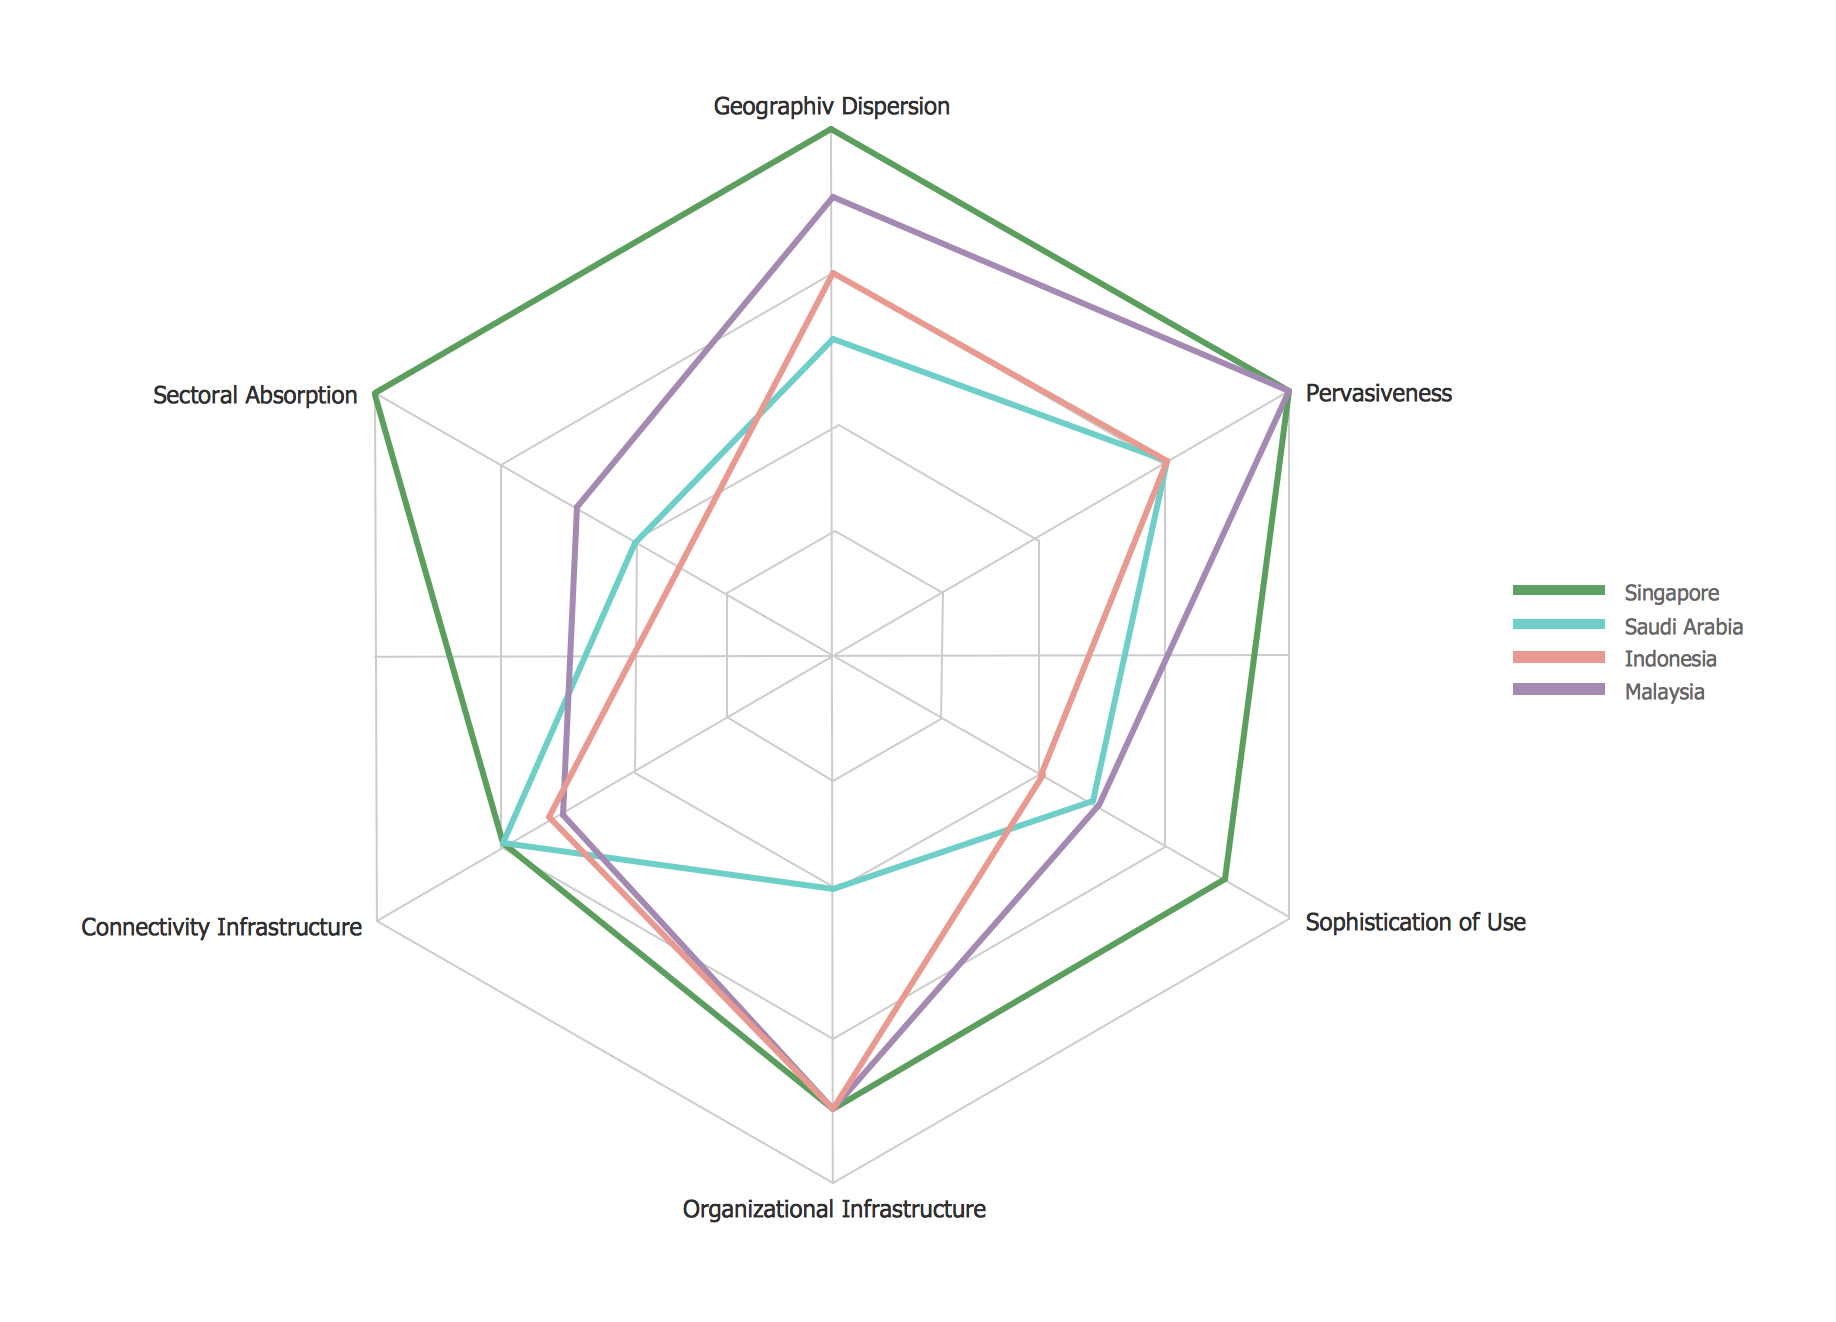
Picture: Radar Chart
The Total Quality Management Diagram solution helps your organization visualize business and industrial processes. Create Total Quality Management diagrams for business process with ConceptDraw software.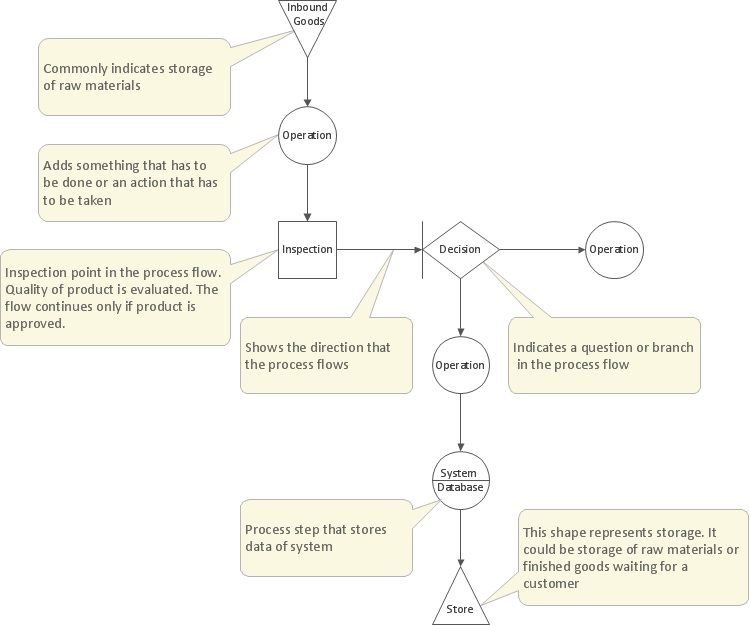
Picture: Management Tools — Total Quality Management
Related Solution:
When we think of an hierarchy, we intuitively imagine a pyramid. Thus, a lot of management tools use pyramid charts as examples or illustrations of various documents or models. You can create any type of triangle diagram using ConceptDraw DIAGRAM.
A triangle (pyramid) diagram is often used in marketing to show the data hierarchy. This pyramid diagram represents the Top Brand Model. It illustrate the model of rebranding strategy. It can be used by marketing agency dealing with rebranding strategies development. It’s critical for marketing diagrams to be both clear and eye catching. ConceptDraw Pyramid diagrams solution meet all these requirements and can be successfully applied for creating and presenting various marketing pyramidal diagrams.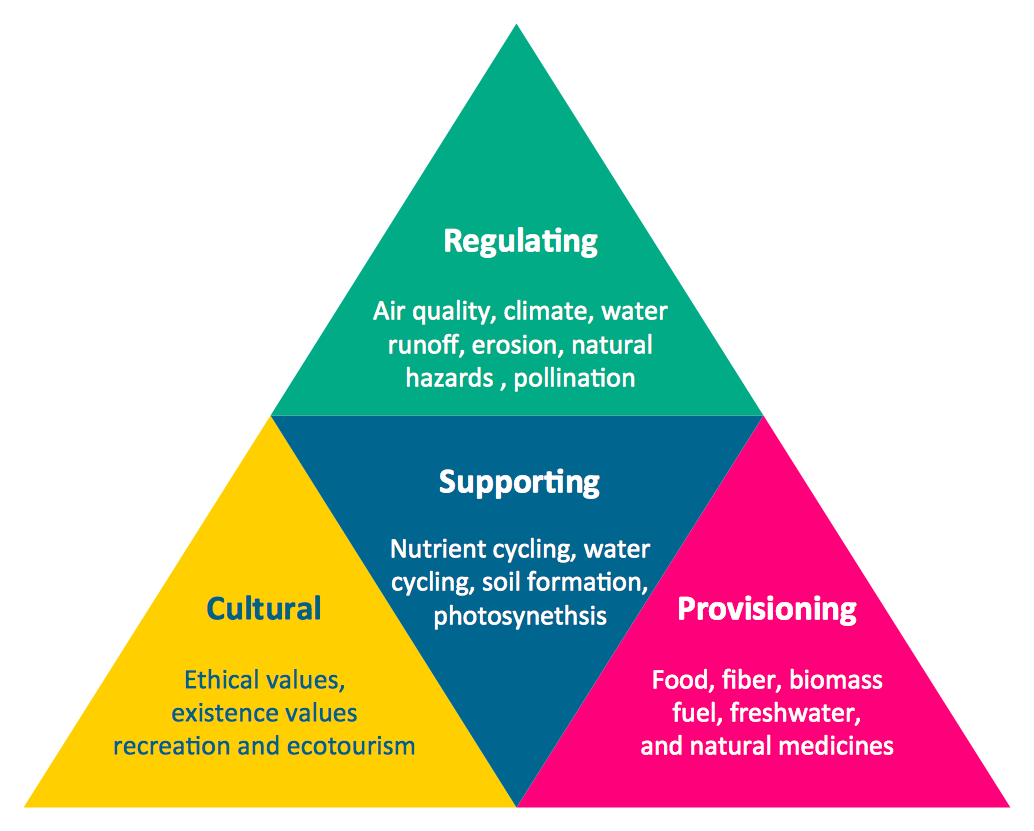
Picture: Pyramid Chart Examples
Related Solutions:
Create bar charts for business management problem solving and data comparison using the ConceptDraw DIAGRAM diagramming and vector drawing software extended with the Bar Graphs Solution from the Graphs and Charts area of ConceptDraw Solition Park.
Picture: Bar Diagrams for Problem Solving.Create business management bar charts with Bar Graphs Solution
Related Solution:
The affinity diagram is a business tool used to organize ideas and data. It is one of the Seven Management and Planning Tools. But how design the Affinity Diagram quick and easy? ConceptDraw DIAGRAM diagramming and vector drawing software offers the Seven Management and Planning Tools Solution from the Management Area.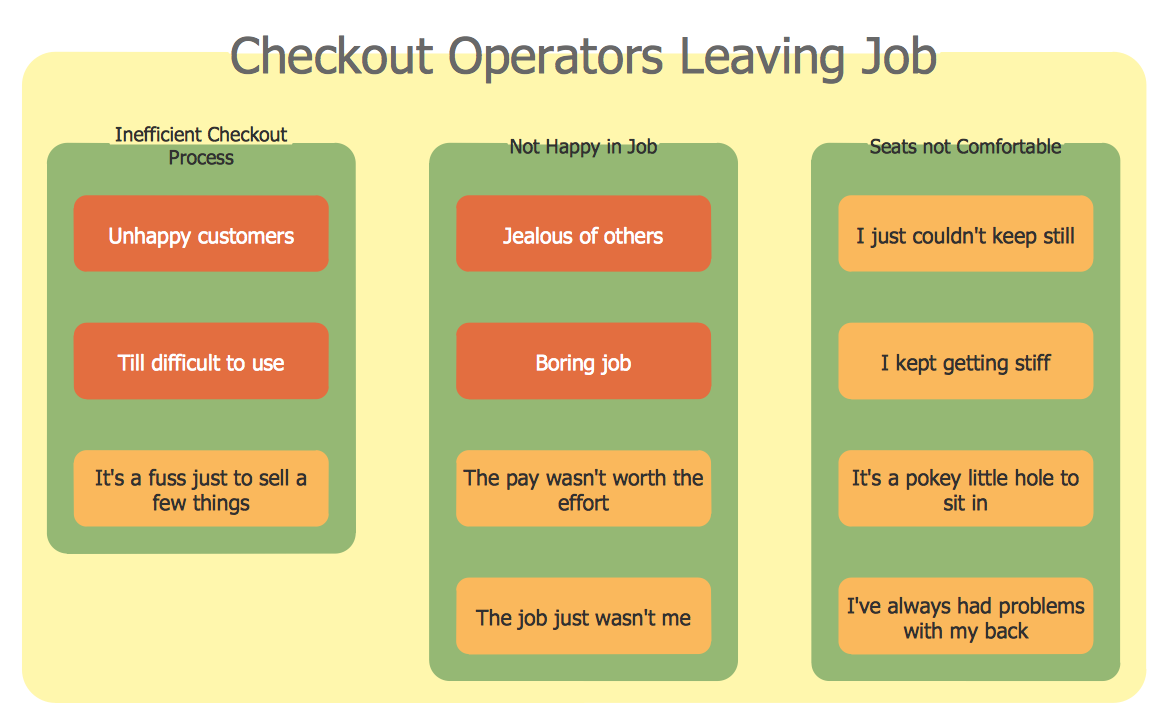
Picture: Affinity Diagram
Related Solution:
ConceptDraw DIAGRAM diagramming and vector drawing software extended with Physics solution from the Science and Education area is the best for creating: physics diagrams, pictures which describe various physical facts and experiments, illustrations of various electrical, mechanical and optic processes, of any complexity quick and easy.
Picture: Physics Diagrams
Related Solution:
Venn diagrams are illustrations used in the branch of mathematics known as set theory.
Create your Venn diagrams for logic problem solving using the ConceptDraw DIAGRAM software
Picture:
Venn Diagram Examples for Problem Solving
Venn Diagram as a Truth Table
Related Solution:
ConceptDraw
DIAGRAM 18