Empower Your Sales Team With a Sales Dashboard
Sales Dashboard Solution
ConceptDraw DIAGRAM is a dashboard software that provide effectiveness to your business. The Sales Dashboard Solution for ConceptDraw gives users the ability to use live data to drive dashboards that show performance in a wide variety of graphs.
Pic. 1. Sales Dashboard Sample
THREE RELATED HOW TO's:
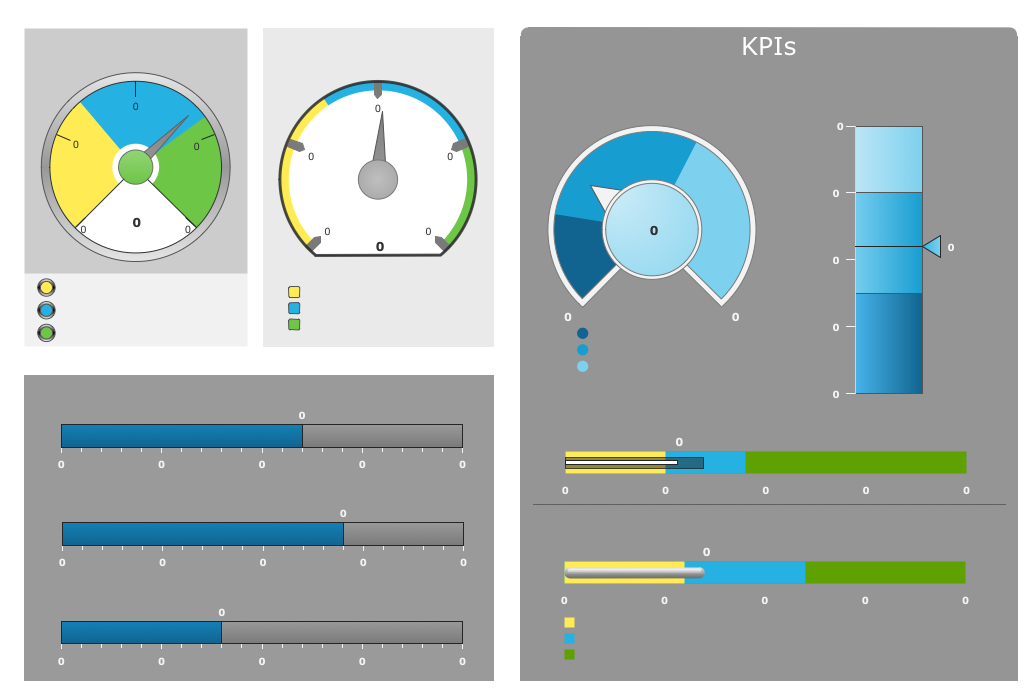
Sales dashboard is a tool that provides the answers to all questions your sales team may have. A mature sales dashboard provides complete set of KPI to shows corporate, team or personal performance to keep sales process clear.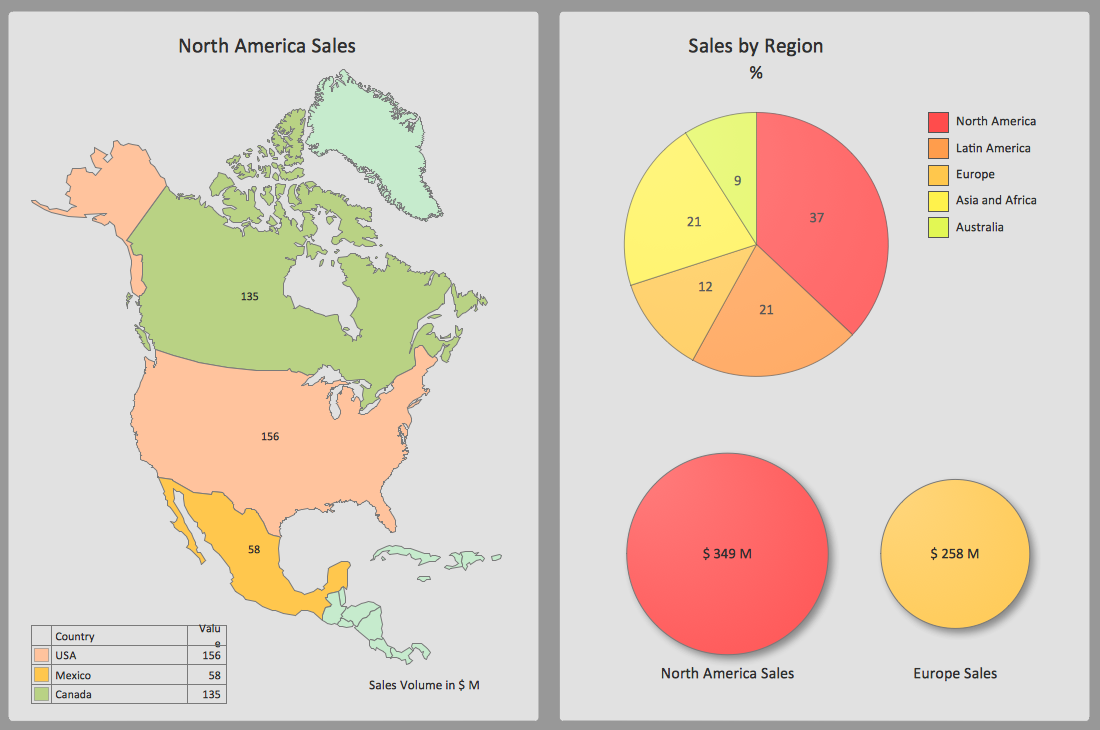
Picture: A KPI Dashboard Providesthe Answers Your Sales Team
ConceptDraw DIAGRAM software extended with the Sales Dashboard solution allows you produce sales dashboards for your company easily. You can start from samples and templates delivered with the solution and then modify them to get a dashboard that suites your specific needs.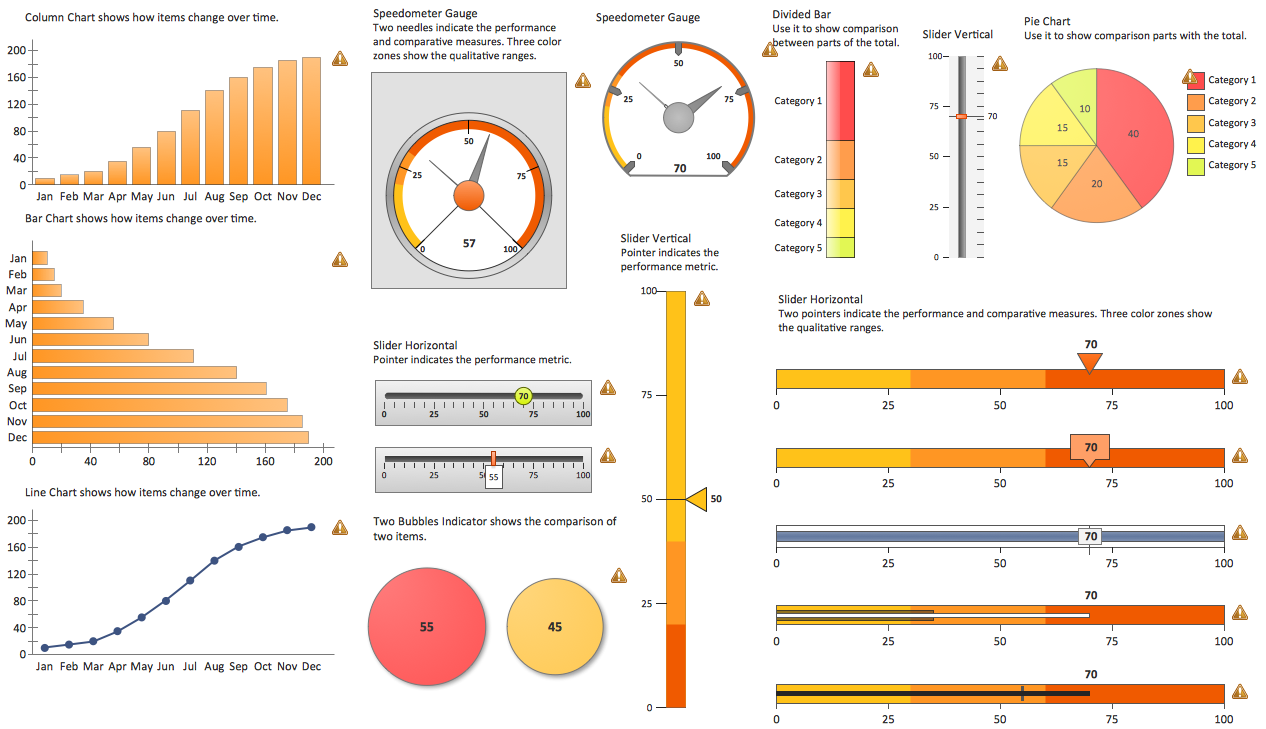
Picture: Sales Dashboards for Your Company
ConceptDraw Sales Dashboard gives you a clear insight about potential opportunities and key sales operations. Analysing sales KPI is a proven way to see how your business can improve.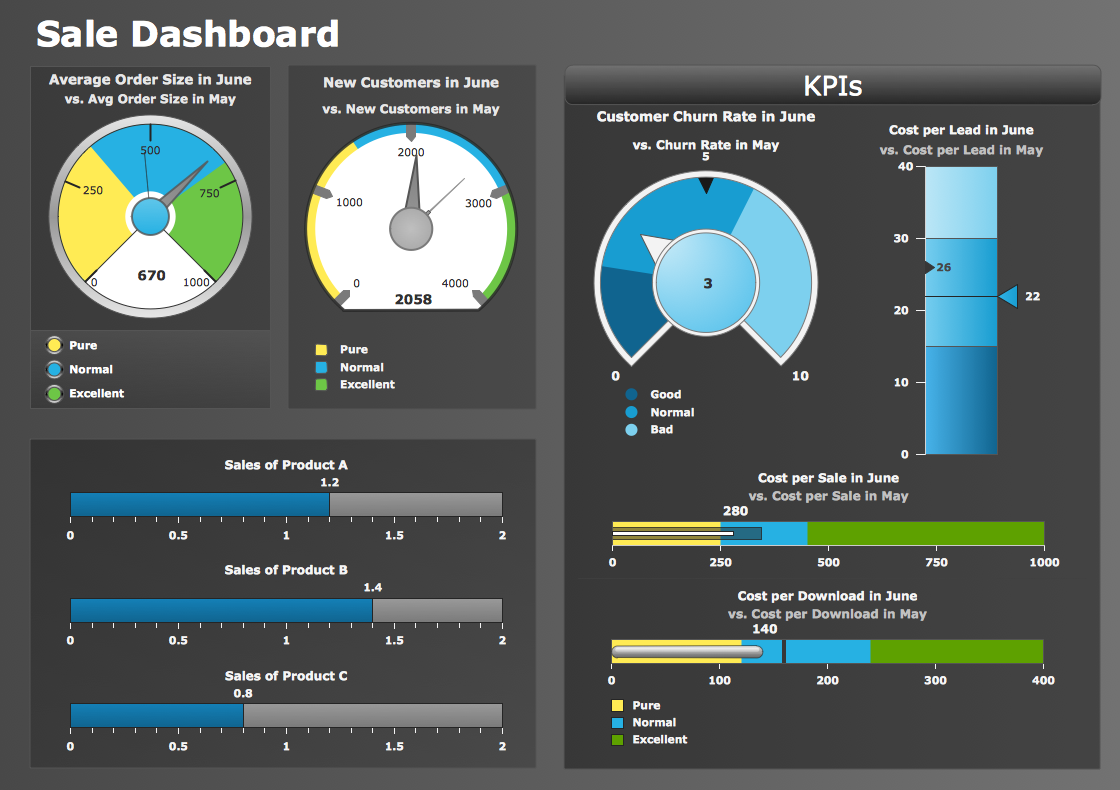
Picture: Sales Dashboard - insight about potential opportunities and key sales operations
ConceptDraw
DIAGRAM 18