Sales Dashboard Examples
Sales Dashboard Solution
The Sales Dashboard Solution gives users the ability to use live data to drive displays that show sales performance in a wide variety of graphs and allows users to use sales data to benchmark performance, predict long-term trends and set goals for their sales teams. The clean and dynamic dashboard samples with data-driven objects that are updates as the data changes.
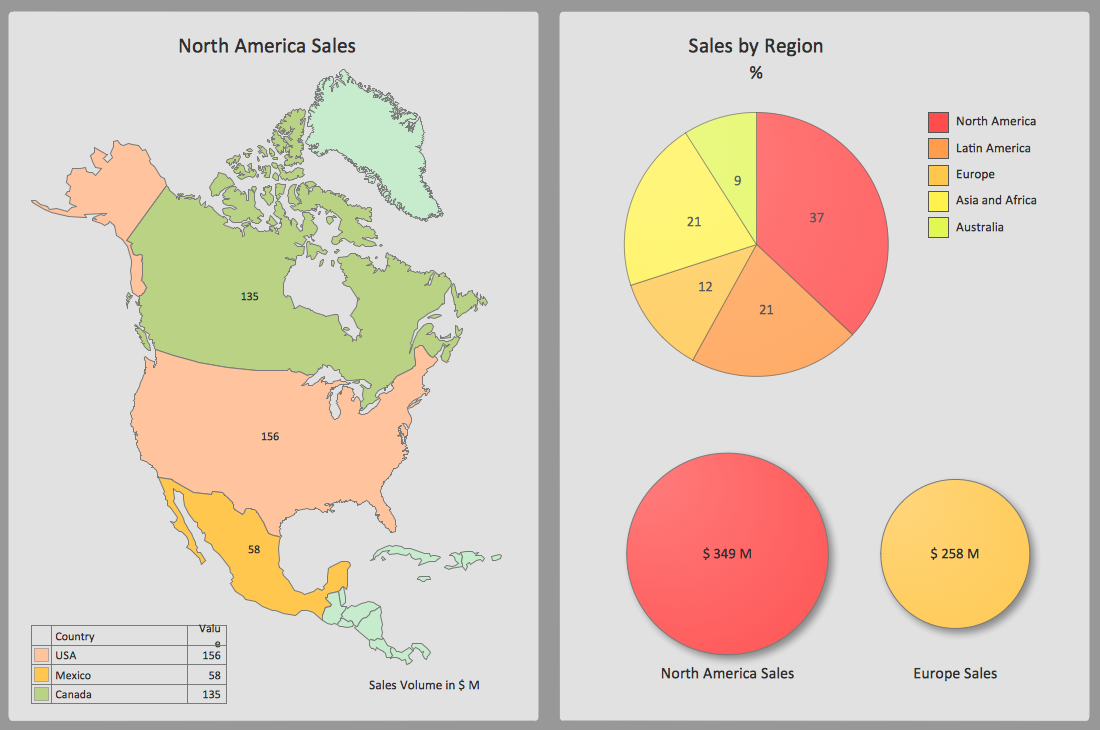
Pic. 1. Sales Geographically Dashboard
THREE RELATED HOW TO's:
Data visualization solutions help you to see how your business can improve. Visualizing sales data using ConceptDraw Sales Dashboard gives you a bird's-eye view of the sale process.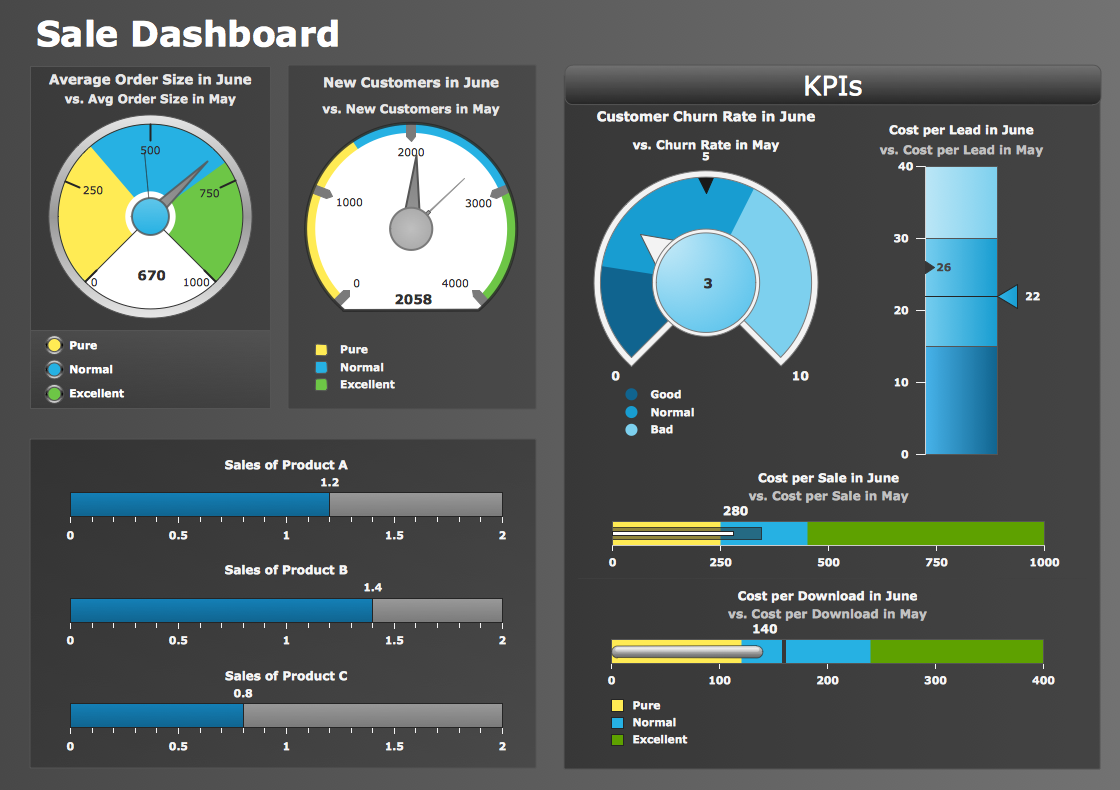
Picture: Data Visualization Solutions
ConceptDraw DIAGRAM diagramming and vector drawing software supplied with Sales Dashboard solution provides the full set of useful tools which make it the best for producing the live KPI Dashboard of any complexity.
Picture: KPI Dashboard
Related Solution:
Visualizing sales data help you see the facts and KPIs about your sales process to make conclusions and see how your business can improve.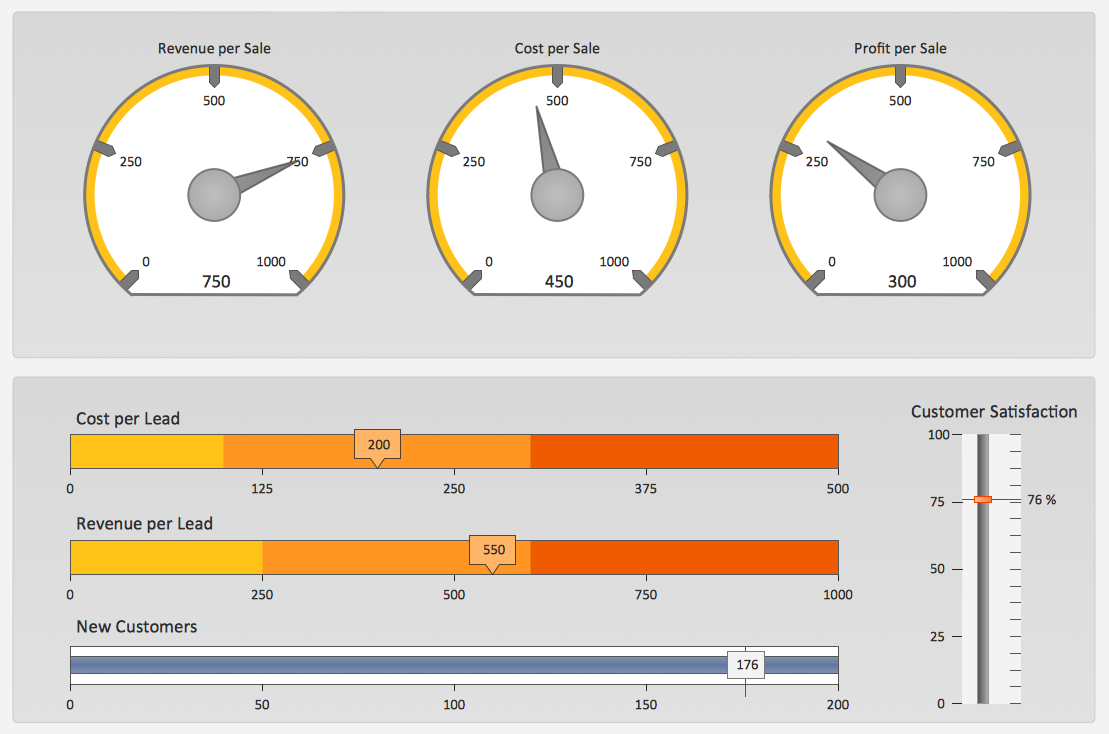
Picture: The Facts and KPIs
ConceptDraw
DIAGRAM 18