Types of Flowcharts
A Flowchart is a graphical representation of process, algorithm, workflow or step-by-step solution of the problem. It shows the steps as boxes of various kinds and connects them by arrows in a defined order depicting a flow. There are twelve main Flowchart types: Basic Flowchart, Business Process Modeling Diagram (BPMN), Cross Functional Flowchart, Data Flow Diagram (DFD), IDEF (Integrated DEFinition) Flowchart, Event-driven Process Chain (EPC) Diagram, Influence Diagram (ID), Swimlane Flowchart, Process Flow Diagram (PFD), Specification and Description Language (SDL) Diagram, Value Stream Mapping, Workflow Diagram. Using the Flowcharts solution from the Diagrams area of ConceptDraw Solution Park you can easy and quickly design a Flowchart of any of these types. This solution offers a lot of special predesigned vector symbols for each of these widely used notations. They will make the drawing process of Flowcharts much easier than ever. Pay also attention for the included collection of ready Flowchart examples, samples and quick-start templates. This is business process improvement tools. If you are looking for MS Visio for your Mac, then you are out of luck, because it hasn't been released yet. However, you can use Visio alternatives that can successfully replace its functions. ConceptDraw PRO is an alternative to MS Visio for Mac that provides powerful features and intuitive user interface for the same.
Process Flowchart
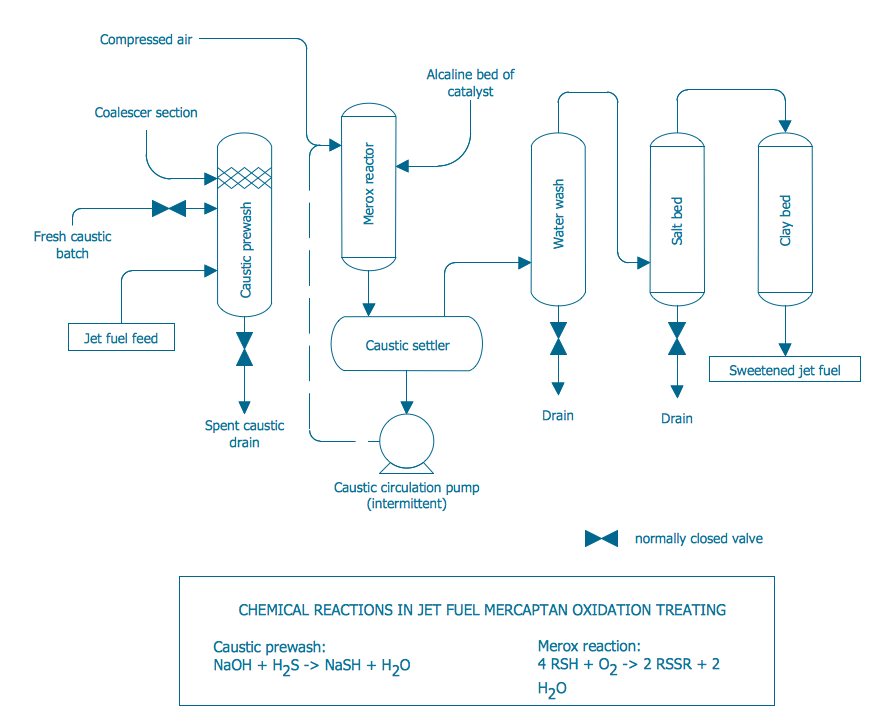
The main reason of using Process Flowchart or PFD is to show relations between major parts of the system. Process Flowcharts are used in process engineering and chemical industry where there is a requirement of depicting relationships between major components only and not include minor parts. Process Flowcharts for single unit or multiple units differ in their structure and implementation. ConceptDraw PRO is Professional business process mapping software for making Process flowcharts, Process flow diagram, Workflow diagram, flowcharts and technical illustrations for business documents and also comprehensive visio for mac application. Easier define and document basic work and data flows, financial, production and quality management processes to increase efficiency of your business with ConcepDraw PRO. Business process mapping software with Flowchart Maker ConceptDraw PRO includes extensive drawing tools, rich examples and templates, process flowchart symbols and shape libraries, smart connectors that allow you create the flowcharts of complex processes, process flow diagrams, procedures and information exchange. Process Flowchart Solution is project management workflow tools which is part ConceptDraw Project marketing project management software. Drawing charts, diagrams, and network layouts has long been the monopoly of Microsoft Visio, making Mac users to struggle when needing such visio alternative like visio for mac, it requires only to view features, make a minor edit to, or print a diagram or chart. Thankfully to MS Visio alternative like ConceptDraw PRO software, this is cross-platform charting and business process management tool, now visio alternative for making sort of visio diagram is not a problem anymore however many people still name it business process visio tools.
Process Engineering
ConceptDraw PRO diagramming and vector drawing software supplied with Chemical and Process Engineering Solution from the Industrial Engineering Area of ConceptDraw Solution Park is powerful and effective process engineering software.Mathematics Symbols
ConceptDraw PRO extended with Mathematics solution from the Science and Education area is a powerful diagramming and vector drawing software that offers all needed tools for mathematical diagrams designing. Mathematics solution provides 3 libraries with predesigned vector mathematics symbols and figures: Solid Geometry Library, Plane Geometry Library and Trigonometric Functions Library.Process Diagrams
ConceptDraw PRO diagramming and vector drawing software extended with Chemical and Process Engineering Solution from the Industrial Engineering Area of ConceptDraw Solution Park offers you the set of useful tools for easy drawing various Process Diagrams.Process Flow Chart
A Process Flow Chart is a type of flowchart which is mostly used in industrial, chemical and process engineering for illustrating high-level processes, major plant processes and not shows minor details. ConceptDraw PRO diagramming and vector drawing software extended with Flowcharts Solution from the "Diagrams" Area of ConceptDraw Solution Park is the best way to create Process Flow Chart and other types of flowcharts.Technical Flow Chart
Flow chart is a diagrammatic representation of an algorithm and essential part of planning the system. Flow charts are widely used in technical analysis and programming for easy writing programs and explaining them to others. So, one of the most popular type of flow charts is Technical Flow Chart. Technical Flow Chart can be drawn by pencil on the paper, but it will be easier to use for designing a special software. ConceptDraw PRO diagramming and vector drawing software extended with Flowcharts Solution from the "Diagrams" Area of ConceptDraw Solution Park will be useful for this goal.Process Flow Maps
What is a Process Flow Map? It is a chart which visually illustrates a business process and how its steps work together. Process Flow Maps help companies define problem areas, inefficient activities for the purpose of further increasing performance and profitability of businesses. ConceptDraw PRO diagramming and vector drawing software extended with Flowcharts solution from the "Diagrams" area of ConceptDraw Solution Park is efficient and productive software for fast and simple creating professional looking Process Flow Map.Technical Drawing Software
Technical drawing or draft is a form of specialized graphic communication, exchange of ideas in industry and engineering. It is a visual representation of object with indication of dimensions and used material, constructed with maintaining the proportions between its parts. Technical drawings are constructed by architects, technologists, engineers, designers, drafters, and other technical professionals according to defined rules, specifications, internationally accepted standards and standardized notations allowing to make unambiguous, clear and understandable technical drawings. ConceptDraw PRO extended with Electrical Engineering solution, Mechanical Engineering solution, Chemical and Process Engineering solution from Industrial Engineering Area of ConceptDraw Solution Park is ideal technical drawing software. Its powerful drawing tools, predesigned vector objects, templates, samples are helpful for creation all kinds of Technical Drawings and Technical Diagrams, Electrical and Mechanical Schematics, Circuit and Wiring Diagrams, Structural Drawings, and many other.SDL Flowchart Symbols
Drawing the diagrams we try to find in help the powerful software and now we have the ConceptDraw PRO. The ability easily create the SDL diagrams is made possible thanks to unique Specification and Description Language (SDL) Solution from the Industrial Engineering Area of ConceptDraw Solution Park. This solution extends ConceptDraw PRO 2 libraries - SDL Connectors and SDL Diagrams that contain 70 predesigned SDL flowchart symbols.Work Flow Process Chart
Workflow Diagram - workflow process diagram is a visual representation of a organizational process flow. Often it used as the same visual notation as process flow diagram. Visualising business processes using workflow diagram (workflow process diagram) allows estimate business process efficiency, analyse and optimize the process itself. Workflow diagram helps get focusing on each step and relations between workflow steps. ConceptDraw PRO is software for making workflow diagram. It contains specific designed graphics to draw workflow diagrams effectively. This is workflow diagram maker which do your work process effective.Processing Flow Chart
Processing Flow Chart is a simplified sketch which is used in chemical and process engineering for illustrating general plant streams, major equipments and key control loops.ConceptDraw PRO enhanced with Flowcharts Solution from the "Diagrams" Area of ConceptDraw Solution Park is a powerful Processing Flow Chart software which will help save lots of your time.
AWS
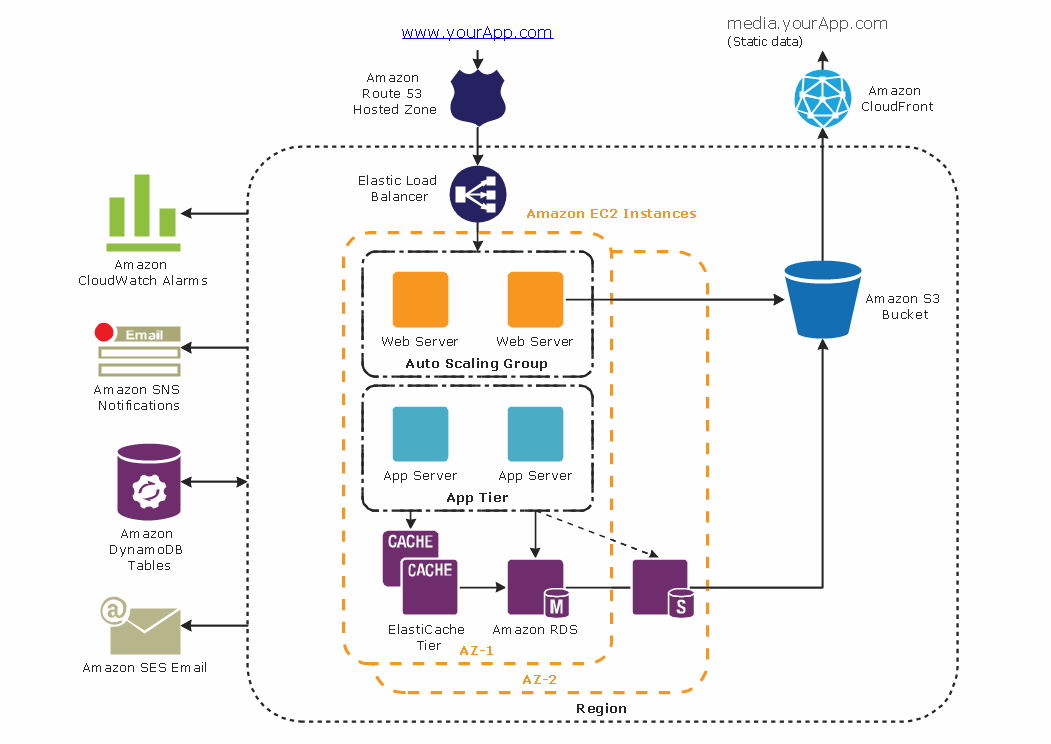
The AWS diagrams are convenient way for explaining the work of Amazon Web Services. ConceptDraw PRO diagramming and vector drawing software offers the AWS Architecture Diagrams Solution from the Computer and Networks Area for fast and easy creating the AWS diagrams of any complexity.Audit Flowchart Symbols
The audit is a complex process consisting of defined quantity of steps, which have as a final goal the ensuring of success of a certain business project. It includes the independent examination of data, statements and financial performances of an enterprise for a stated purpose. It is convenient to construct the Audit Flowcharts or Audit Diagrams for visual representation and structuring the audit processes. ConceptDraw PRO diagramming software enhanced with Audit Flowcharts solution from the Finance and Accounting area of ConceptDraw Solution Park effectively helps to draw the Audit Diagrams for accounting, finance and money management, the Audit Flowcharts for fiscal information tracking, financial inventories and documenting Six Sigma, the decision making Flow Charts, etc. This solution provides the powerful drawing tools, numerous templates and samples, and large quantity of vector audit flowchart symbols that greatly facilitate the process of representation the audit steps and audit results, and designing efficient and visually appealing Audit Flowcharts.Flowchart Software
A Flowchart visualizes a process or algorithm of a program as step blocks composed of shapes, connected with arrows that show the process flow direction. The Flowcharts give users the ability to represent structural data in a visual form and are widely used to visualize the business and technical processes, as well as software algorithms. ConceptDraw PRO is a powerful Mac OS X and Windows technical diagramming, business diagramming and flowchart drawing software. Numerous vector stencils, built-in templates and samples created by professional designers are included at the basic package. ConceptDraw PRO is a classic flowchart maker, which exactly follows the industry standards and provides ready-to-use flowchart symbols gathered at the solutions of ConceptDraw Solution Park. Use the free trial versions of ConceptDraw PRO software for Mac and PC to experience the powerful possibilities of ConceptDraw PRO in designing the Flowcharts, Flow Diagrams, Business Flow Charts of different types, styles, and degree of complexity.- Process Flowchart | Process Engineering | How to Draw a Chemical ...
- Engineering Separation Operation Symbols
- LLNL Flow Charts | Design elements - Chemical engineering ...
- Process Flowchart | Types of Flowcharts | Process Engineering ...
- Process Flowchart | Process Engineering | Types of Flowcharts ...
- Process Flowchart | Types of Flowcharts | SDL Flowchart Symbols ...
- Process Flowchart | How to Draw a Chemical Process Flow Diagram ...
- Process Flowchart | Design elements - Industrial equipment ...
- Process Flowchart | How to Draw a Chemical Process Flow Diagram ...
- How to Draw a Chemical Process Flow Diagram | Chemical and ...
- Design elements - Chemical engineering | Process Flowchart ...
- Type Of Chemical Symbol
- Process Flowchart | Design elements - Chemical engineering ...
- Chemical and Process Engineering | Process Flow Diagram ...
- Symbols Used In Flowchart For Chemical Engineering
- Basic Flowchart Symbols and Meaning | Process Flowchart | Data ...
- Process Flowchart | Types of Flowcharts | How to Draw a Chemical ...
- Process Flowchart | How to Draw a Chemical Process Flow Diagram ...
- General Presentation Of Chemistry With Flow Charts


