"Classic TQM Tools ...
Flow Charts Pictures, symbols or text coupled with lines, arrows on lines show direction of flow. Flowcharting enables
modeling of processes; problems/ opportunities and decision points etc. It develops a common understanding of a process by those in
volved." [whaqualitycenter.org/ Portals/ 0/ Tools%20 to%20 Use/ Classic%20 Quality%20 Tools/ Classic%20 TQM%20 Tools%20 R%20 2-12.pdf]
The vector stencils library TQM diagrams contains 58 symbols for drawing total quality management (TQM) flow charts using the ConceptDraw PRO diagramming and vector drawing software.
The example "Design elements - TQM diagram" is included in the Total Quality Management (TQM) Diagrams solution from the Quality area of ConceptDraw Solution Park.
 Cross-Functional Flowcharts
Cross-functional flowcharts are powerful and useful tool for visualizing and analyzing complex business processes which requires involvement of multiple people, teams or even departments. They let clearly represent a sequence of the process steps, the order of operations, relationships between processes and responsible functional units (such as departments or positions).
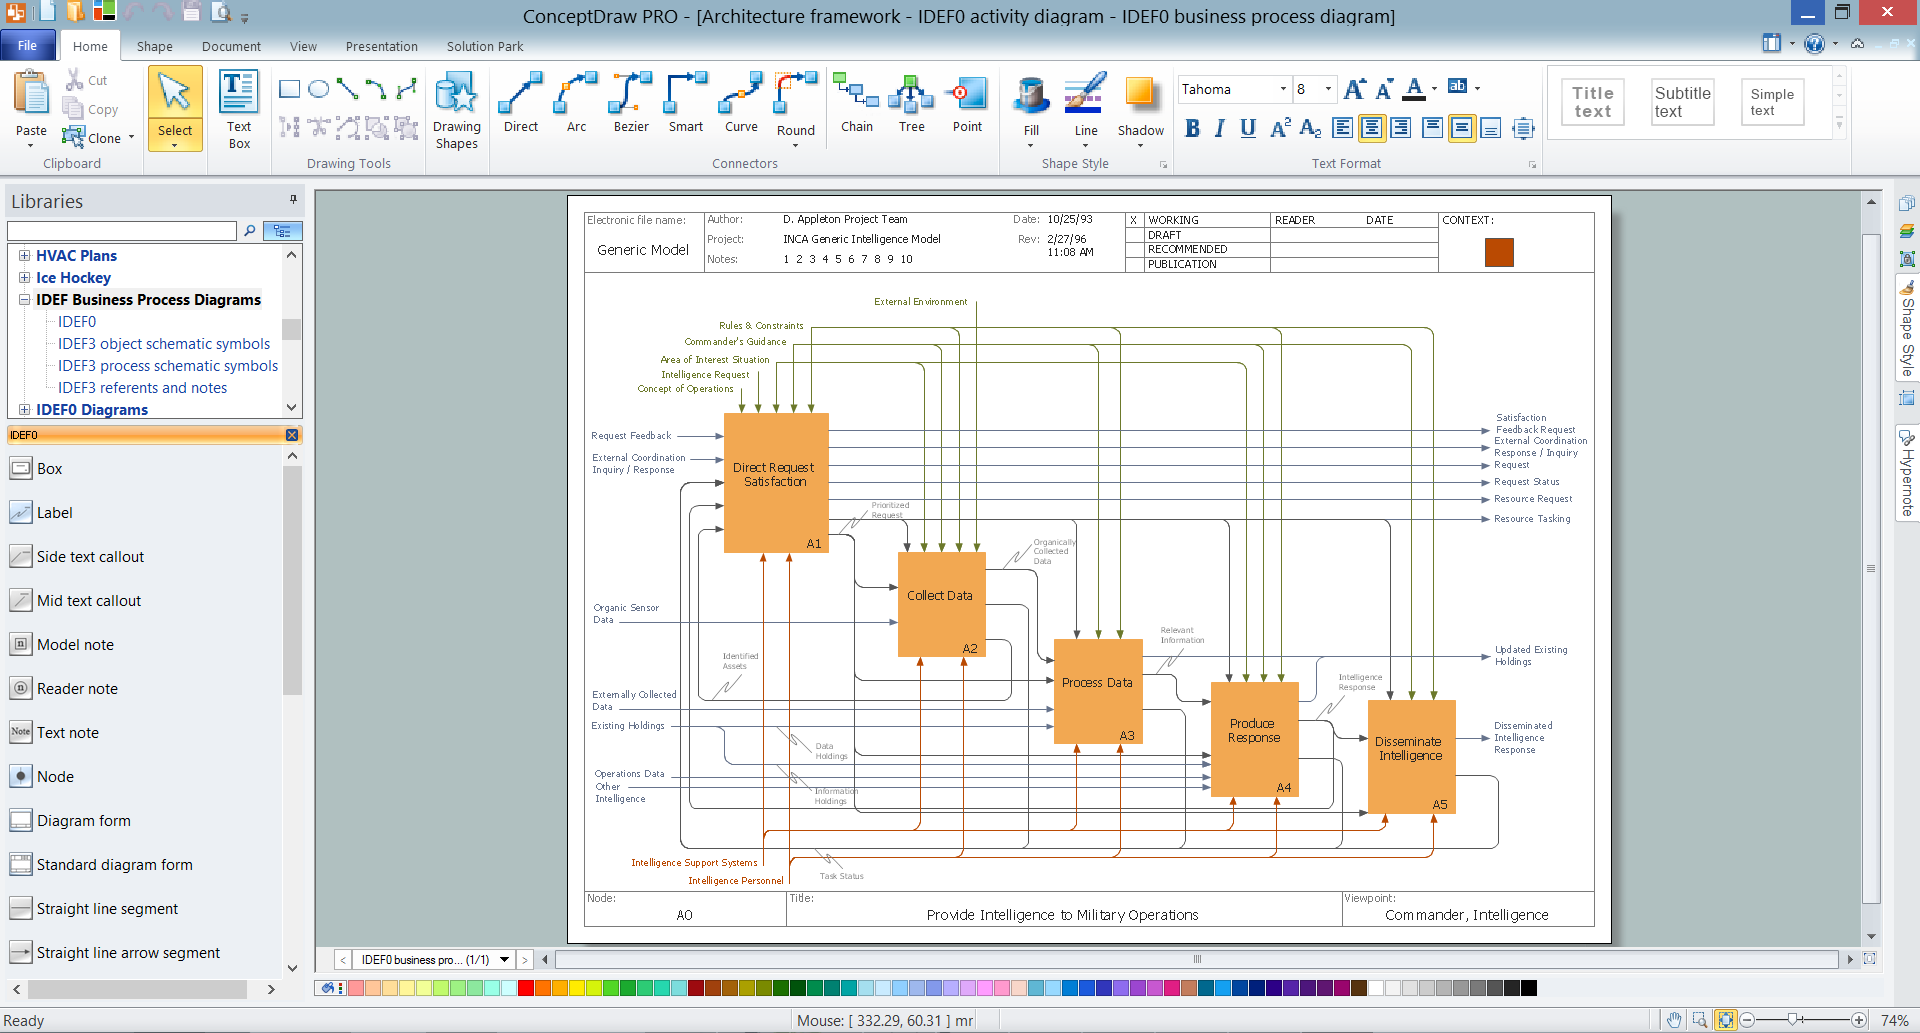
 IDEF0 Diagrams
IDEF0 Diagrams solution extends ConceptDraw PRO software with templates, samples and library of vector stencils for drawing the IDEF0 diagrams.
 Cafe and Restaurant Floor Plans
Restaurants and cafes are popular places for recreation, relaxation, and are the scene for many impressions and memories, so their construction and design requires special attention. Restaurants must to be projected and constructed to be comfortable and e
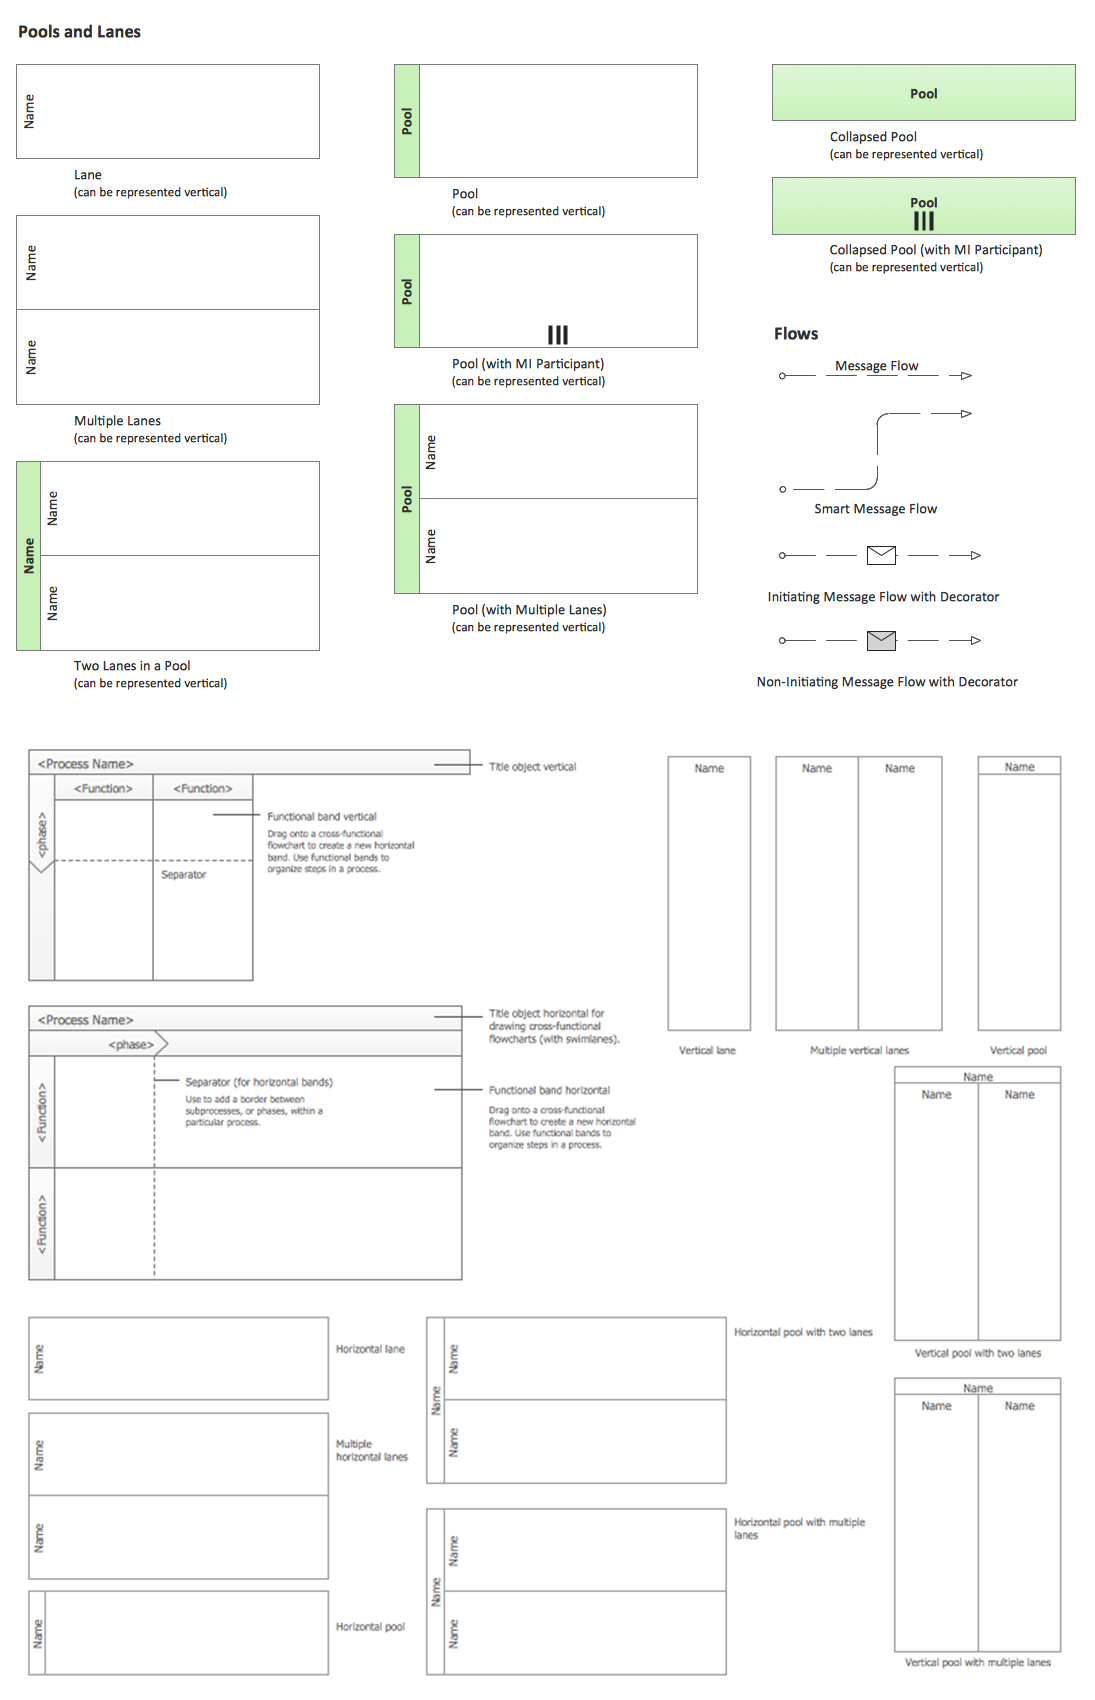
Business Process Elements: Swimlanes
ConceptDraw has 142 vector stencils in the 8 libraries that helps you to start using software for designing own Business Process Diagrams. Use Swimlanes library with 20 objects from BPMN.
 IDEF Business Process Diagrams
Use the IDEF Business Process Diagrams solution to create effective database designs and object-oriented designs, following the integration definition methodology.
Database Design
ConceptDraw PRO extended with IDEF Business Process Diagrams solution from the Business Processes area of ConceptDraw Solution Park is an ideal software for effective database design and drawing IDEF diagrams visually representing all steps of database design process.
 Scatter Diagrams
The Scatter Diagrams solution extends ConceptDraw PRO v10 functionality with templates, samples, and a library of vector stencils that make construction of a Scatter Plot easy. The Scatter Chart Solution makes it easy to design attractive Scatter Diagrams used in various fields of science, work, and life activities. ConceptDraw PRO lets you enter the data to the table and construct the Scatter Plot Graph automatically according to these data.
 Graphic User Interface
Graphic User Interface solution extends ConceptDraw PRO software with templates, samples and libraries of vector stencils for design of the GUI prototypes and diagrams for Windows, Mac OS and iOS software.
- Pdf Of 20 Flow Chart And Their Functions
- Flowchart Symbols And Functions Pdf
- 20 Flowcharts Draw And Their Functions Pdf
- 20 Flowchart And Its Function
- 20 Diagrams Of Flowchart And Their Function And Notation Pdf
- Draw 20 Flow Charts And Their Uses
- System Flowchart Symbols And Functions Pdf
- 20 Flowchart And Their Functions
- Draw 20 Flow Chart And Their Function
- Draw 20 Flowcharts And Their Function
- Draw 20 Flow Chart And The Uses
- 20 Flow Charts Their Symbols And Their Uses Pdf
- Draw 20 Flow Charts And Their Function
- 20 Diagrams Of Flowchart Symbols And Their Functions And
- Flow Chart Symbols And There Functions Pdf
- System Flowchart Symbols Pdf
- 20 Flow Chat Symbol And Their Functions
- 20 Flow Charts Of Symbols And Their Function
- Draw 20 Flow Chat And Their Functions


