Network Drawing Software
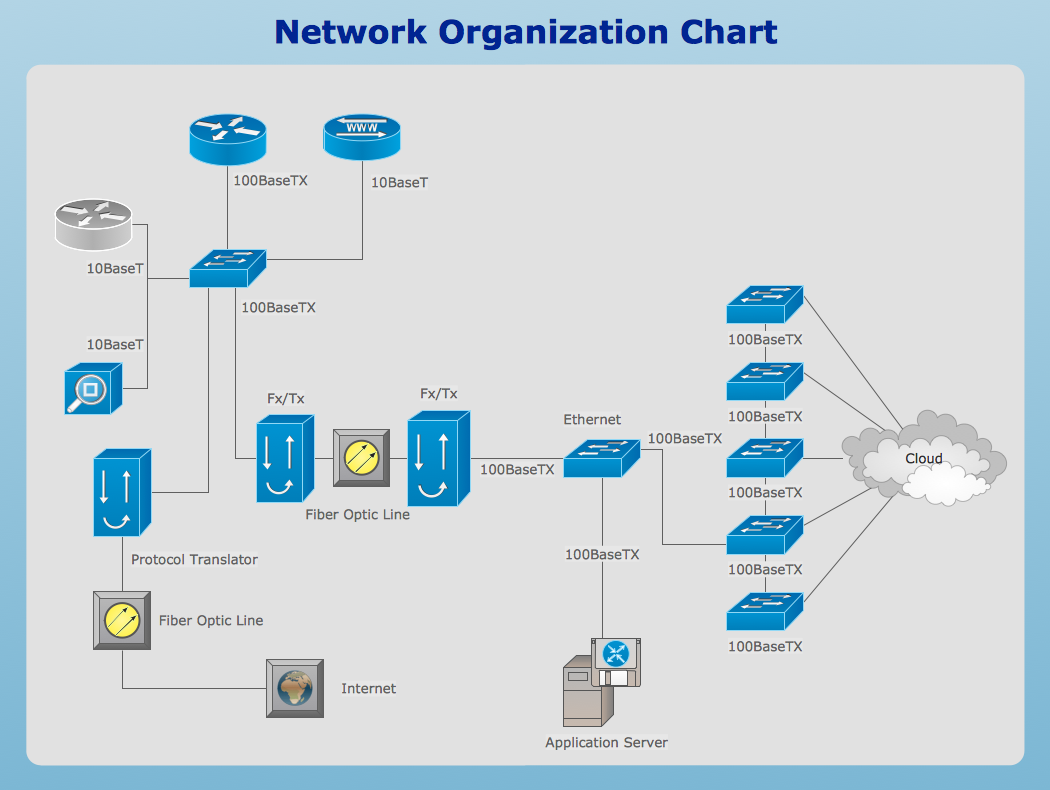
ConceptDraw Network Drawing Software - Network design software for network drawings with abundant examples and templates. Create computer network designs, diagrams and schematics using ConceptDraw.
 Bar Graphs
The Bar Graphs solution enhances ConceptDraw PRO v10 functionality with templates, numerous professional-looking samples, and a library of vector stencils for drawing different types of Bar Graphs, such as Simple Bar Graph, Double Bar Graph, Divided Bar Graph, Horizontal Bar Graph, Vertical Bar Graph, and Column Bar Chart.
HelpDesk
How to Create a Bar Chart in ConceptDraw PRO
Bar charts (bar graphs) are diagrams displaying data as horizontal or vertical bars of certain heights. Bar charts are widely used to show and compare the values of the same parameters for different data groups. The bar graph can be vertical or horizontal. This depends on the amount of categories. There are many methods in which bar graph can be built and this makes it a very often used chart type. Usually, a bar chart is created so that the bars are placed vertically. Such arrangement means that the bar's height value is proportional to the category value. Nevertheless, a bar chart can be also drawn horizontally. This means that the longer the bar, the bigger the category. Thus, a bar chart is a good way to present the relative values of different measured items. The ConceptDraw Bar Graphs solution allows you to draw a bar chart quickly using a vector library, containing the set of various bar charts objects."Bars categorized by the kind of entertainment they offer include:
(1) Blues bars, specializing in the live blues style of music.
(2) Comedy Bar specializing in a stand-up comedy entertainment.
(3) Dance bars, which have a dance floor where patrons dance to recorded music.
(4) But if a dance bar has a large dance floor and hires well-known professional DJs, it is considered to be a nightclub or discothèque.
(5) Karaoke bars, with nightly karaoke as entertainment.
(6) Music bars, specializing in live music (i.e. concerts).
(7) Drag bars, which have live shows, where men dress as women and generally lip-sync to recordings of female vocal artists; often with hilarious results.
(8) Salsa bars, where patrons dance to Latin salsa music.
(9) Sports bars, where sports fans watch games on large-screen televisions.
(10) Topless bars, where topless female employees dance or serve drinks." [Bar (establishment). Wikipedia]
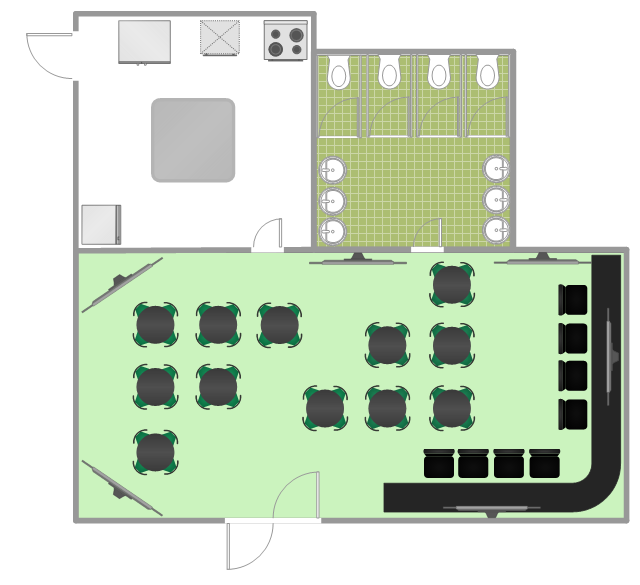
The floor plan example "Sports bar" was created using the ConceptDraw PRO diagramming and vector drawing software extended with the Cafe and Restaurant solution from the Building Plans area of ConceptDraw Solution Park.
HelpDesk
How to Draw a Histogram in ConceptDraw PRO
Histogram is a diagram used to visualize data through bars of variable heights. Making histogram can be helpful if you need to show data covering various periods (hours, days, weeks, etc). When the vertical column of the histogram refer to frequency it shows how many times any event happens. It is a Frequency histogram. A bar chart diagram is similar to a histogram, but in contrast to a bar chart a histogram represents the number how many times there have been certain data values. You can use a histogram to depict continual data flow such as temperature, time, etc. You can effortlessly draw histograms using the Histograms solution for CnceptDraw PRO. Making a histogram can by very useful to represent various statistical data.- Cafe 3d And Florr Plan And Site Plan
- How To Create Restaurant Floor Plan in Minutes | Sports bar - Floor ...
- How To Create Restaurant Floor Plan in Minutes | 3D Network ...
- How To Create Restaurant Floor Plan in Minutes | Design elements ...
- How To Create Restaurant Floor Plan in Minutes | 3d Kitchen Layout
- Plan 3d De Bar Restaurant
- Restaurant Table Layout Design In 3d
- 3D Network Diagram Software | How To Create Restaurant Floor ...
- Store Layout Software | How To Create Restaurant Floor Plan in ...
- How To Create Restaurant Floor Plan in Minutes | Cafe and ...
- How To Create Restaurant Floor Plan in Minutes | Pyramid Diagram ...
- 3D Network Diagram Software | How To Create Restaurant Floor ...
- 3D Network Diagram Software | How To Create Restaurant Floor ...
- Restaurant 3d Floor Plan
- Restaurant Floor Plan Design 3d
- How To use House Electrical Plan Software | How To Create ...
- How To Create Restaurant Floor Plan in Minutes | Store Layout ...
- Bar Chart Software | Column Chart Software | 3D Network Diagram ...
- Bar Chart Software | Pyramid Charts | Chart Maker for Presentations ...
- 3D Column chart - Iran internet users per 100 person | Column Chart ...


