Account Flowchart Stockbridge System. Flowchart Examples
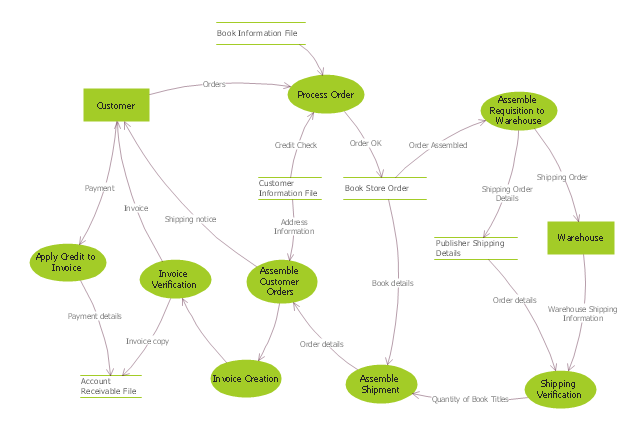
Create your own flow charts of data processing systems using the ConceptDraw DIAGRAM diagramming and vector drawing software extended with the Cross-Functional Flowcharts solution from the Business Processes area of ConceptDraw Solution Park. This is a flowchart of a data processing system combining manual and computerized processing to handle accounts receivable, billing, and general ledger."Data flow diagrams are one of the three essential perspectives of the structured-systems analysis and design method SSADM. The sponsor of a project and the end users will need to be briefed and consulted throughout all stages of a system's evolution. With a data flow diagram, users are able to visualize how the system will operate, what the system will accomplish, and how the system will be implemented. The old system's dataflow diagrams can be drawn up and compared with the new system's data flow diagrams to draw comparisons to implement a more efficient system. Data flow diagrams can be used to provide the end user with a physical idea of where the data they input ultimately has an effect upon the structure of the whole system from order to dispatch to report. How any system is developed can be determined through a data flow diagram model.
In the course of developing a set of levelled data flow diagrams the analyst/ designers is forced to address how the system may be decomposed into component sub-systems, and to identify the transaction data in the data model.
Data flow diagrams can be used in both Analysis and Design phase of the SDLC.
There are different notations to draw data flow diagrams (Yourdon & Coad and Gane & Sarson), defining different visual representations for processes, data stores, data flow, and external entities." [Data flow diagram. Wikipedia]
The DFD (Yourdon and Coad notation) example "Process of account receivable" was created using the ConceptDraw PRO diagramming and vector drawing software extended with the Data Flow Diagrams solution from the Software Development area of ConceptDraw Solution Park.
Accounts Payable Process Flow Chart
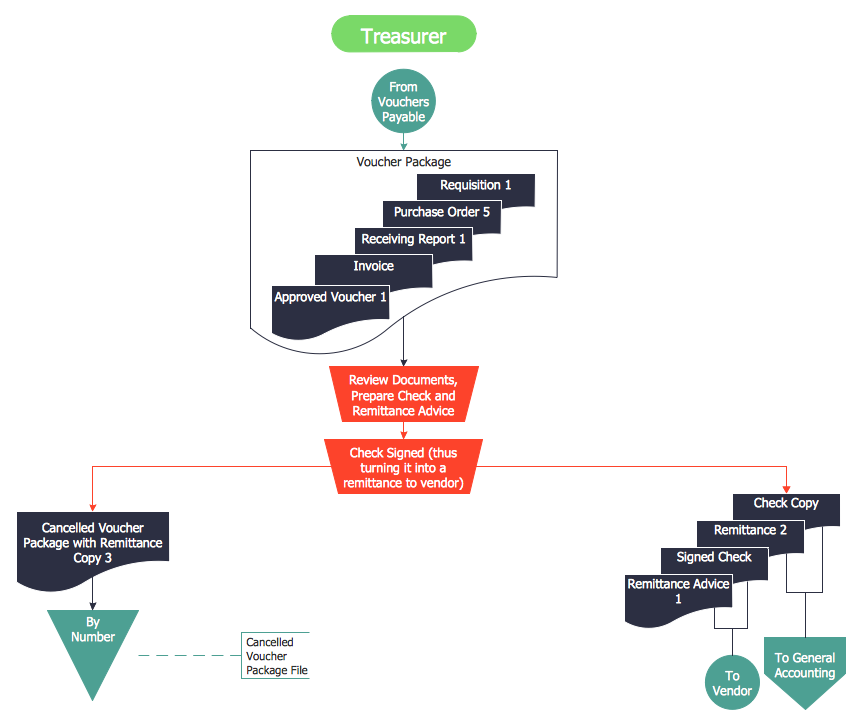
Accounts Payable Process Flow Chart - ConceptDraw DIAGRAM diagramming and vector drawing software extended with Accounting Flowcharts Solution provides the useful tools that will help you create easily and quickly. The Accounts Payable Process Flow Chart is very popular and widely used type of accounting flowcharts. Now their designing is simple thanks to the Accounting Flowcharts Solution that provides the Accounting Flowcharts library of predesigned commonly-used shapes and a set of templates and samples.The vector stencils library "Sales department" contains 49 company department icons.
Use these sales pictograms to draw your sales flowcharts, workflow diagrams and process charts with the ConceptDraw PRO diagramming and vector drawing software.
The vector stencils library "Sales department" is included in the Sales Flowcharts solution from the Marketing area of ConceptDraw Solution Park.
The vector stencils library "HR department" contains 50 workflow symbols.
Use this department icon set to draw your HR process flowcharts, workflow diagrams and infographics with the ConceptDraw PRO diagramming and vector drawing software.
The HR pictograms library "HR department" is included in the HR Flowcharts solution from the Management area of ConceptDraw Solution Park.
Workflow Diagram Symbols
Workflow Diagram is an acknowledged method of drawing the processes and business processes, which uses the concerted set of symbols for depicting different kinds of steps or relations. Often it is named the Process Flow Diagram, but the real Process Flow Diagram uses different visual notations and different flowchart symbols. The professionally designed Workflow diagram also may be used for the same purpose as a Critical process flow diagram. Nevertheless, there are many cases when you may need to make your Workflow Diagram more bright and graphic. ConceptDraw DIAGRAM diagramming software extended with Workflow Diagrams solution from Business Processes area of ConceptDraw Solution Park possesses the powerful properties of software for Workflow diagram design. It delivers rich set of business process workflow diagram symbols, which help users to accurately diagram the workflow scenarios and to design great-looking and attractive Workflow Diagrams and Process Flow Diagrams better-suited for presentations, websites, reports, and other documents.
 Data Flow Diagrams (DFD)
Data Flow Diagrams solution extends ConceptDraw DIAGRAM software with templates, samples and libraries of vector stencils for drawing the data flow diagrams (DFD).
The vector stencils library "Sales department" contains 49 company department icons.
Use these sales pictograms to draw your sales flowcharts, workflow diagrams and process charts with the ConceptDraw PRO diagramming and vector drawing software.
The vector stencils library "Sales department" is included in the Sales Flowcharts solution from the Marketing area of ConceptDraw Solution Park.
Data Flow Diagram Model
Data Flow Diagram (DFD) is a technique of graphical structural analysis, describing the sources external to the system, recipients of data, also logical functions, data flows and data stores that are accessed. The DFD's goal is to show how each process converts its inputs into the outputs and to identify relationships between these processes, at this make the system's description clear and understandable at every level of detail. Historically happened that for describing Data Flow Diagrams are used two notations - Yourdon and Gane-Sarson that differ each from other by graphical representation of symbols. The DFD model, like most other structural models is a hierarchical model. Each process can be subjected to decomposition on the structural components, the relationships between which in the same notation can be shown on a separate diagram. Typically, several DFD models are built when modeling the system. ConceptDraw DIAGRAM software enhanced with Data Flow Diagrams solution ideally suits for creation DFD models and professional drawing Data Flow Diagrams.Design Data Flow. DFD Library
Data flow diagram or DFD is a type of diagrams used for graphical representation the "flow" of data through an information system, for effective modeling its process aspects and for visualization the data processing. They are one of the best tools for clearly making an overview of the system that will be developed, for depiction in details what kinds of information will be inputted to the system and outputted from it, where they will be stored, and other details. ConceptDraw DIAGRAM software with Data Flow Diagrams solution from Software Development area of ConceptDraw Solution Park is powerful in a field of designing the DFDs. Three libraries containing 49 vector DFD shapes and symbols are offered by Data Flow Diagrams (DFD) solution. Use them to design data flow diagrams, information flow diagrams, data flowcharts, data process diagrams, structured analysis diagrams, to create the data-oriented models or process-oriented models, and so on. Pay also attention for the included collection of DFD samples, examples and built-in templates at ConceptDraw STORE.DFD Library — Design elements
Data Flow Diagrams (DFD) solution from the Software Development area of ConceptDraw Solution Park provides plenty of predesigned templates, samples and DFD vector design elements proposed by three DFD libraries. These DFD library objects are designed to help you effectively model the data flows and functional requirements for the business processes or systems, to design the Process-oriented models or Data-oriented models, Data flowcharts and Data process diagrams, Structured analysis diagrams and Information flow diagrams. There are two different notations used to draw the Data Flow Diagrams (Yourdon & Coad and Gane & Sarson). These notations define the different visual representations for the processes, data stores, data flows, and external entities. ConceptDraw DIAGRAM software provides you with possibility of designing professional-looking Data Flow Diagrams, DFD Models, Data Flow Process Diagrams using any of these notations. Simply drag the predesigned DFD flowchart symbols from the appropriate library and connect by arrows depicting the data flow from one step to another.- Accounting Flowcharts | How to Create Flowcharts for an Accounting ...
- DFD - Process of account receivable | Data Flow Diagram Process ...
- DFD - Process of account receivable | Data Flow Diagrams ...
- Accounting Flowcharts | Purchase Process Flow Chart . Accounting ...
- Accounts Payable Process Flow Chart | Diagram For Accounts ...
- DFD - Process of account receivable | Data Flow Diagram Process ...
- Accounts Payable Flowchart | Accounts Payable Process Flow Chart ...
- Accounting Process Flowchart Accounts Receivable
- Data Flow Diagram (DFD) | DFD - Process of account receivable ...
- Accounts Payable Flowchart | Accounting Flowcharts | Accounts ...
- Workflow Diagram | Account Flowchart Stockbridge System ...
- Data Flow Diagram Process | DFD - Process of account receivable ...
- Process Flowchart | Data Flow Diagram Process | DFD - Process of ...
- Process Flowchart | DFD - Process of account receivable | Cross ...
- Basic Flowchart Symbols and Meaning | Account Flowchart ...
- Data Flow Diagram Process
- Data Flow Diagram Process
- DFD - Process of account receivable | Data Flow Diagram Process ...
- DFD - Process of account receivable | Data Flow Diagram Process ...
- How to Create Flowcharts for an Accounting Information System ...

