"A swim lane (or swimlane) is a visual element used in process flow diagrams, or flowcharts, that visually distinguishes responsibilities for sub-processes of a business process. Swim lanes may be arranged either horizontally or vertically. In the accompanying example, the swimlanes are named Customer, Sales, Contracts, Legal, and Fulfillment, and are arranged vertically. ...
When used to diagram a business process that involves more than one department, swimlanes often serve to clarify not only the steps and who is responsible for each one, but also how delays, mistakes or cheating are most likely to occur.
Many process modeling methodologies utilize the concept of swimlanes, as a mechanism to organize activities into separate visual categories in order to illustrate different functional capabilities or responsibilities (organisational roles). Swimlanes are used in Business Process Modeling Notation (BPMN) and Unified Modeling Language activity diagram modeling methodologies." [Swim lane. Wikipedia]
The template "UML activity diagram (swimlanes)" for the ConceptDraw PRO diagramming and vector drawing software is included in the Rapid UML solution from the Software Development area of ConceptDraw Solution Park.
www.conceptdraw.com/ solution-park/ software-uml
UML activity diagram (swimlanes)
-uml-activity-diagram-(swimlanes)---template.png--diagram-flowchart-example.png)
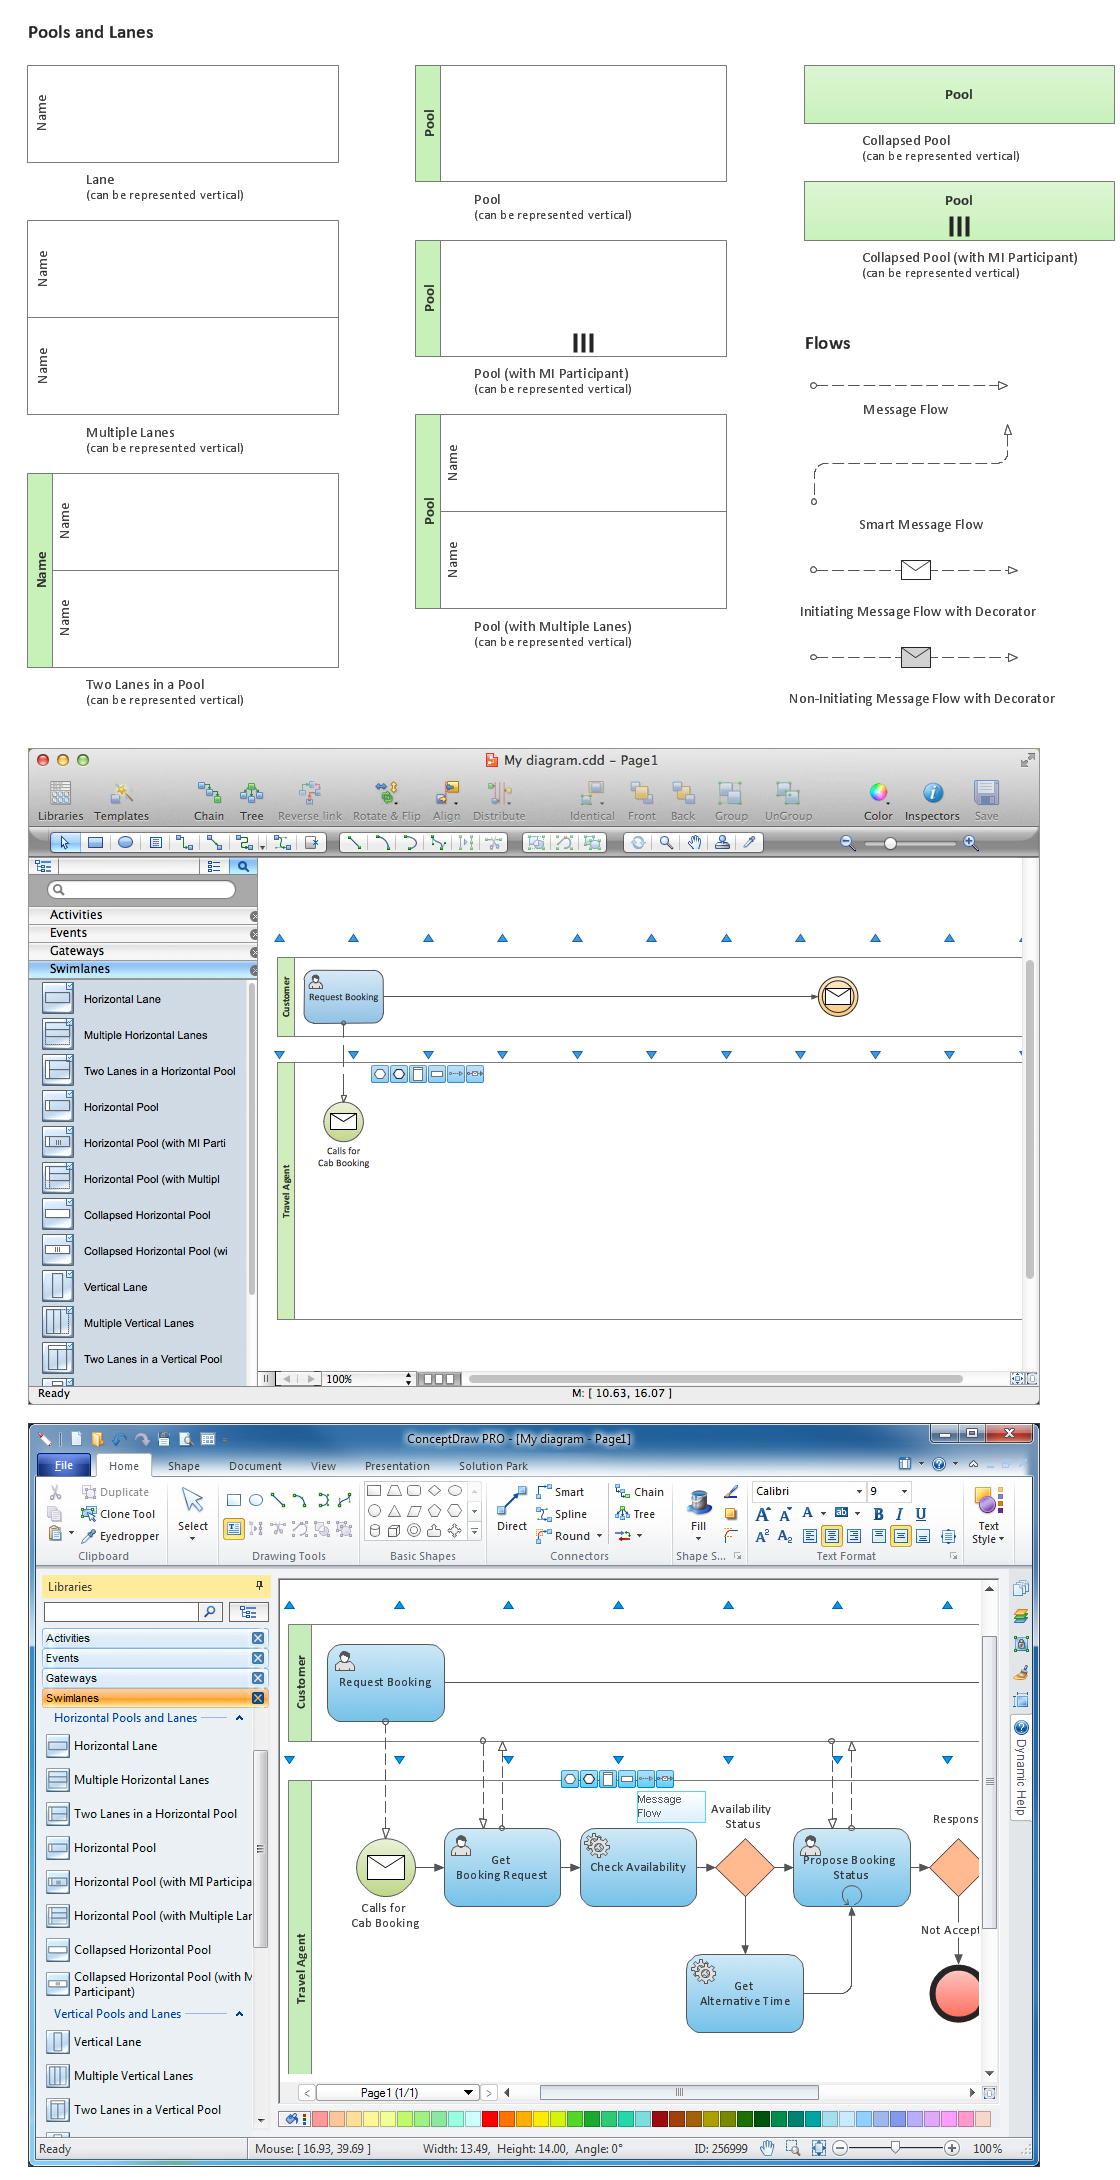
Business Process Elements: Swimlanes


Swim Lane Flowchart Symbols

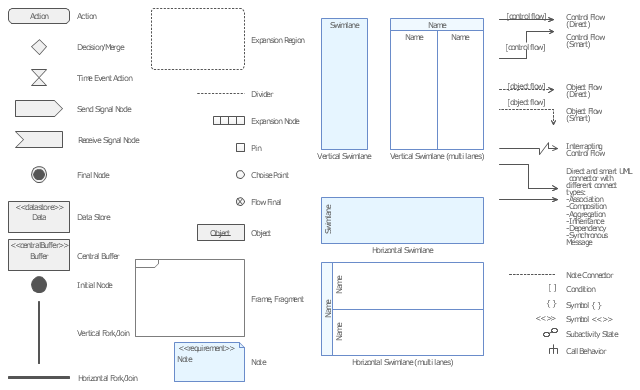
Diagramming Software for Design Business Process Diagrams
Cross-Functional Flowchart


The vector stencils library "UML activity diagrams" contains 37 symbols for the ConceptDraw PRO diagramming and vector drawing software.
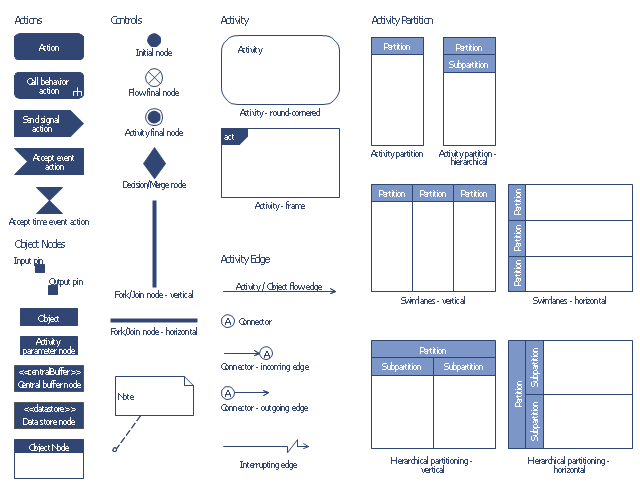
"Activity diagrams are constructed from a limited number of shapes, connected with arrows. The most important shape types:
(1) rounded rectangles represent actions;
(2) diamonds represent decisions;
(3) bars represent the start (split) or end (join) of concurrent activities;
(4) a black circle represents the start (initial state) of the workflow;
(5) an encircled black circle represents the end (final state).
Arrows run from the start towards the end and represent the order in which activities happen.
Hence they can be regarded as a form of flowchart. Typical flowchart techniques lack constructs for expressing concurrency. However, the join and split symbols in activity diagrams only resolve this for simple cases; the meaning of the model is not clear when they are arbitrarily combined with decisions or loops." [Activity diagram. Wikipedia]
The example "Design elements - UML activity diagrams" is included in the Rapid UML solution from the Software Development area of ConceptDraw Solution Park.
UML activity diagram symbols
The vector stencils library "Bank UML activity diagram" contains 32 shapes of UML activity diagram.
Use it for object-oriented modeling of your bank information system.
"Activity diagrams are constructed from a limited number of shapes, connected with arrows. The most important shape types:
* rounded rectangles represent actions;
* diamonds represent decisions;
* bars represent the start (split) or end (join) of concurrent activities;
* a black circle represents the start (initial state) of the workflow;
* an encircled black circle represents the end (final state).
Arrows run from the start towards the end and represent the order in which activities happen.
Activity diagrams may be regarded as a form of flowchart. Typical flowchart techniques lack constructs for expressing concurrency. However, the join and split symbols in activity diagrams only resolve this for simple cases; the meaning of the model is not clear when they are arbitrarily combined with decisions or loops.
While in UML 1.x, activity diagrams were a specialized form of state diagrams, in UML 2.x, the activity diagrams were reformalized to be based on Petri net-like semantics, increasing the scope of situations that can be modeled using activity diagrams. These changes cause many UML 1.x activity diagrams to be interpreted differently in UML 2.x." [Activity diagram. Wikipedia]
This example of UML activity diagram symbols for the ConceptDraw PRO diagramming and vector drawing software is included in the ATM UML Diagrams solution from the Software Development area of ConceptDraw Solution Park.
UML activity diagram symbols
UML Activity Diagram. Design Elements


BPMN 2.0

Business Process Modeling with ConceptDraw
UML Flowchart Symbols

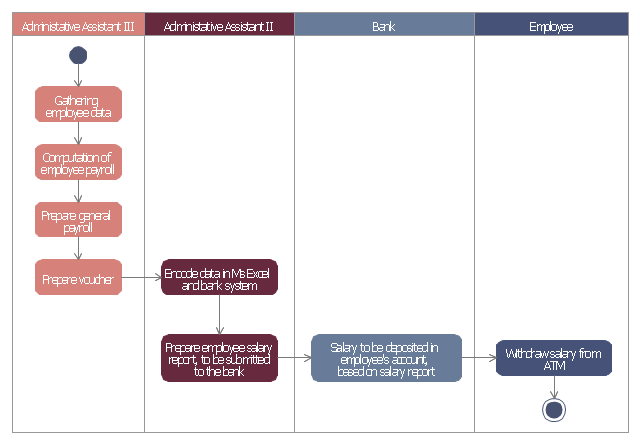
This example of automated payroll management system UML activity diagram was created on the base of figure on the webpage "Automated payroll management system" from ethelmandane.wikispaces.com.
"In the Philippines and in other foreign countries the government has a trend to embrace automation for process efficiency. One of the processes that are being automated is the payroll process. Payroll is the total amount required to pay workers and employees during a week, month or other period.
One of the government offices that desires to automate their payroll system is the NSO Camarines Sur which is located 2nd Floor MMCN Building, Panganiban Avenue, Naga City. The National Statistics Office (NSO) envisions to be recognized as a world-class provider of statistical and civil registration products and services and lives with its mission to produces and provides quality statistical and civil registration products and services. ...
The project seeks to create an Information System Plan for an Automated Payroll Management System. ...
The creation of the Information System Plan will benefit the accounting section of the organization. Specifically it is significant to:
1. Administrative Assistants. It will help to lessen time and effort in preparing and computing the salary of the employee.
2. NSO. It will help the organization to be more productive and efficient."
[ethelmandane.wikispaces.com/ ]
This file is licensed under a Creative Commons Attribution Share-Alike 3.0 License. [creativecommons.org/ licenses/ by-sa/ 3.0/ ]
This UML activity diagram example modeling the automated payroll management system using automated teller machine (ATM) was created using the ConceptDraw PRO diagramming and vector drawing software extended with the ATM UML Diagrams solution from the Software Development area of ConceptDraw Solution Park.
UML activity diagram of automated payroll management system using ATM
Types of Flowcharts


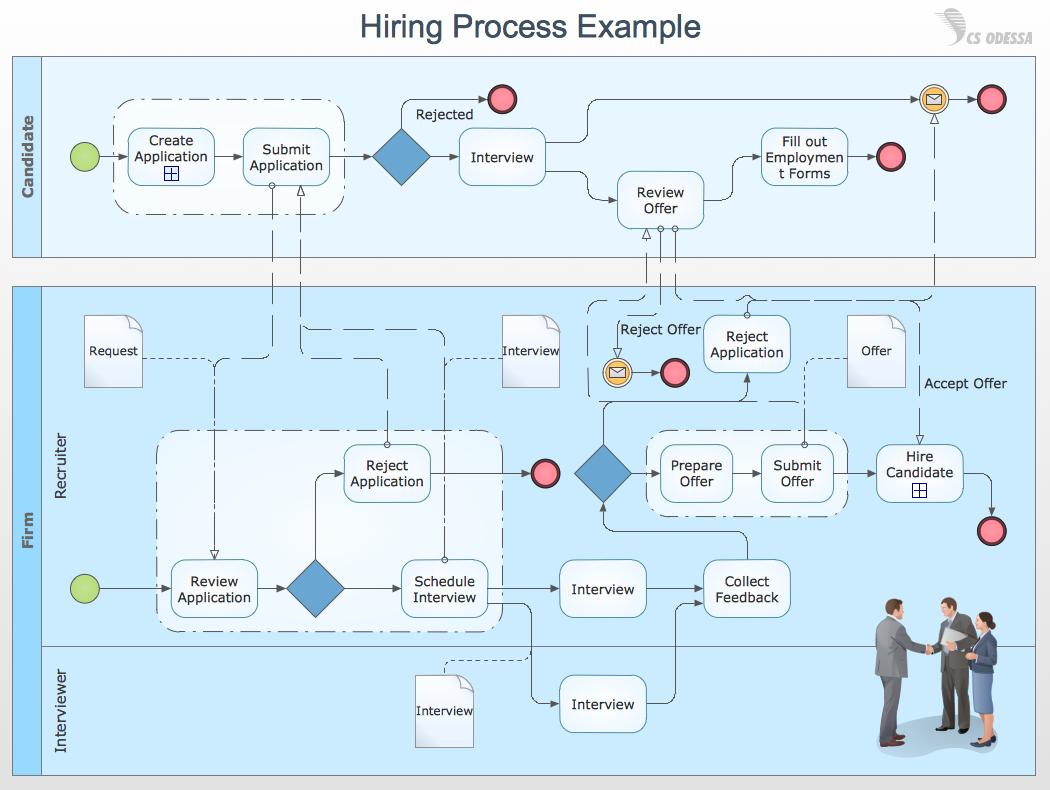
Cross-Functional Flowchart (Swim Lanes)

Swim Lane Diagrams

- Cross-Functional Flowchart ( Swim Lanes ) | Swim Lane Flowchart ...
- UML Activity Diagram | UML activity diagram ( swimlanes ) - Template ...
- Swim Lane Flowchart Symbols | Swim Lane Diagrams | Cross ...
- UML Activity Diagram | Diagramming Software for Design UML ...
- Swim Lane Diagrams | Swim Lane Flowchart Symbols | UML Activity ...
- Swim Lane Flowchart Symbols | UML Activity Diagram . Design ...
- Swim Lane Flowchart Symbols | UML activity diagram ( swimlanes ...
- Swimlane Diagram Of Employment Payroll System
- Swimlane Activity Diagram For Online Shopping
- Banking Sofware Swimlane Diagrams
- Swim Lane Flowchart Symbols | UML Activity Diagram . Design ...
- UML activity diagram ( swimlanes ) - Template
- Swim Lane Flowchart Symbols | UML Activity Diagram . Design ...
- UML activity diagram ( swimlanes ) - Template
- UML activity diagram ( swimlanes ) - Template | Cross-Functional ...
- UML activity diagram ( swimlanes ) - Template | Cross-Functional ...
- Swim Lane Diagrams | Swim Lanes Flowchart. Flowchart Examples ...
- Swimlane Diagram For Banking System
- UML activity diagram ( swimlanes ) - Template | Swim Lane Flowchart ...
- Swim Lane Diagrams | Swim Lane Flowchart Symbols | UML ...