How to Create a Process Flowchart
Use ConceptDraw DIAGRAM diagramming and vector graphics software to visually model your own IT construction processes.Examples of Flowcharts, Org Charts and More
ConceptDraw DIAGRAM covers a broad spectrum of business graphics categories and offers at ConceptDraw STORE enormous online collection of pictorial examples and samples for different thematics and application areas. It is a plentiful source of inspiration and wonderful examples of professionally designed diagrams, flowcharts, UML diagrams, organizational charts, databases, ERDs, network diagrams, business charts, different thematic charts, schematics, infographics and plans developed specially for knowledge workers, engineers, managers, businessmen, marketing specialists, analytics, scientists, students, professors, journalists and also for a large number of other people that every day use various diagrams and drawings in their work and life activity. Each of these examples is a real art, all they are well thought-out and designed without efforts with help of powerful tools of ConceptDraw DIAGRAM software. ConceptDraw examples display all variety of tasks, possibilities and results that ConceptDraw Product Line lets achieve fast and easy. ConceptDraw is one of the best Visio alternatives for Mac. It open all Visio formats like.vsdx,.vss,.vdx files and allows you to export files to Visio formats.
Swim Lane Flowchart Symbols
Use the set of special professionally developed swim lane flowchart symbols - single, multiple, vertical and horizontal lanes from the Swimlanes and Swimlanes BPMN 1.2 libraries from the Business Process Diagram solution, the Swim Lanes library from the Business Process Mapping solution as the perfect basis for your Swim Lane Flowcharts of processes, algorithms and procedures.UML Use Case Diagram. Design Elements
UML Use Case Diagrams are used to illustrate the structure of arbitrarily complex systems and illustrates the service consumer - service provider relationship between components.
UML Flowchart Symbols
The UML diagram is a powerful tool which lets visually represent all system's components, the interactions between them and relationships with external user interface. The Rapid UML solution for ConceptDraw DIAGRAM software offers diversity of UML flowchart symbols for drawing all types of UML diagrams.Jacobson Use Cases Diagram
The vector stencils library UML Use Case contains specific symbols of the UML notation such as actors, actions, associations and relationships for the ConceptDraw DIAGRAM diagramming and vector drawing software. This library is contained in the Rapid UML solution from Software Development area of ConceptDraw Solution Park.HelpDesk
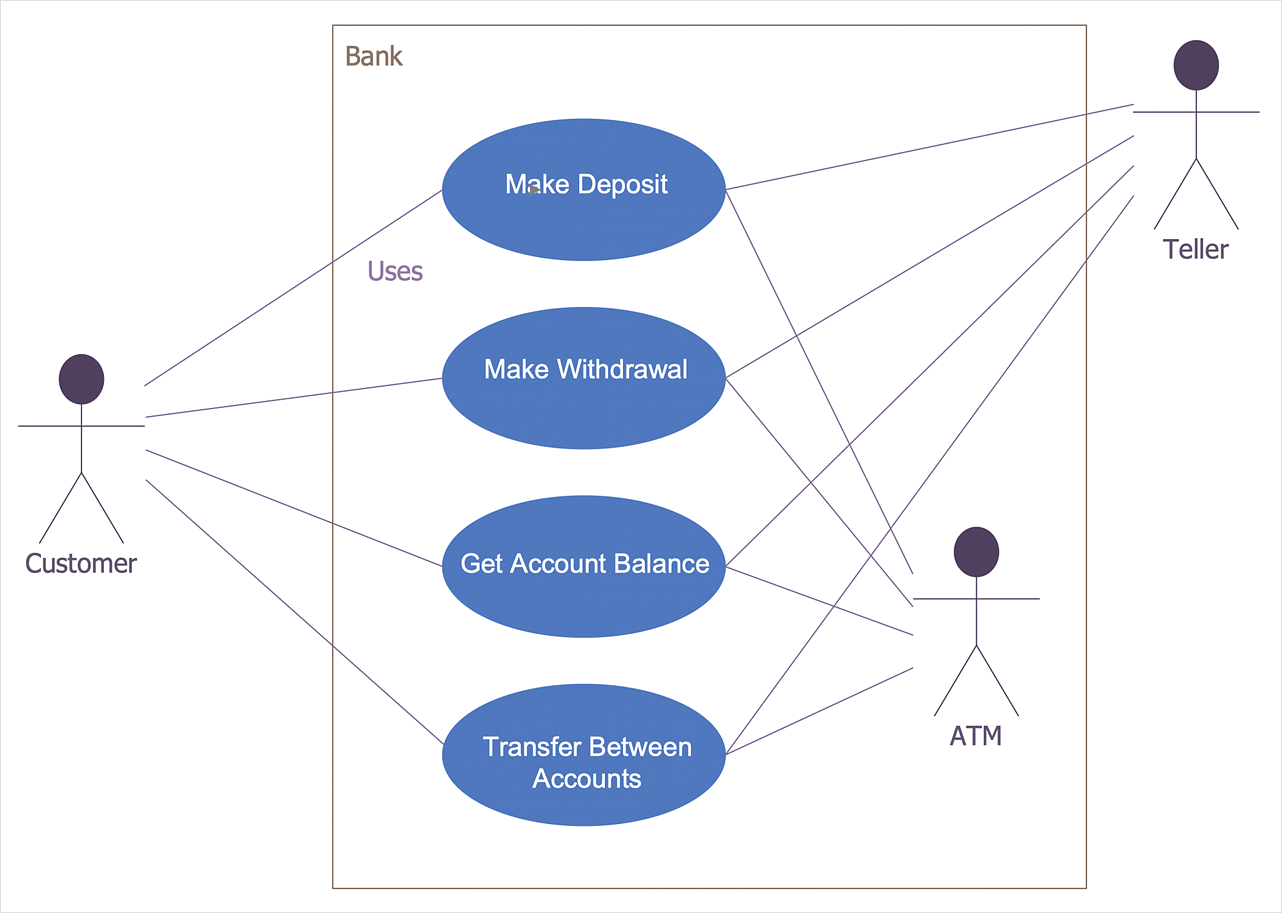
How to Create a Bank ATM Use Case Diagram
UML diagrams are often used in banking management for documenting a banking system. In particular, the interaction of bank customers with an automated teller machine (ATM) can be represented in a Use Case diagram. Before the software code for an ATM, or any other system design, is written, it is necessary to create a visual representation of any object-oriented processes. This is done most effectively by creating a Unified Modeling Language (UML) diagram, using object-oriented modeling. UML works as a general purpose modeling language for software engineers or system analysts, offering a number of different diagram styles with which to visually depict all aspects of a software system. ConceptDraw DIAGRAM diagramming software, enhanced and expanded with the ATM UML Diagrams solution, offers the full range of icons, templates and design elements needed to faithfully represent ATM and banking information system architecture using UML standards. The ATM UML Diagrams solution is useful for beginner and advanced users alike. More experienced users will appreciate a full range of vector stencil libraries and ConceptDraw DIAGRAM 's powerful software, that allows you to create your ATM UML diagram in a matter of moments.Settlement Process Flowchart. Flowchart Examples
Create your own flow charts of settlement processes using the ConceptDraw DIAGRAM diagramming and vector drawing software extended with the Cross-Functional Flowcharts solution from the Business Processes area of ConceptDraw Solution Park. Download easy flowchart software to create settlement process flowcharts show steps of monthly settlement with your business quickly and easily.Use Case Diagrams technology with ConceptDraw DIAGRAM
Use case diagrams are used at the development of software and systems for definition of functional system requirements or system of systems. Use case diagram presents the consecution of object’s actions (user’s or system’s) which are executed for reaching the definite result.SSADM Diagram
The vector stencils library SSADM from the solution Systems engineering contains specific symbols of SSADM diagrams for ConceptDraw DIAGRAM diagramming and vector drawing software. The Systems engineering solution is contained in Software Development area of ConceptDraw Solution Park. The example below illustrates the waterfall model used in SSADM. This model involves 5 stages of developing a product such as requirements specification and its' analysis, design, coding and testing.Pyramid Diagram
ConceptDraw Pyramid Diagram software allows drawing column charts using predesigned objects or drawing tools.Online Diagram Tool
ConceptDraw DIAGRAM diagramming and vector drawing software extended with Rapid UML Solution from the Software Development Area is a powerful online diagram tool that will help you design any types of UML diagrams simply and fast.The vector stencils library "HR professions" contains 81 professions pictograms.
Use this HR icon set to draw your HR flowcharts, workflow diagrams, process charts and infographics with the ConceptDraw PRO diagramming and vector drawing software.
The HR pictograms library "HR professions" is included in the HR Flowcharts solution from the Management area of ConceptDraw Solution Park.
HelpDesk
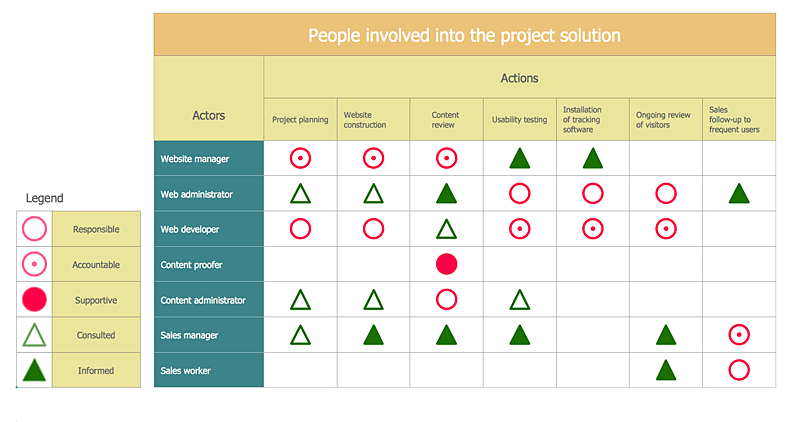
How To Create an Involvement Matrix
The Involvement Matrix can identify the distribution of responsibilities and identify roles in a group or team. This matrix can be used company-wide. The Involvement Matrix identifies participants who are involved in corrective actions. The Involvement Matrix is constructed for all highly prioritized corrective actions. It uses symbols to assign who participates, performs, consults, should be informed, checks the work, and accepts the results. Using visual diagrams keeps ideas clear and is very effective when discussing the problem and a description of the solution. They are great at helping to quickly see what stage of the problem-solving effort is currently underway. It defines the participants and their roles. The matrix displays all of the parties involved, defines their level of involvement, and the nature of their participation. The ability to create an Involvement Matrix is supported by the ConceptDraw Seven Management and Planning Tools solution.UML Class Diagram Tutorial
The Rapid UML Solution from the Software Development area of ConceptDraw Solution Park helps you to create the UML Class Diagrams quick and easy using ConceptDraw DIAGRAM diagramming and vector drawing software.- Cross-Functional Flowchart (Swim Lanes) | Swim Lane Flowchart ...
- Design elements - UML use case diagrams | Basic Flowchart ...
- Design elements - UML use case diagrams | Program Structure ...
- UML Flowchart Symbols | UML Class Diagram Notation | UML ...
- Process Flowchart | Types of Flowchart - Overview | Event-Driven ...
- Process Flowchart | HR professions - Vector stencils library | HR ...
- Cross-Functional Flowchart (Swim Lanes) | Swim Lane Flowchart ...
- Entity Relationship Diagram - ERD - Software for Design Crows Foot ...
- Introduction to bookkeeping: Accounting flowchart process ...
- Trading process diagram - Deployment flowchart | Financial Trade ...
- Process Flowchart | Flowchart design. Flowchart symbols, shapes ...
- Design elements - UML activity diagrams | Flowchart design ...
- Data Flow Diagrams | ATM Sequence diagram | Basic Flowchart ...
- Fisherman Flowchart
- Basic Flowchart Symbols and Meaning | Entity Relationship ...
- Actor Icon
- Entity Relationship Diagram Symbols | ERD Symbols and Meanings ...
- Diagramming software for Amazon Web Service diagrams, charts ...
- Process Flowchart | ERD Symbols and Meanings | Components of ...
- Postman Icon Png


