Affinity Diagram Software
Affinity Diagram Software - ConceptDraw DIAGRAM is a powerful diagramming and vector drawing software that allows quick, easy and effective create the Affinity Diagrams. Seven Management and Planning Tools solution from the Business Productivity area of ConceptDraw Solution Park provides templates, samples and ready-to-use vector stencils that will help you design the professional looking Affinity Diagrams in a few moments.Affinity Diagram
The affinity diagram is a business tool used to organize ideas and data. It is one of the Seven Management and Planning Tools. But how design the Affinity Diagram quick and easy? ConceptDraw DIAGRAM diagramming and vector drawing software offers the Seven Management and Planning Tools Solution from the Management Area.Affinity Diagram
The Affinity Diagram, also known as a KJ diagram, is a business tool invented for organization the large quantity of ideas and data. It is a part of Seven Management and Planning Tools, it is usually used right after brainstorming to sort large numbers of ideas into the corresponding groups. The Affinity Diagram helps to represent in a better way the structure of large and complex factors which influence on a problem, divides these factors into the smaller and simpler structures, and helps team members to see the patterns and identify possible solutions to problems they have. The diagrams of this type don't show the causal relationships between the factors, but they are designed to prepare the data for holding further analysis of the cause-effect relationships. Another area of Affinity Diagram usage is contextual inquiry as a way to sort observations and notes from field interviews, support call logs, open-ended survey responses organizing, etc. ConceptDraw MINDMAP software offers you the tools for easy holding brainstorming, generation ideas and creation MINDMAP Affinity Diagram.HelpDesk
How To Create an Affinity Diagram Using Solutions
Affinity diagram is designed to prepare the data for further analysis of the cause-effect relationships.The Affinity diagram shows the structure of large, complex factors that have an influence on a problem, and then divides them up into a smaller and simpler structure. We recommend using a mind map for Brainstorming and collecting the factors affecting the problem. The ability to create an Affinity diagram from a mind map is supported by the ConceptDraw Seven Management and Planning Tools solution.PROBLEM ANALYSIS. Identify and Structure Factors
Identify and Structure Factors. Use the Affinity Diagram to collect and structure factors that impact on a problem. ConceptDraw Office suite is a software for identify and structure factors with affinity diagram. This is a grouping and structuring of factors that impact on a problem.
The Action Plan
Action Plan - For the action planning define people and groups involvement in corrective actions by roles, identify logical sequences of scheduled actions and critical path of problem solving, identify possible risks of action plan and propose preventive actions. ConceptDraw Office suite is a software for decision making and action plan.
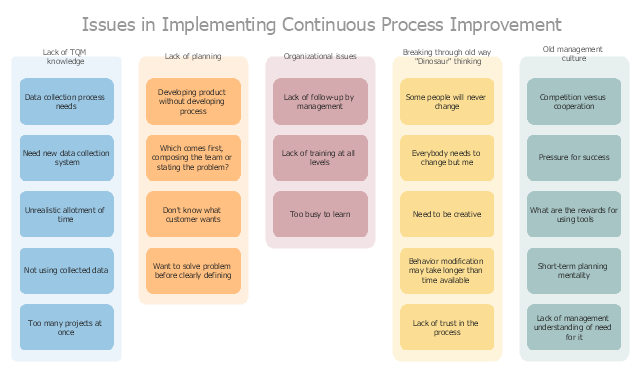
"A continual improvement process, also often called a continuous improvement process (abbreviated as CIP or CI), is an ongoing effort to improve products, services, or processes. These efforts can seek "incremental" improvement over time or "breakthrough" improvement all at once. Delivery (customer valued) processes are constantly evaluated and improved in the light of their efficiency, effectiveness and flexibility.
Some see CIPs as a meta-process for most management systems (such as business process management, quality management, project management, and program management)." [Continual improvement process. Wikipedia]
The affinity diagram example "Implementing continuous process improvement" was created using the ConceptDraw PRO diagramming and vector drawing software extended with the solution "Seven Management and Planning Tools" from the Management area of ConceptDraw Solution Park.
Affinity Diagram
Affinity Diagram is a powerful business tool, one of the Seven Management and Planning Tools. It helps to gather and organize in groups the large number of information, opinions or ideas, which are typically generated during brainstorming session, and is based on the natural relationships that exist between ideas. Affinity Diagram is indispensible for analysis the complex problems, ideas and results of oral surveys. It effectively depicts the structure of large and complex factors that influence on a problem, divides them into smaller with simpler structure, but doesn't show a causal relationship between the factors. Typically Affinity Diagram contains approximately 40-50 topics and is widely used for a completely different goals, for the project definition, for analyzing product evaluations, for identifying the main violations in a process and the ways of their improvement. ConceptDraw Office applications are ideal for designing professional-looking Affinity diagrams. This Affinity diagram is created to prepare the data for further analysis of cause-and-effect relationships.PROBLEM ANALYSIS. Root Cause Analysis Tree Diagram
Root Cause Analysis Tree Diagram. Use the Root Cause Diagram to perform visual root cause analysis. Root Cause Analysis Tree Diagram is constructed separately for each highly prioritized factor. The goal of this is to find the root causes for the factor and list possible corrective action. ConceptDraw Office suite is a software for problem analysis.
PROBLEM ANALYSIS. Relations Diagram
Use the Relations Diagram to create a relations factors map and to identify which factors are “drivers” and “indicators”. This diagram identifies causal relationships and determine what factors are causes or effects. ConceptDraw Office suite is a software for relation diagram making.
Seven Management and Planning Tools
Seven Management and Planning Tools solution extends ConceptDraw DIAGRAM and ConceptDraw MINDMAP with features, templates, samples and libraries of vector stencils for drawing management mind maps and diagrams.
Organizational Charts with ConceptDraw DIAGRAM
Organizational chart or Orgchart is a diagram that depicts the structure of an organization using the terms of work responsibility and rank position. It is a useful and convenient format to visually illustrate the relationships within an organization, which is moreover applicable for organization of any size. Typically, an Organizational chart is constructed from the rectangular object blocks, which represent a job title, a person's name and relationships associated with them. You looks for the powerful Orgchart software? ConceptDraw DIAGRAM software is exactly what you've been searching long. Extended with Organizational Charts Solution, ConceptDraw DIAGRAM offers great-looking examples and samples of Orgcharts, built-in templates and various types of predesigned vector block objects and connectors for creation all kinds of Organizational Charts - from simple to complex multi-page. When designing the chart for large organization with complex branched structure, may be convenient to divide it into few smaller charts.PROBLEM ANALYSIS. Prioritization Matrix
ConceptDraw OFFICE suite is a software for Prioritization Matrix diagram making. This diagram ranks the drivers’ factors to determine priority. It identifies the factors of the first priority for analysis of possible corrective actions. It assesses the weight of each factor for each criterion and specifies it in the Prioritization Matrix. The total sum of weights for a factor’s criteria indicates its priority.
Learn how to create a current state value stream map
Value Stream Mapping solution extends ConceptDraw DIAGRAM software with templates, samples and vector shapes for drawing the current state value stream maps.CORRECTIVE ACTIONS PLANNING. Risk Diagram (PDPC)
Risk Diagram (PDPC) - ConceptDraw Office suite is a software for Risks Diagram making. This diagram identifies possible risks in accomplishing corrective actions. With the Risks Diagram, one analyzes each action separately in a tree of all actions and develops a preventive action in response of each potential obstacles or circumstances which may be a risk.
- Affinity Diagram | How To Create an Affinity Diagram Using ...
- Affinity Diagram | Affinity diagram - Implementing continuous ...
- Affinity Diagram | Affinity Diagram Software | Affinity diagram ...
- Affinity Diagram Software | ConceptDraw Solution Park | Design ...
- Activity Network (PERT) Chart | Affinity Diagram Software | Activity ...
- Affinity Diagram | Affinity Diagram Software | PDPC | How To Use ...
- Affinity Diagram | Affinity Diagram Software | PDPC | Pdf Affinity ...
- Affinity diagram - Template | Affinity Diagram | Affinity Diagram ...
- Affinity Diagram | Business Diagram Software | Marketing ...
- Affinity Diagram | Affinity Diagram Software | Download The Pdf Of ...
- Affinity Diagram | Affinity diagram - Template | How To Create an ...
- Affinity Diagram | Seven Management and Planning Tools | PDPC ...
- CORRECTIVE ACTIONS PLANNING. Involvement Matrix | Affinity ...
- Affinity Diagram Software | Total Quality Management | Affinity ...
- Affinity Diagram | Affinity Diagram Software | How To Create an ...
- House of Quality Matrix Software | Affinity Diagram Software | Affinity ...
- Affinity Diagram | Activity Network Diagram Method | Prioritization ...
- Affinity Diagram | Organogram Software | LLNL Flow Charts | Chart ...
- House of Quality Matrix Software | Property Management Examples ...