Affinity Diagram
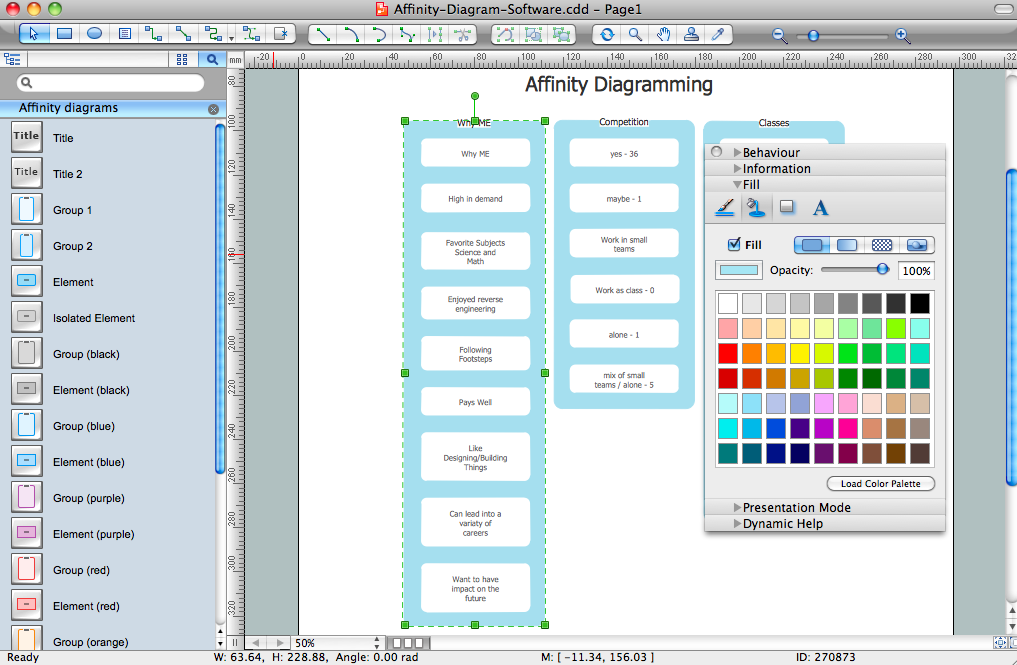
The affinity diagram is a business tool used to organize ideas and data. It is one of the Seven Management and Planning Tools. But how design the Affinity Diagram quick and easy? ConceptDraw PRO diagramming and vector drawing software offers the Seven Management and Planning Tools Solution from the Management Area.Affinity Diagram
The Affinity Diagram shows the structure of large, complex factors that have an influence on a problem, and then divides them up into a smaller and simpler structure. The Affinity Diagram does not show a causal relationship between the factors. This diagram is designed to prepare the data for further analysis of the cause-effect relationships.Affinity Diagram Software
Affinity Diagram Software - ConceptDraw PRO is a powerful diagramming and vector drawing software that allows quick, easy and effective create the Affinity Diagrams.Seven Management and Planning Tools solution from the Business Productivity area of ConceptDraw Solution Park provides templates, samples and ready-to-use vector stencils that will help you design the professional looking Affinity Diagrams in a few moments.
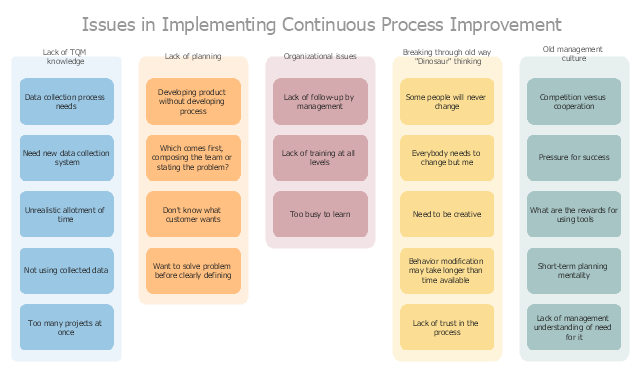
"A continual improvement process, also often called a continuous improvement process (abbreviated as CIP or CI), is an ongoing effort to improve products, services, or processes. These efforts can seek "incremental" improvement over time or "breakthrough" improvement all at once. Delivery (customer valued) processes are constantly evaluated and improved in the light of their efficiency, effectiveness and flexibility.
Some see CIPs as a meta-process for most management systems (such as business process management, quality management, project management, and program management)." [Continual improvement process. Wikipedia]
The affinity diagram example "Implementing continuous process improvement" was created using the ConceptDraw PRO diagramming and vector drawing software extended with the solution "Seven Management and Planning Tools" from the Management area of ConceptDraw Solution Park.
 Seven Management and Planning Tools
Seven Management and Planning Tools solution extends ConceptDraw PRO and ConceptDraw MINDMAP with features, templates, samples and libraries of vector stencils for drawing management mind maps and diagrams.
HelpDesk
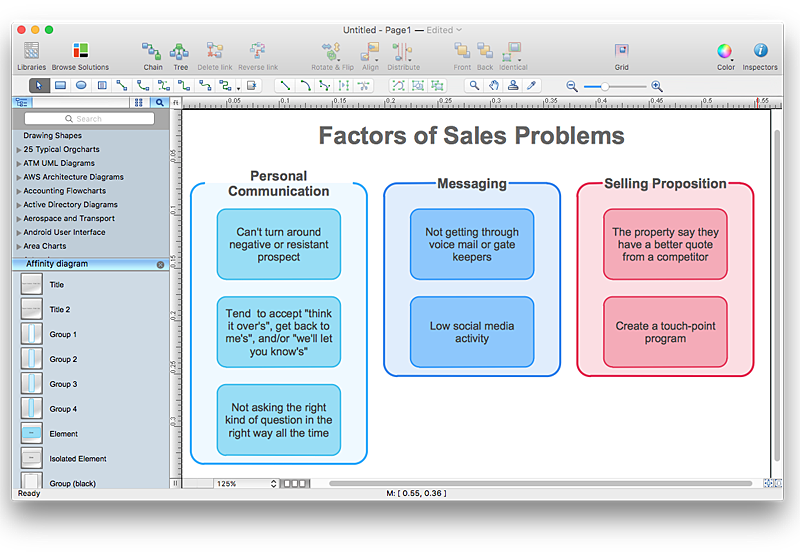
How To Create an Affinity Diagram Using ConceptDraw Office
Affinity diagram is designed to prepare the data for further analysis of the cause-effect relationships.The Affinity diagram shows the structure of large, complex factors that have an influence on a problem, and then divides them up into a smaller and simpler structure. We recommend using a mind map for Brainstorming and collecting the factors affecting the problem. The ability to create an Affinity diagram from a mind map is supported by the ConceptDraw Seven Management and Planning Tools solution.
 Seven Management and Planning Tools
Seven Management and Planning Tools solution extends ConceptDraw PRO and ConceptDraw MINDMAP with features, templates, samples and libraries of vector stencils for drawing management mind maps and diagrams.
PROBLEM ANALYSIS. Identify and Structure Factors
Identify and Structure Factors. Use the Affinity Diagram to collect and structure factors that impact on a problem.ConceptDraw Office suite is a software for identify and structure factors with affinity diagram. This is a grouping and structuring of factors that impact on a problem.

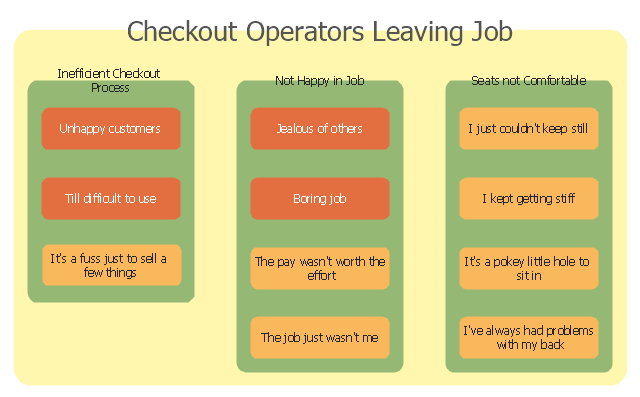
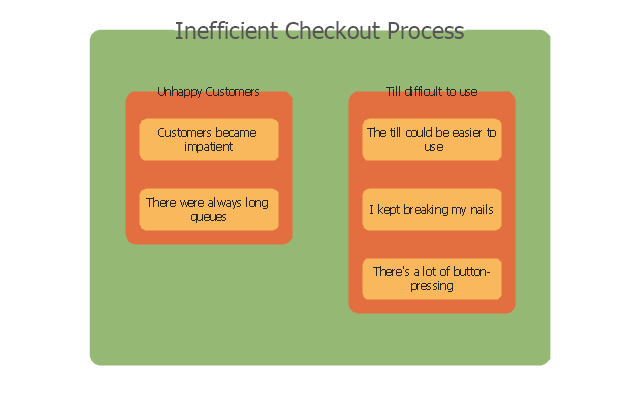
"Point of sale (also called POS or checkout) is the place where a retail transaction is completed. It is the point at which a customer makes a payment to the merchant in exchange for goods or services. At the point of sale the retailer would calculate the amount owed by the customer and provide options for the customer to make payment. The merchant will also normally issue a receipt for the transaction. ...
The modern point of sale is often referred to as the point of service because it is not just a point of sale but also a point of return or customer order. Additionally it includes advanced features to cater to different functionality, such as inventory management, CRM, financials, warehousing, etc., all built into the POS software. Prior to the modern POS, all of these functions were done independently and required the manual re-keying of information, which can lead to entry errors." [Point of sale. Wikipedia]
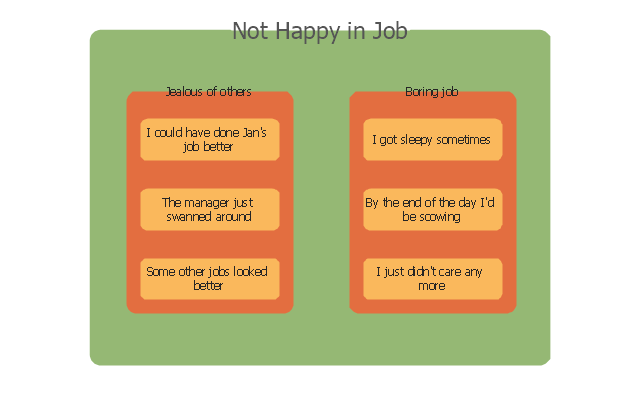
The affinity diagram example "Checkout operators leaving job" was created using the ConceptDraw PRO diagramming and vector drawing software extended with the solution "Seven Management and Planning Tools" from the Management area of ConceptDraw Solution Park.
The Action Plan
Action Plan - For the action planning define people and groups involvement in corrective actions by roles, identify logical sequences of scheduled actions and critical path of problem solving, identify possible risks of action plan and propose preventive actions.ConceptDraw Office suite is a software for decision making and action plan.

PROBLEM ANALYSIS. Root Cause Analysis Tree Diagram
Root Cause Analysis Tree Diagram. Use the Root Cause Diagram to perform visual root cause analysis. Root Cause Analysis Tree Diagram is constructed separately for each highly prioritized factor. The goal of this is to find the root causes for the factor and list possible corrective action.ConceptDraw Office suite is a software for problem analysis.

Planogram
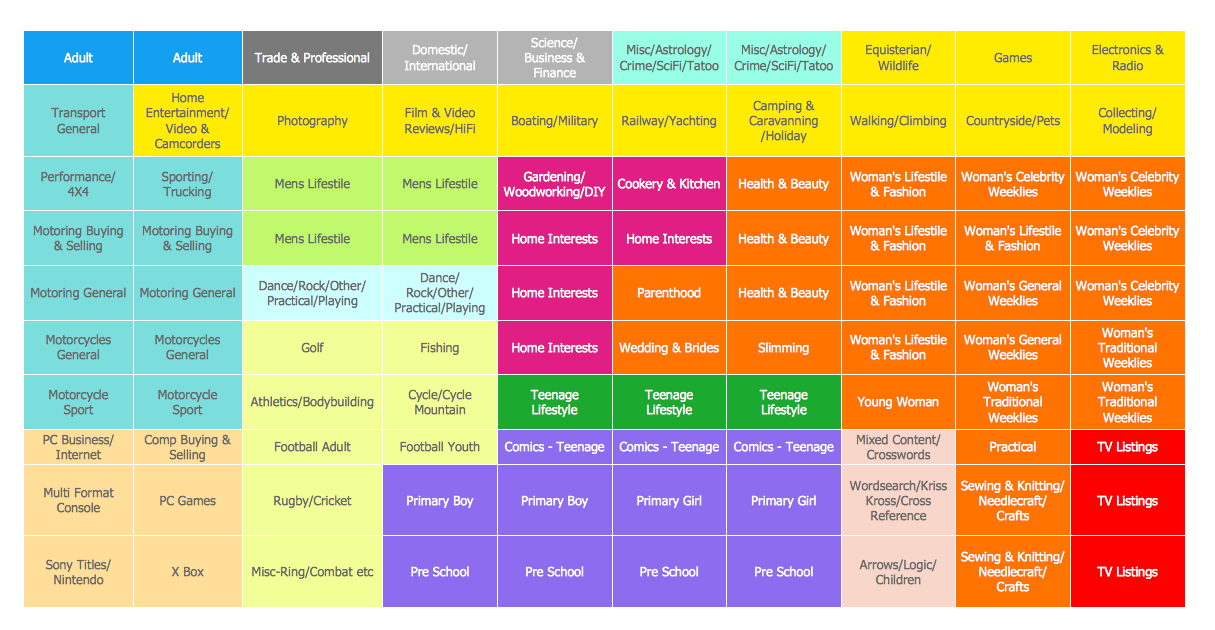
This example shows the planogram for magazines.This example was created in ConceptDraw PRO diagramming and vector drawing software using the Basic Diagramming Solution from the Universal Diagramming area of ConceptDraw Solution Park.
Property Management Examples
This sample was created in ConceptDraw PRO diagramming and vector drawing software using the Seven Management and Planning Tools Solution from the Business Productivity area of ConceptDraw Solution Park.This sample shows the Property Management matrix, the ideas are ordered in regards to importance and frequency. This matrix gives the ability to turn the theory into quantifiable data.
How To Implement Collaborative Project Management
Collaborative Project Management via Skype is an ideal tool for project teams who need to master a growing project complexity.
- Affinity Diagram
- Affinity Diagram Example
- Affinity Diagrams Examples
- Affinity diagram - Business expansion | BPR Diagram. Business ...
- PDPC | Affinity Diagram | Seven Management and Planning Tools ...
- House of Quality Matrix Software | Property Management Examples ...
- Flow chart Example . Warehouse Flowchart | Affinity diagram ...
- Example Of Affinity Diagram Business Requirements
- Example Of Affinity Diagrams Relate To Tqm
- Organizational Structure Total Quality Management | Affinity diagram ...
- Seven Management and Planning Tools | Affinity diagram ...
- Simple Example For Affinity Diagram
- Affinity Diagram Examples
- Purchasing Flowchart - Purchase Order. Flowchart Examples ...
- Simple Affinity Diagram Example
- Example Of Affinity Diagram About School
- Affinity diagram - Implementing continuous process improvement
- Examples of Flowcharts, Org Charts and More | Quality | Affinity ...
- Affinity Diagram Example Prepared By Financial Sector
- Affinity Diagram Software | Affinity diagram - Template | Affinity ...


