PROBLEM ANALYSIS Relations Diagram
Analyze Factors Relations. Use the Relations Diagram to create a relations factors map and to identify which factors are “drivers” and “indicators”.
Root Cause Analysis
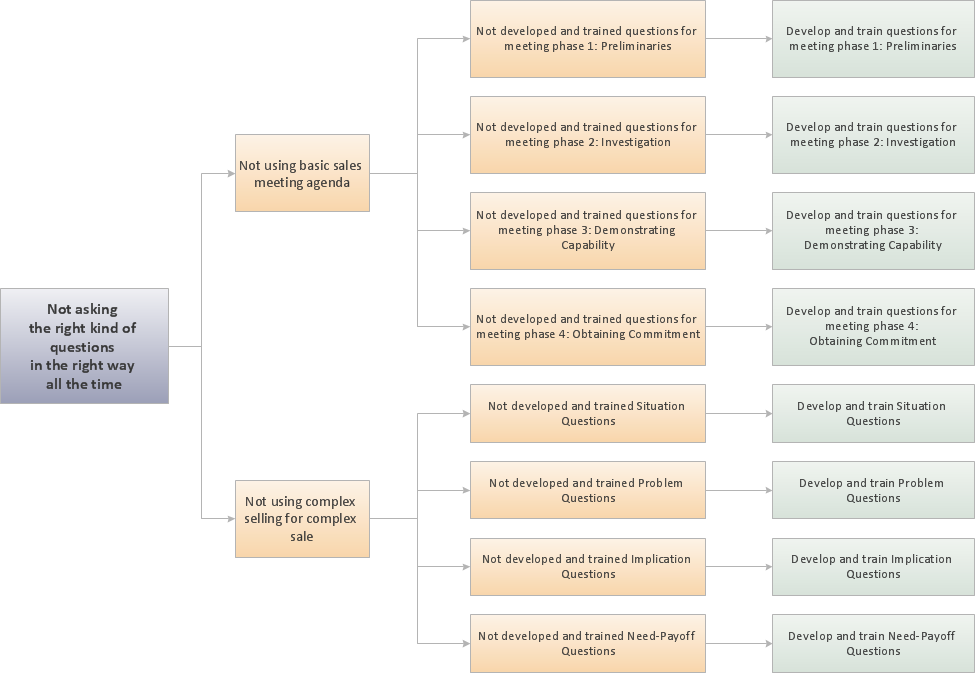
Root Cause Analysis tree Diagram. This diagram is for Root Cause Analysis. Analyze the root causes for factors that influenced the problem using ConceptDraw.
Cause & Effect Analysis
Root Cause Analysis tree Diagram. Use the Root Cause Diagram to perform visual root cause analysis.
PROBLEM ANALYSIS Prioritization Matrix
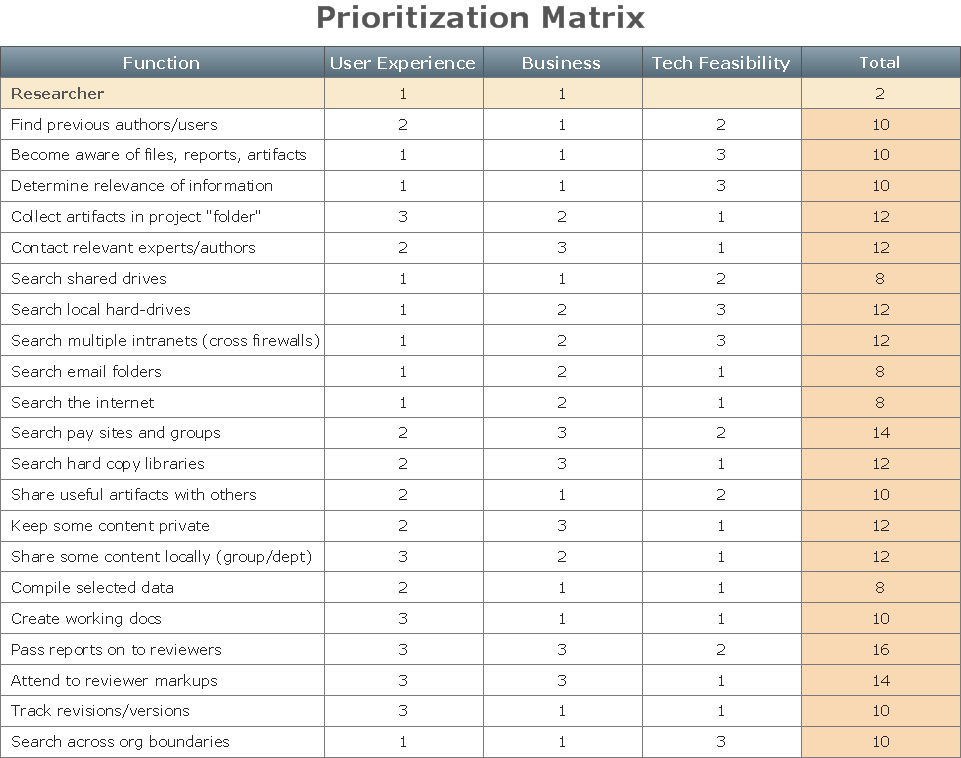
Create Prioritization Matrix. Use the Prioritization Matrix to define factor priority.
Corrective Action Planning
One of the stages of the problem's solving process scenario is Corrective Action Planning.
 Seven Management and Planning Tools
Seven Management and Planning Tools solution extends ConceptDraw PRO and ConceptDraw MINDMAP with features, templates, samples and libraries of vector stencils for drawing management mind maps and diagrams.
- PROBLEM ANALYSIS Relations Diagram | PROBLEM ANALYSIS ...
- Decision Making | PROBLEM ANALYSIS Prioritization Matrix | Root ...
- PROBLEM ANALYSIS Prioritization Matrix | Cause and Effect ...
- Problem Analysis | PROBLEM ANALYSIS Prioritization Matrix ...
- Cause and Effect Analysis (Fishbone Diagrams) | Cause & Effect ...
- Relations Ships Analysis | PROBLEM ANALYSIS Relations Diagram ...
- PROBLEM ANALYSIS Identify and Structure Factors | ConceptDraw ...
- Seven Management and Planning Tools | The Action Plan | Decision ...
- The Action Plan | PROBLEM ANALYSIS Root Cause Analysis tree Diagram ...
- Corrective Action Planning
- Entity- Relationship Diagram (ERD)
- CORRECTIVE ACTIONS PLANNING PERT Chart | Program ...
- Using Fishbone Diagrams for Problem Solving
- PROBLEM ANALYSIS Relations Diagram
- Decision Making | PROBLEM ANALYSIS Prioritization Matrix ...
- The Action Plan | Corrective Action Planning | Preventive Action |
- PROBLEM ANALYSIS Prioritization Matrix | Opportunity prioritization ...
- CORRECTIVE ACTIONS PLANNING Risk Diagram (PDPC) | Risk ...
- Using Fishbone Diagrams for Problem Solving


