 Business Process Mapping
The Business Process Mapping solution has a collection of vector graphic libraries, pre-made templates, and examples of the business process maps. They are useful for many business specialists including economists, politicians, analysts, and other economic experts, officials and state managers for making the unique and professionally looking drawings. Use it to create an effective Business process map, SIPOC diagram, Swim lanes flowchart and clearly define the necessary business processes due to their inputs and outputs.
Audit Process
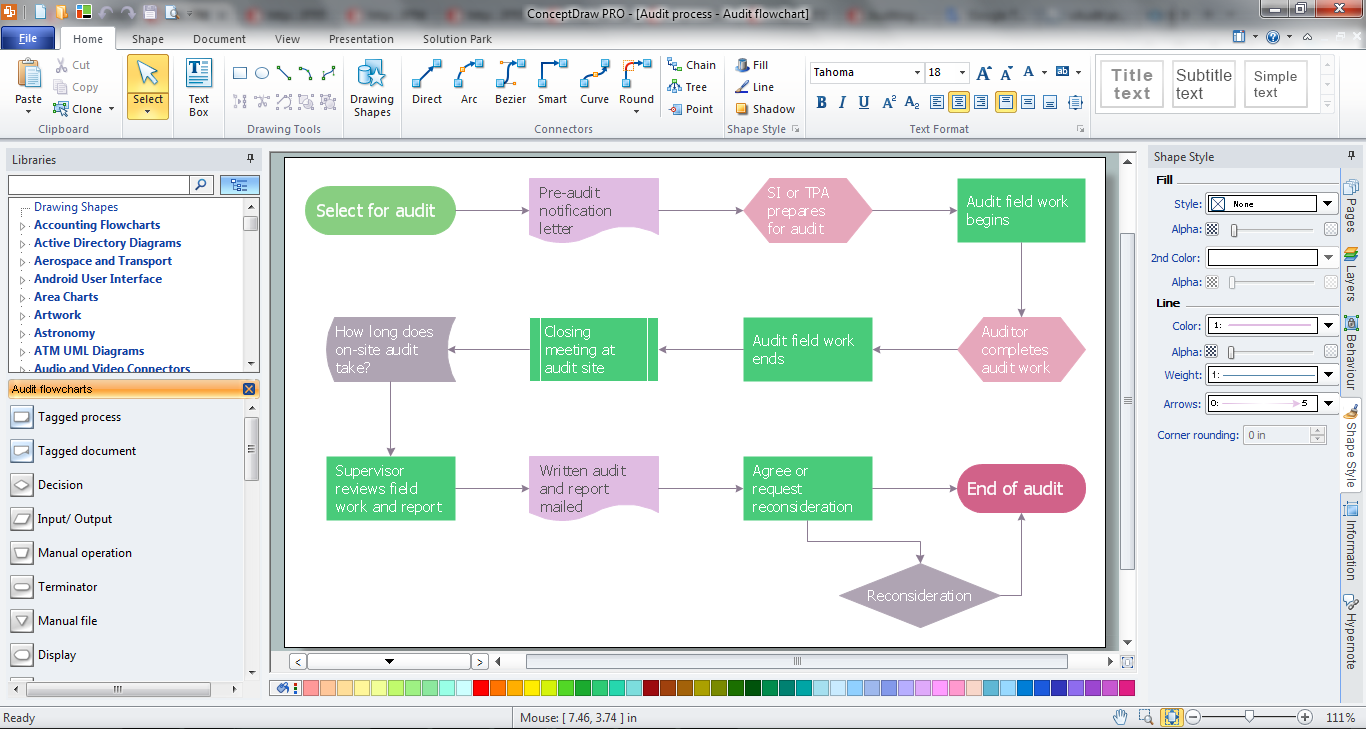
The audit process is a definite set of steps used in a financial, operational or compliance audit. This set of steps depends of the audit services company. The auditing process usually includes three main steps: planning, fieldwork and reporting. The Audit Flowcharts solution from the Finance and Accounting area for ConceptDraw Solution Park extends ConceptDraw DIAGRAM ector graphics and diagramming software with the ability of easy drawing the Audit Process Flowcharts.Android User Interface
Android is a mobile operating system (OS) based on the Linux kernel and currently developed by Google. One of the most important features of any Android app is, of course, its Android User Interface. It is all what the user sees on the screen of its device and interacts with. Creating of successful Android User Interface and developing Android UI prototypes may be the mighty task. But we recommend you to make it fast and easy in ConceptDraw DIAGRAM specially extended with Android User Interface Solution from the Software Development Area.Android GUI
Android is an operating system based on the Linux kernel and developed by Google for smartphones, tablet computers, electronic books, netbooks, smartbooks, digital players, watches, game consoles, TV and other devices. ConceptDraw DIAGRAM extended with Android User Interface Solution from the Software Development Area is a powerful software with extensive drawing tools which can help you to build the intelligible, attractive and easy for perception Android GUI for your application.Data Flow Diagram Process
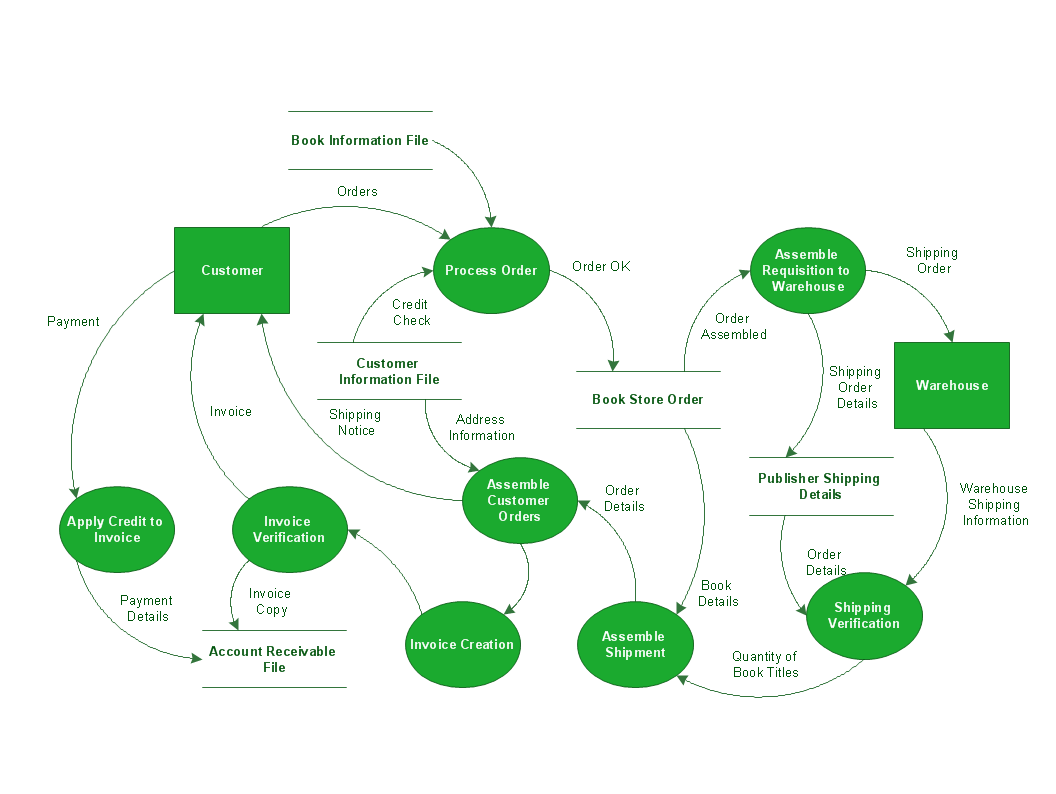
Data Flow Diagram (DFD) is a hierarchy of functional processes, connected by data flows. The purpose of this presentation is to show how each process converts its inputs into outputs and to identify relationships between these processes. DFD is convenient way of modeling and construction the information processes, it step-by-step illustrates the flow of information in a process. For construction a DFD traditionally are used two different notations, which appropriate to the methods of Yourdon-Coad and Gane-Sarson. These notations slightly different from each other by graphical representation of symbols for processes, data stores, data flow, external entities. When designing a DFD it is required to decompose the system into the components (sub-systems), for explaining a complex system you may need represent numerous levels. The Data Flow Diagrams solution from ConceptDraw Solution Park contains numerous predesigned DFD symbols for both notations, which help easy and effectively design professional-looking Data Flow Diagrams (DFDs) and DFD Process Diagrams.Best Program to Create a Flowchart
ConceptDraw - feature-rich flowchart software allows you create professional looking flowcharts.
 Cross-Functional Flowcharts
The Cross-Functional Flowcharts solution extends ConceptDraw DIAGRAM software with cross functional flowchart examples, samples, and libraries of cross functional flow chart vector design elements and CH-1 symbols for easy drawing professional-looking and illustrative Cross Functional Flowchart, Cross Functional Diagram, CH-1 Diagram, Process Flowchart, Deployment Flowchart, Opportunity Flowchart, Swimlane Process Mapping Diagram, or Visio Cross Functional Flowchart for planning and further analyzing, optimizing and improvement processes. The use of included pre-made cross functional flowchart template, opportunity flowchart template, and swimlane process map template, greatly easier designing your Cross-functional flowcharts.
The vector stencils library "Sales flowchart" contains 62 sales process flow chart symbols.
Use these flow chart icon set to draw your sales flowcharts, workflow diagrams and process charts with the ConceptDraw PRO diagramming and vector drawing software.
The sales process flowchart symbols library "Sales flowchart" is included in the Sales Flowcharts solution from the Marketing area of ConceptDraw Solution Park.
The vector stencils library "HR flowchart" contains 62 flowchart symbols.
Use it to draw your HR flowcharts, workflow diagrams and process charts with the ConceptDraw PRO diagramming and vector drawing software.
The flow chart symbols library "HR flowchart" is included in the HR Flowcharts solution from the Management area of ConceptDraw Solution Park.
Use it to draw your HR flowcharts, workflow diagrams and process charts with the ConceptDraw PRO diagramming and vector drawing software.
The flow chart symbols library "HR flowchart" is included in the HR Flowcharts solution from the Management area of ConceptDraw Solution Park.
Diagramming Software for UML Composite Structure Diagrams
UML Composite Structure Diagram shows the internal structure of a class and the possible interactions at this structure.
 Business Process Diagrams
Business Process Flow Diagrams solution extends the ConceptDraw DIAGRAM BPM software with RapidDraw interface, templates, business process diagrams examples and numerous libraries based on the BPMN 1.2 and BPMN 2.0 standards, which give you the possibility to visualize equally easy simple and complex processes, design business models, quickly develop and document in details any business processes on the stages of project’s planning and implementation.
 Classic Business Process Modeling
The ConceptDraw DIAGRAM software enhanced with Classic Business Process Modeling solution is a powerful flowchart maker and professional business process modeling software with extensive choice of drawing tools, libraries with wide variety of ready-to-use vector objects that are more than sufficient for modeling the business processes and for instant creation variety of diagram types: Control Flow Diagram, Swimlane Diagram, Business Process Modeling Diagram, Functional Flow Block Diagram, Data Flow Diagram. It is ideal for business analysts, developers, managers and regular users. The samples included to Classic Business Process Modeling solution allow you to uncover the solution’s power and answer qualitatively on how to create a flowchart or to model the business processes with help of diagrams and schemes.
Data Flow Diagrams
The information system manages the flow of data introduced into the system. To graphically represent and document the flow of data through some information system is used a Data Flow Diagram (DFD). DFD is a way to visualize the flow of data or data processing, to clearly demonstrate what type of data or information is transferred, where they come from and where are sent. It lets to create an overview of the system, to depict the major steps, and effectively model the processes. DFDs are helpful for analyzing and modifying the business systems. Traditionally are used two notations for DFDs creation - Yourdon-Coad and Gane-Sarson. ConceptDraw DIAGRAM software offers a special Data Flow Diagrams solution from Software Development area, which enables to quickly and simply create professional Data Flow Diagrams including the data storage, data flows, external entities, functional transforms, control transforms and signals. Use the offered templates, samples and extensive range of libraries to design your own Data Flow Diagrams in minutes.Network Security
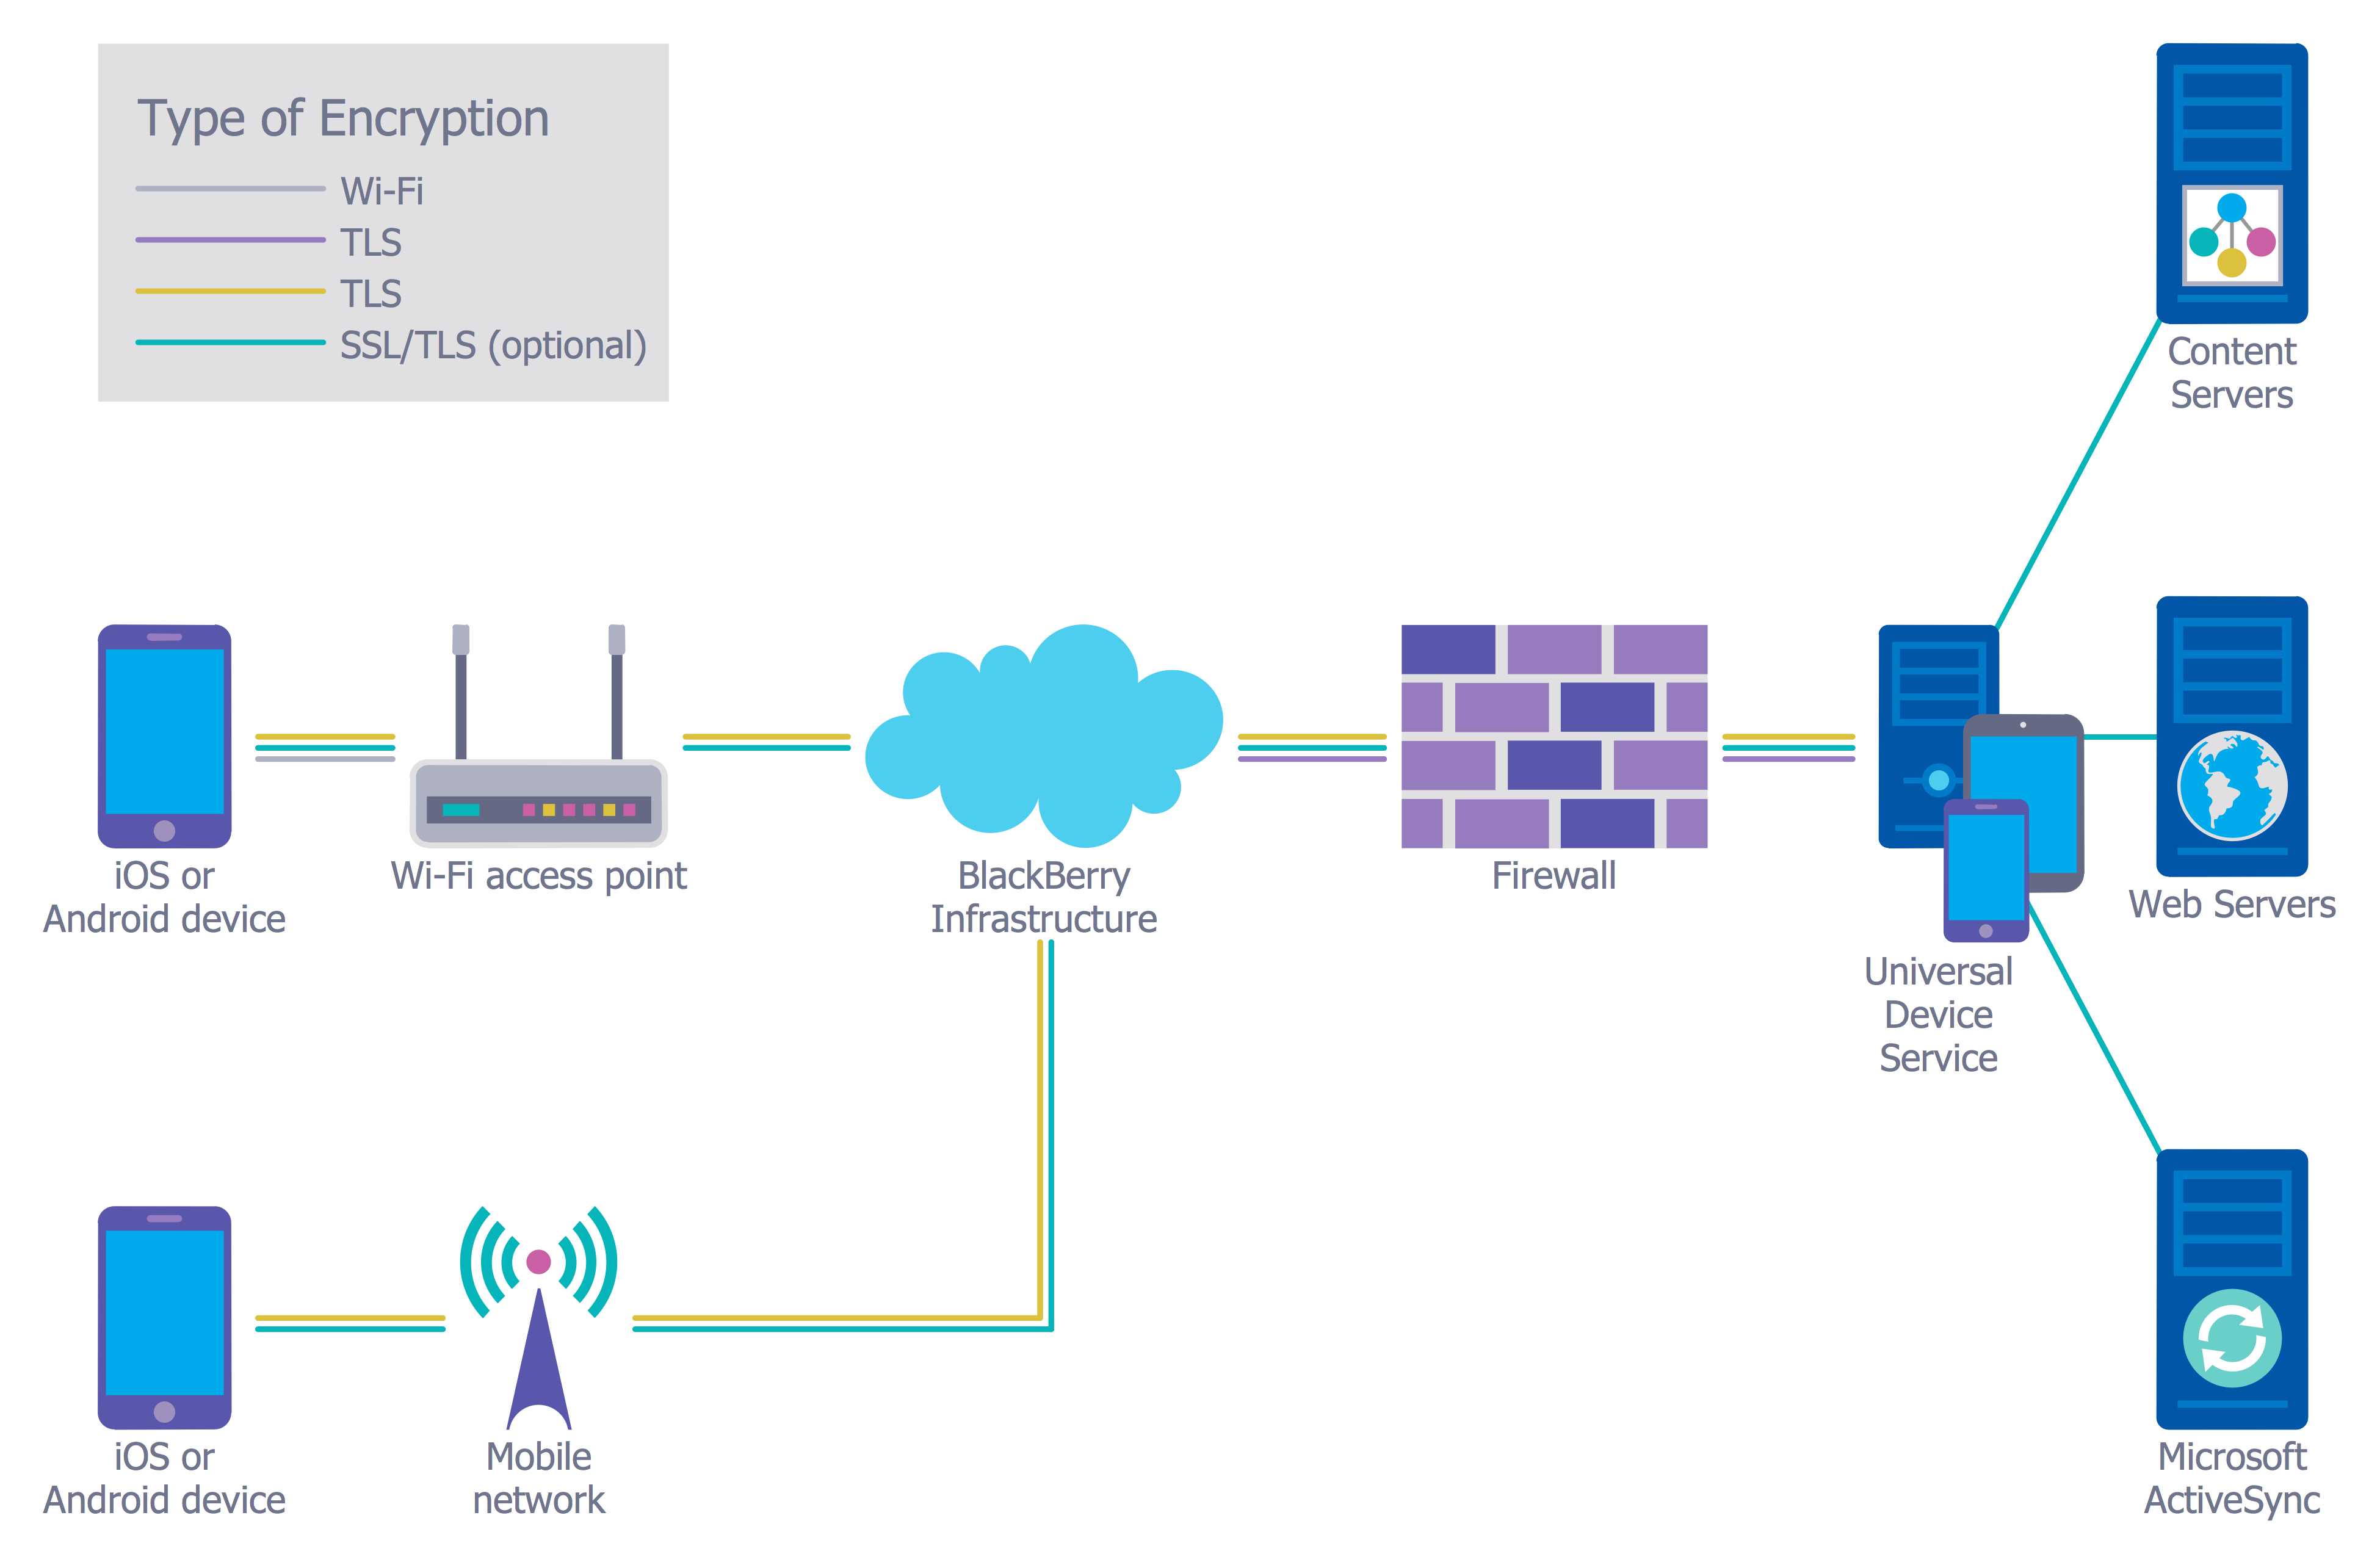
The Internet is a giant computer network which connects computers all over the world. It is integral part of human society and business. But the serious question for network engineers, designers, lawmakers and enforcers is the need for protect the Internet networks from the Internet crimes, hacking and attacks. There are quite a number of hardware, software and physical methods of protection against them. The samples you see on this page were created in ConceptDraw DIAGRAM using the tools of Network Security Diagrams Solution for ConceptDraw DIAGRAM software. They show protection networks with Firewalls and other network security devices.Flow Chart Design — How to Design a Good Flowchart
Use ConceptDraw DIAGRAM business diagramming and business graphics software for general diagramming purposes, it inludes tousands colored professional flowchart symbols, examples and samples which saves time when you prepare documents, professional presentations or make an explanation of process flow diagram.
 Audit Flowcharts
Audit flowcharts solution extends ConceptDraw DIAGRAM software with templates, samples and library of vector stencils for drawing the audit and fiscal flow charts.
Software Flow Chart
Many professionals have to solve problems every day. Designing of the process algorithm contribute to understand where the problem is in the process. A Flowchart is a graphical tool that most usable for breaking down processes. Definition of flowchart - a diagram that shows step-by-step progression through a procedure or system especially using connecting lines and a set of conventional symbols. All the icons, symbols and connectors needed for creating standardized notation flowcharts are contained within Software Flow Chart.Data Flow Diagram (DFD)
A Data Flow Diagram (DFD) illustrates the flow of data through an information system, visualizes how the information is handled in terms of inputs and outputs, how the data enter to system and leave it. It is effective to use a Data Flow Diagram for creation the system's overview, to show the system's scope and boundaries. There are two different types of notations for DFDs: Yourdon-Coad and Gane-Sarson, which differ in visual representations for processes, data flow, data stores, external entities, etc. Thus, for example the processes are depicted as circles in Yourdon-Coad notation and as rounded squares in Gane-Sarson notation. Gane-Sarson notation is usually used for visualization information systems and Yourdon-Coad - for system analysis and design. The Data Flow Diagrams solution included to Software Development area of ConceptDraw Solution Park offers a lot of DFD templates, samples and examples, libraries of vector stencils for construction without efforts the DFDs according to both Gane-Sarson and Yourdon-Coad notations.Android UI Design Tool
The app's user interface is everything what user see and interact with on its electronic device. Great number of touch screen smartphones and tablets now work under the Linux-based Android operating system. Android UI design is a daunting process which requires certain knowledge, abilities and skills from Android developers and designers. Now it is available the special Android UI design tool - ConceptDraw DIAGRAM diagramming and vector drawing software supplied with Android User Interface Solution from the Software Development Area of ConceptDraw Solution Park.- | How to Design an Interface Mock-up of an Android Application ...
- Process Flowchart | iPhone User Interface - SMS application
- Android User Interface | Android GUI | Block Diagram Of Email Inner ...
- Internal Audit Process | Basic Audit Flowchart . Flowchart Examples
- Plant Layout Plans | Android Phone Storage Process Diagram
- Financial Audit Process Flowchart
- | Android User Interface | How To Make Flowchart In Android Mobile
- Internal Audit Process | Data Flow Diagram (DFD) | Process Flowchart
- How to Design an Interface Mock-up of an Android Application ...
- Process Flowchart Symbols | Internal Audit Process Flowchart Ppt




-sales-flowchart---vector-stencils-library.png--diagram-flowchart-example.png)
-sales-flowchart---vector-stencils-library.png--diagram-flowchart-example.png)

-sales-flowchart---vector-stencils-library.png--diagram-flowchart-example.png)

-sales-flowchart---vector-stencils-library.png--diagram-flowchart-example.png)
-sales-flowchart---vector-stencils-library.png--diagram-flowchart-example.png)

-sales-flowchart---vector-stencils-library.png--diagram-flowchart-example.png)






-sales-flowchart---vector-stencils-library.png--diagram-flowchart-example.png)

-sales-flowchart---vector-stencils-library.png--diagram-flowchart-example.png)
























-sales-flowchart---vector-stencils-library.png--diagram-flowchart-example.png)
-sales-flowchart---vector-stencils-library.png--diagram-flowchart-example.png)








-hr-flowchart---vector-stencils-library.png--diagram-flowchart-example.png)
-hr-flowchart---vector-stencils-library.png--diagram-flowchart-example.png)

-hr-flowchart---vector-stencils-library.png--diagram-flowchart-example.png)

-hr-flowchart---vector-stencils-library.png--diagram-flowchart-example.png)
-hr-flowchart---vector-stencils-library.png--diagram-flowchart-example.png)

-hr-flowchart---vector-stencils-library.png--diagram-flowchart-example.png)






-hr-flowchart---vector-stencils-library.png--diagram-flowchart-example.png)

-hr-flowchart---vector-stencils-library.png--diagram-flowchart-example.png)
















-hr-flowchart---vector-stencils-library.png--diagram-flowchart-example.png)
-hr-flowchart---vector-stencils-library.png--diagram-flowchart-example.png)


