UML Component for Bank
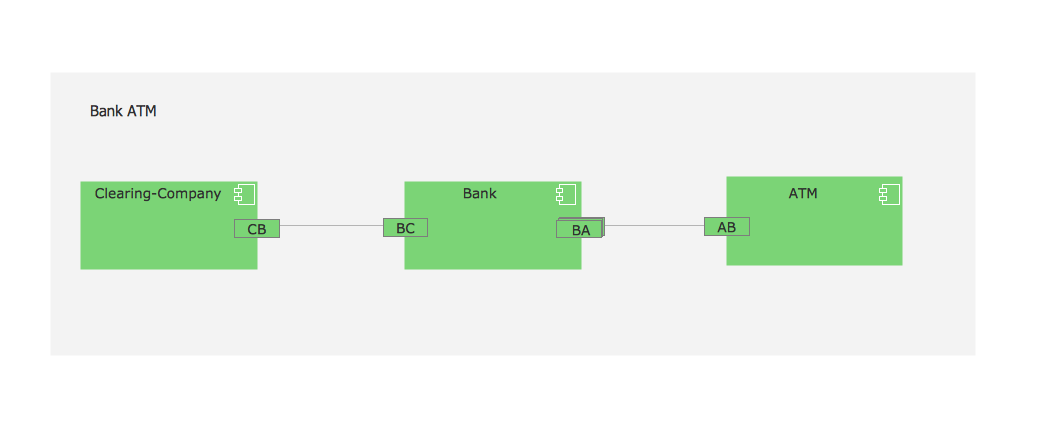
UML Component for Bank - This sample was created in ConceptDraw DIAGRAM diagramming and vector drawing software using the UML Component Diagram library of the Rapid UML Solution from the Software Development area of ConceptDraw Solution ParkBanking System
ConceptDraw DIAGRAM extended with ATM UML Diagrams Solution from the Software Development Area of ConceptDraw Solution Park is a powerful software for representing the ATM processes, for designing and building banking system and ATMs.Diagramming Software for Design UML Use Case Diagrams
Use Case Diagrams describes the functionality provided by a system in terms of actors, their goals represented as use cases, and any dependencies among those use cases.
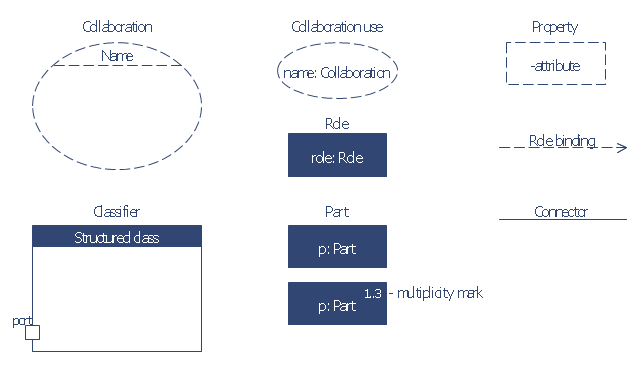
The vector stencils library "Bank UML composite structure diagram" contains 10 shapes for drawing UML composite structure diagrams.
Use it for object-oriented modeling of your bank information system.
"The key composite structure entities identified in the UML 2.0 specification are structured classifiers, parts, ports, connectors, and collaborations.
* Part : A part represents a role played at runtime by one instance of a classifier or by a collection of instances. The part may only name the role, it may name an abstract superclass, or it may name a specific concrete class. The part can include a multiplicity factor, such as the [0..*] shown for Viewer in the diagram.
* Port : A port is an interaction point that can be used to connect structured classifiers with their parts and with the environment. Ports can optionally specify the services they provide and the services they require from other parts of the system. In the diagram, each of the small squares is a port. Each port has a type and is labelled with a name... in the diagram. Ports may contain a multiplicity factor...
* Connector : A connector binds two or more entities together, allowing them to interact at runtime. The connector is shown as a line between some combination of parts, ports and structured classifiers. The diagram shows three connectors between ports, and one connector between a structured classifier and a part.
* Collaboration : A collaboration is generally more abstract than a structured classifier. It is shown as a dotted oval containing roles that instances can play in the collaboration.
* Structured classifier: A StructuredClassifier represents a class, often an abstract class, whose behavior can be completely or partially described through interactions between parts.
An EncapsulatedClassifier is a type of structured classifier that contains ports." [Composite structure diagram. Wikipedia]
This example of UML composite structure diagram symbols for the ConceptDraw PRO diagramming and vector drawing software is included in the ATM UML Diagrams solution from the Software Development area of ConceptDraw Solution Park.
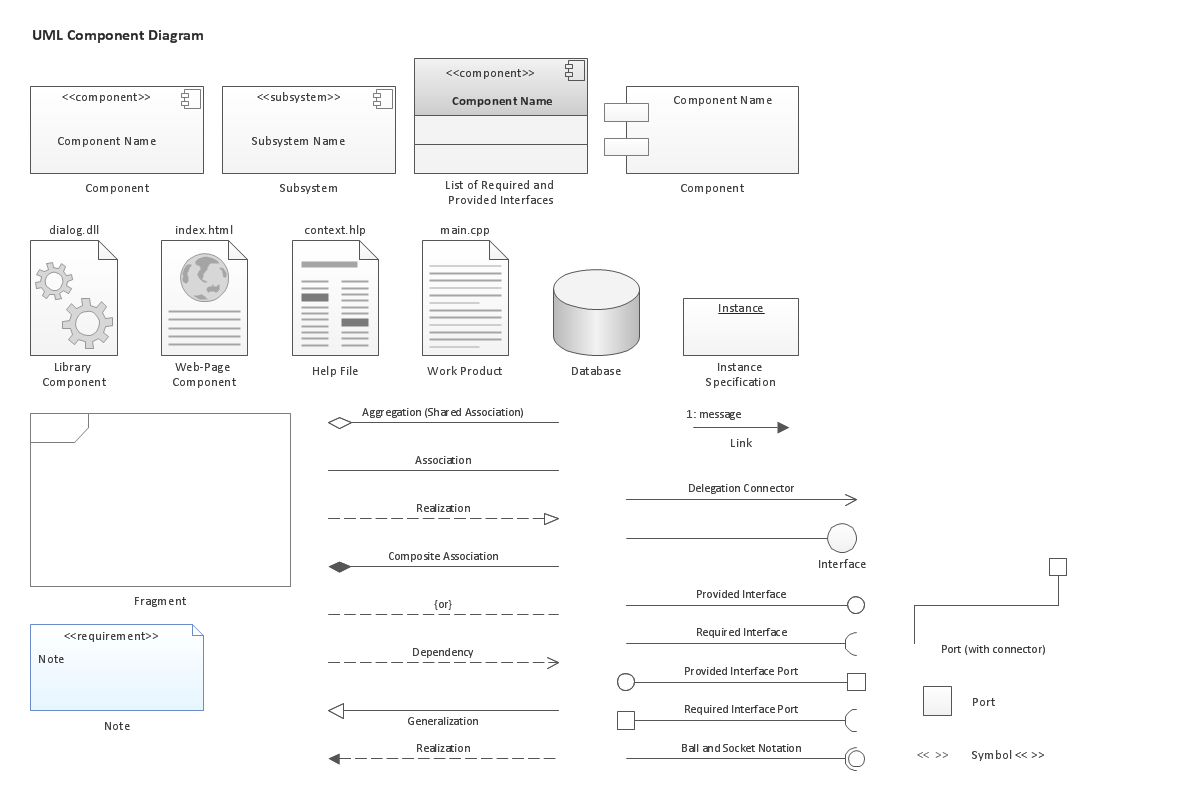
UML Component Diagram. Design Elements
UML Component Diagram illustrates show components are wired together to larger components and software systems that shows the structure of arbitrarily complex systems. Rapid UML Solution for ConceptDraw DIAGRAM contains 13 vector stencils libraries with 393 interactive shapes that you can use to design your UML diagrams. To design a Component Diagram use the UML Component Diagram library. UML Component Diagram library contains 36 shapes
How to Create a Process Flowchart
Use ConceptDraw DIAGRAM diagramming and vector graphics software to visually model your own IT construction processes.UML Diagram Types List
Two types of diagrams are used in UML: Structure Diagrams and Behavior Diagrams. Behavior Diagrams represent the processes proceeding in a modeled environment. Structure Diagrams represent the elements that compose the system.UML Use Case Diagram Example. Registration System
This sample was created in ConceptDraw DIAGRAM diagramming and vector drawing software using the UML Use Case Diagram library of the Rapid UML Solution from the Software Development area of ConceptDraw Solution Park. This sample shows the types of user’s interactions with the system and is used at the registration and working with the database system.Credit Card Processing System UML Diagram
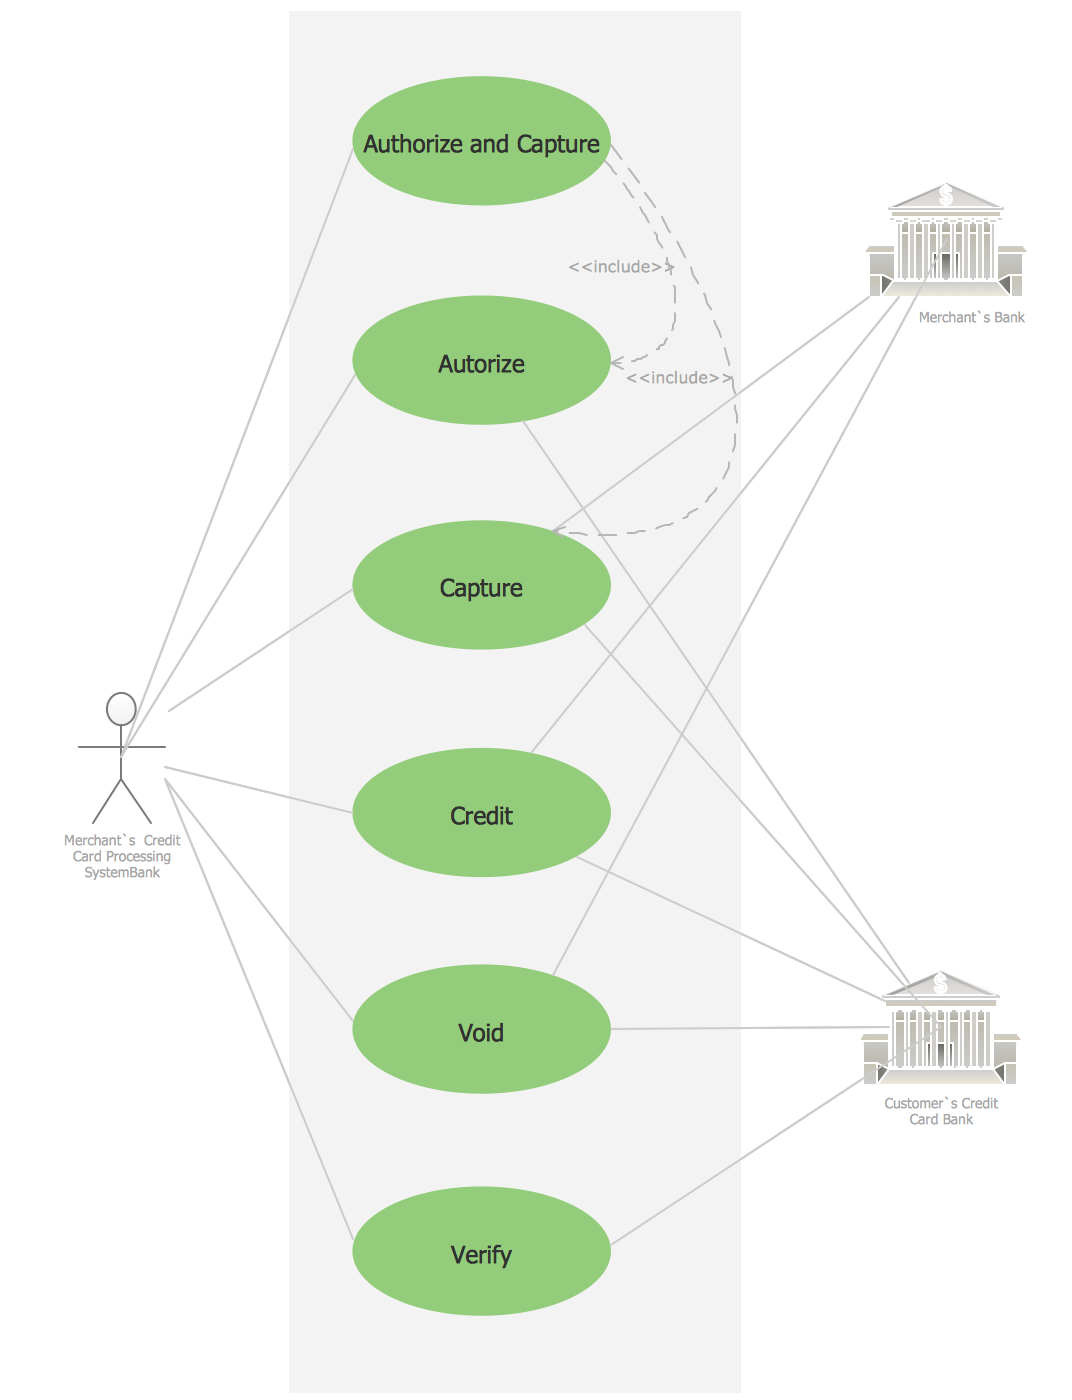
Credit Card Processing System UML Diagram. This sample shows the Use Case Diagram of the credit card processing system. You can see how the payment by credit card occurs. This sample can be used by the bank, financial enterprises, for understanding the work of the credit card processing system at the projecting the banking systems.State Machine Diagram
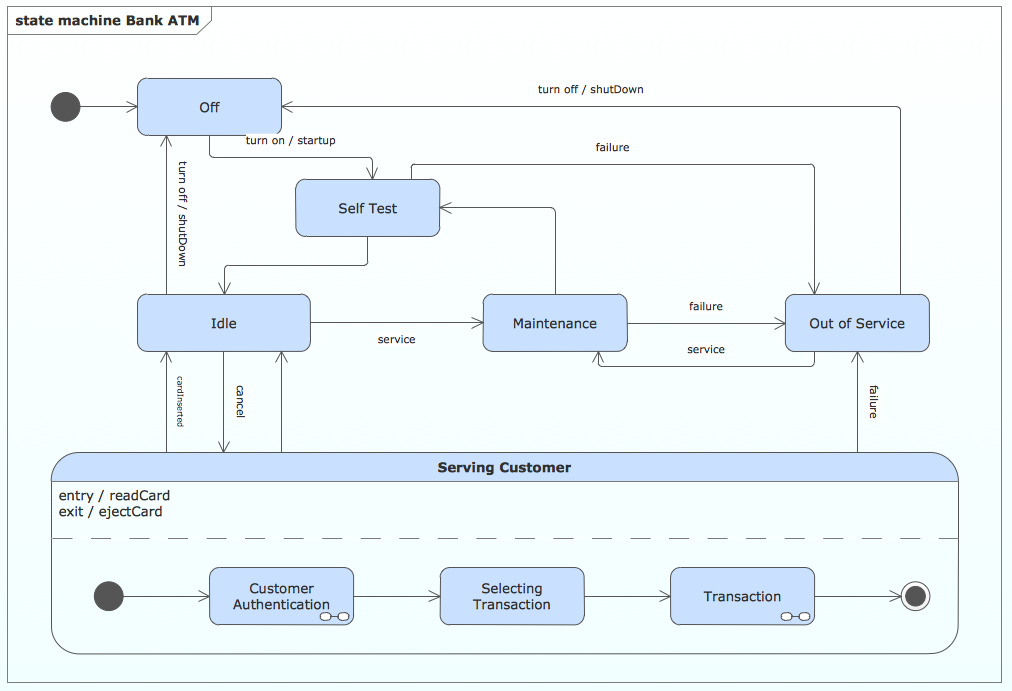
UML state machine's goal is to overcome the main limitations of traditional finite-state machines while retaining their main benefits. ConceptDraw is ideal for software designers and software developers who need to draw UML State Machine Diagrams.
Entity Relationship Software
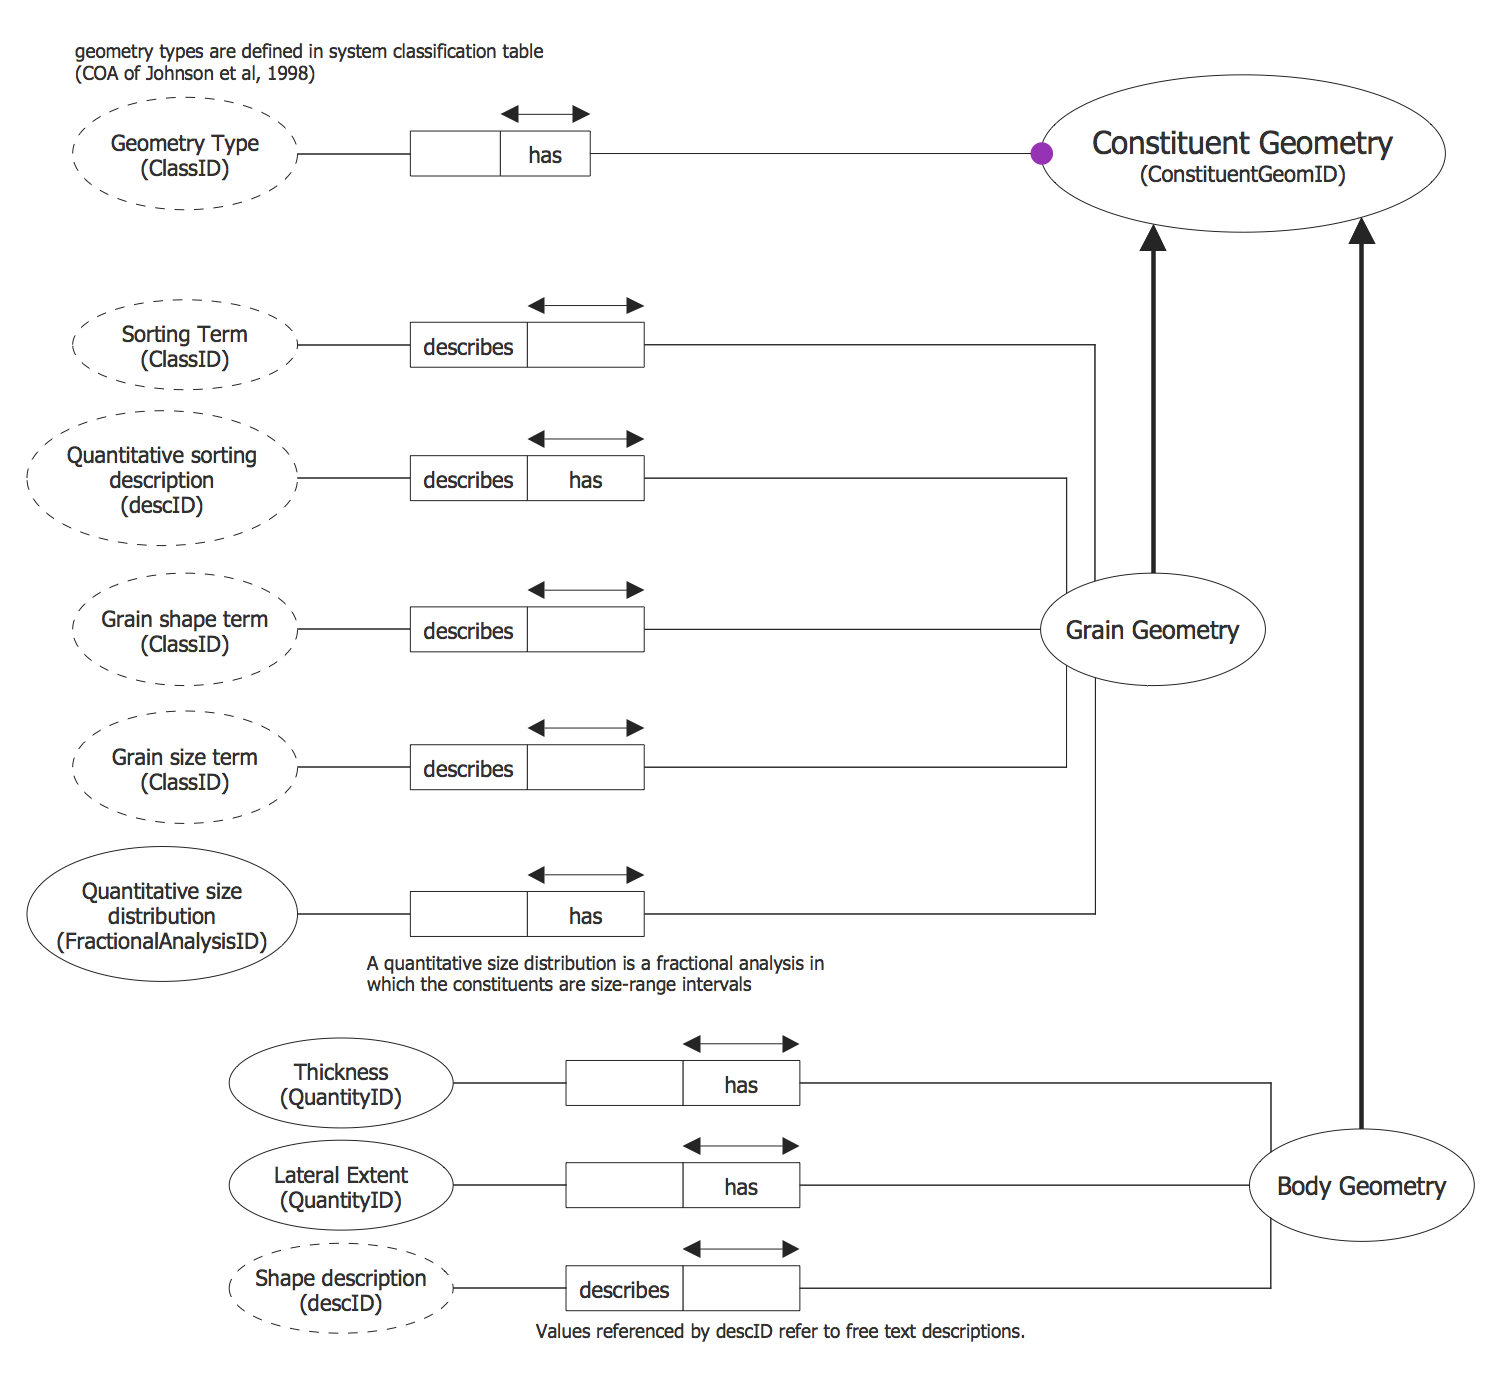
Entity Relationship Diagram (ERD) is a leading data modeling tool that is used to illustrate the logical structure of database, helps to organize and represent your project's data in terms of entities, attributes and relationships. To describe the database structure usually is used the ERD Chen's or Crow's Foot notation. Chen's notation supposes the representation of entities by rectangles with the entities names inside, relationships by diamonds and attributes by ovals connected with a line to exactly one entity. In Crow's Foot notation the boxes are used to depict the entities and their attributes, the lines between them - to depict relationships. ConceptDraw DIAGRAM software extended with Entity-Relationship Diagram (ERD) Solution is convenient and useful for designing the ER Diagrams, and supports the use of Chen's or Crow’s Foot notation according to your needs and desires. The ERD diagrams produced with ConceptDraw DIAGRAM Entity Relationship Diagram software can be successfully used in whitepapers, presentations, posters, datasheets, technical materials, etc.Data Modeling Diagram
The vector stencils library Activity diagrams from the solution Rapid UML contains specific data modeling symbols for ConceptDraw DIAGRAM diagramming and vector drawing software. The Rapid UML solution is contained in the Software Development area of ConceptDraw Solution Park.
 Rapid UML
Rapid UML solution extends ConceptDraw DIAGRAM software with templates, samples and libraries of vector stencils for quick drawing the UML diagrams using Rapid Draw technology.
 ATM UML Diagrams
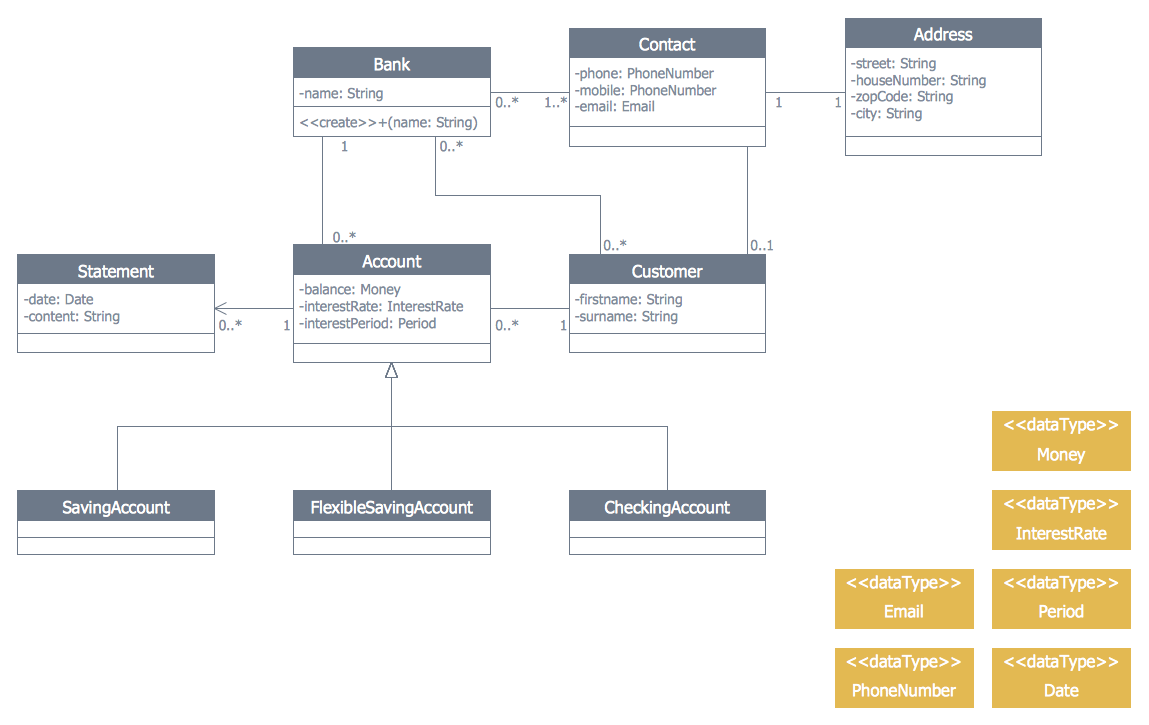
The ATM UML Diagrams solution lets you create ATM solutions and UML examples. Use ConceptDraw DIAGRAM as a UML diagram creator to visualize a banking system.
Data Flow Diagrams
Data Flow Diagram (DFD) is a special chart type which lets graphically illustrate the "flow" of data through an information system. So the Data Flow Diagrams can be successfully used for visualization of data processing or structured design, for creation an overview of the system, for business process modeling, for exploring the high-level design in terms of data flows and documenting the major data flows. Inclusion of powerful Data Flow Diagrams solution to the Software Development area of ConceptDraw Solution Park makes the ConceptDraw DIAGRAM a beneficial data flow diagramming software and supplies it with numerous collection of quick-start templates, professionaly designed samples, and extensive range of ready-for-use vector objects consisting the Data Flow Diagrams, Gane-Sarson Notation, and Yourdon and Coad Notation libraries. Use the ConceptDraw DIAGRAM application to design easy and quickly the Data Flow Diagrams including the data storages, data flows, external entities, functional transforms, control transforms and signals.Data Model
A data model is what can determine the structure of data as a whole. Different data models can be specified in any data modeling notation, which can be often graphical in its form. Any data model can sometimes also be referred to as a so-called “data structure”. It can especially happen in the context of the different programming languages. Data models can be also often complemented by the different function models, especially in the context of the enterprise ones.Entity Relationship Diagram Software for Mac
Great part of modern approaches to the database design are based on the use of different versions of ER-models. The important feature of entity-relationship model is that it can be visually represented as a graphical diagram. ER-models and Entity Relationship Diagrams are so popular due to the simplicity and the presentation clarity. The conceptual basis led to their widespread use in CASE-systems, which support automatic design of relational databases. The typical concepts for ER-models are entity, relation and attribute. Relation is a graphically represented association between two entities, that establishes certain rules and all instances of the linked entity types are subject to these rules. In common ER-model this association is always binary. For representing entity-relationship elements, there are used Crow’s foot and Chen notations. ConceptDraw DIAGRAM is a famous Entity Relationship Diagram software for Mac OSX which gives the ability to describe visually the databases with Chen’s and Crow’s Foot notation icons from Entity-Relationship Diagram (ERD) solution.Software Diagram Examples and Templates
ConceptDraw DIAGRAM is a powerful tool for business and technical diagramming. Software Development area of ConceptDraw Solution Park provides 5 solutions: Data Flow Diagrams, Entity-Relationship Diagram (ERD), Graphic User Interface, IDEFO Diagrams, Rapid UML.Financial Trade UML Use Case Diagram Example
This sample represents the actors, use cases and dependencies between them, and also the relationships between use cases. There are used dependency and use case generalization associations on this UML diagram. Use case generalization is used when you have two similar use cases, but one of them does more than another. This sample shows the work of the Financial Trade sphere and can be used by trading companies, commercial organizations, traders, different exchanges.Example of DFD for Online Store (Data Flow Diagram)
Data Flow Diagram (DFD) is a methodology of graphical structural analysis and information systems design, which describes the sources external in respect to the system, recipients of data, logical functions, data flows and data stores that are accessed. DFDs allow to identify relationships between various system's components and are effectively used in business analysis and information systems analysis. They are useful for system’s high-level details modeling, to show how the input data are transformed to output results via the sequence of functional transformations. For description of DFD diagrams are uses two notations — Yourdon and Gane-Sarson, which differ in syntax. Online Store DFD example illustrates the Data Flow Diagram for online store, the interactions between Customers, Visitors, Sellers, depicts User databases and the flows of Website Information. ConceptDraw DIAGRAM enhanced with Data Flow Diagrams solution lets you to draw clear and simple example of DFD for Online Store using special libraries of predesigned DFD symbols.
- Banking System Entity Relationship Diagram Using Crows Foot
- Entity -Relationship Diagram (ERD) | Er Diagram Of Banking System ...
- Crows Foot Notation Of Banking System
- Entity -Relationship Diagram (ERD) | Er Diagram For Banking ...
- Er Diagram For Atm Banking System
- Entity Relationship Diagram Examples | UML Class Diagram ...
- Data Flow Diagrams (DFD) | Entity -Relationship Diagram (ERD ...
- Er Diagram For Banking System With Explanation Pdf
- Er Diagram For Atm Banking System Pdf
- Er Diagram Banking System Pdf
- Entity Relationship Diagram For Bank Atm System In Pdf Download
- Bank Management System Pdf File Dfd And Erd
- Draw Er Diagram In Banking System In Dbms
- Er Diagram For Banking System In Dbms
- Banking Management System Er Diagram Hd Photos
- Er Diagram For Bank Management System Pdf
- Draw Er Diagram For Bank Management System Pdf
- Er Diagram Of Banking Management System Download
- UML Use Case Diagram Example. Registration System | Entity ...
- Entity -Relationship Diagram (ERD) | Er Diagram For Atm System
