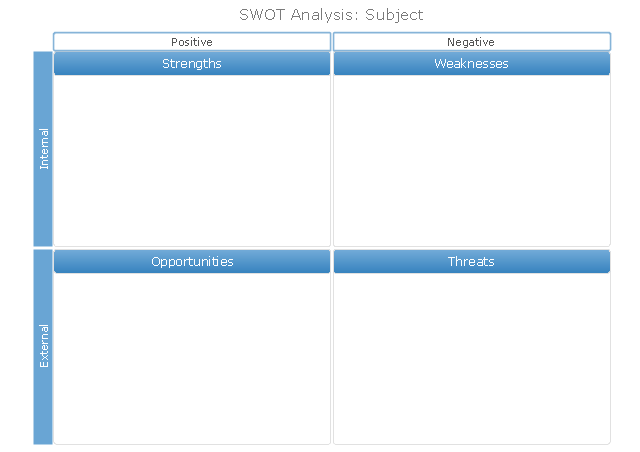
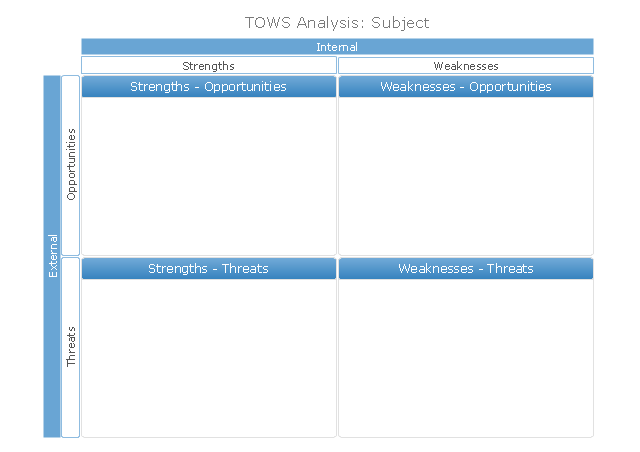
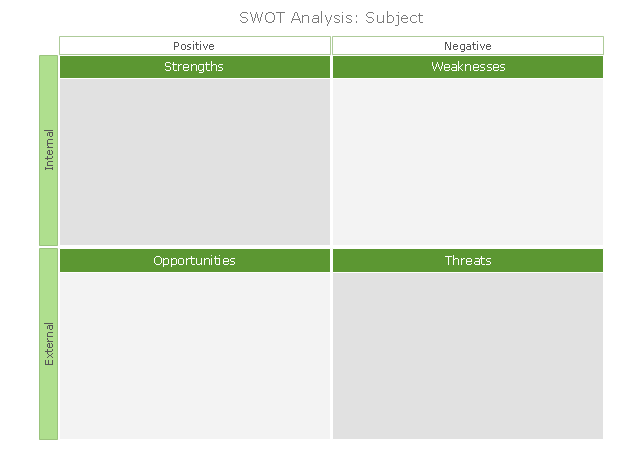
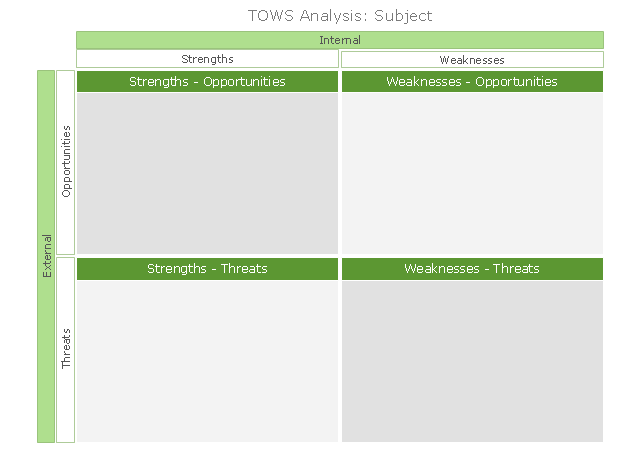
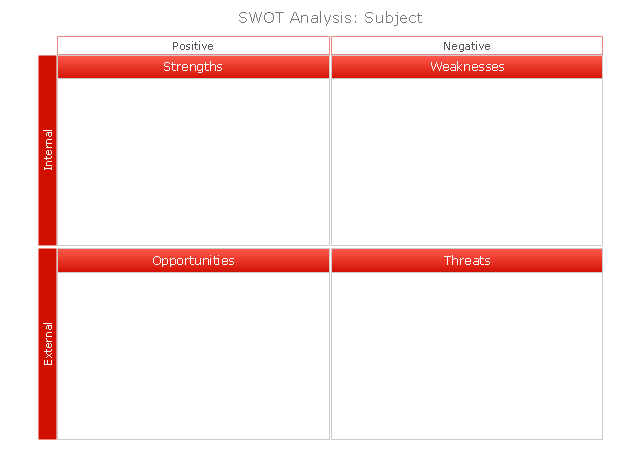
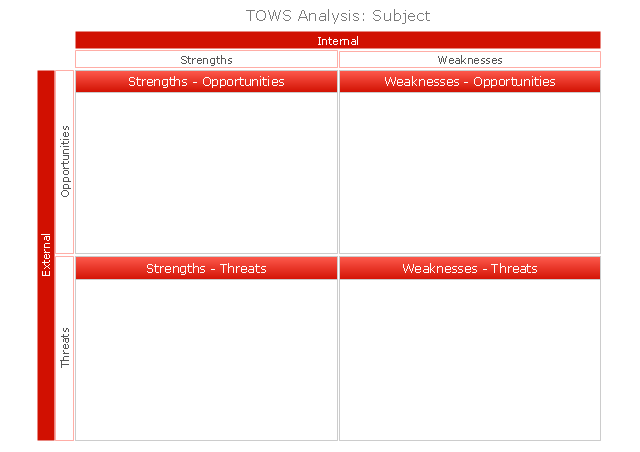
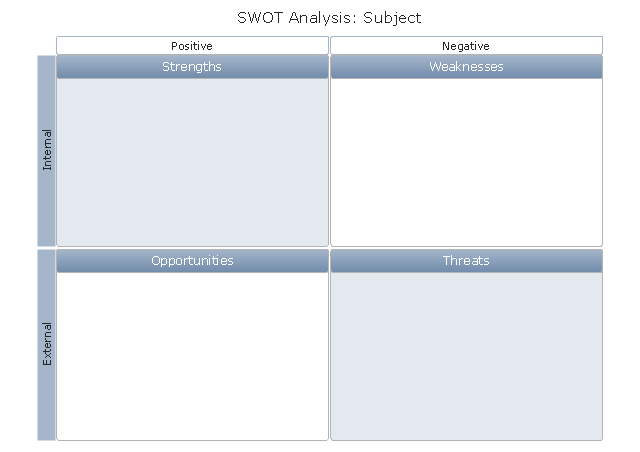
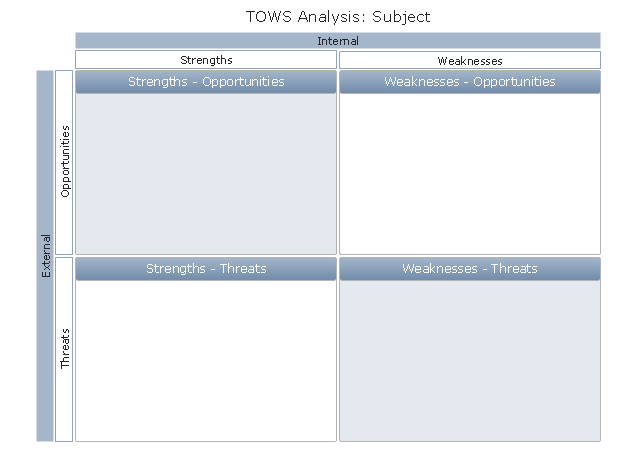
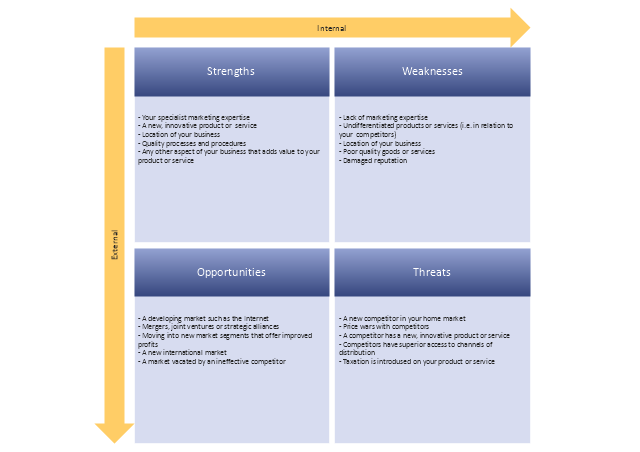
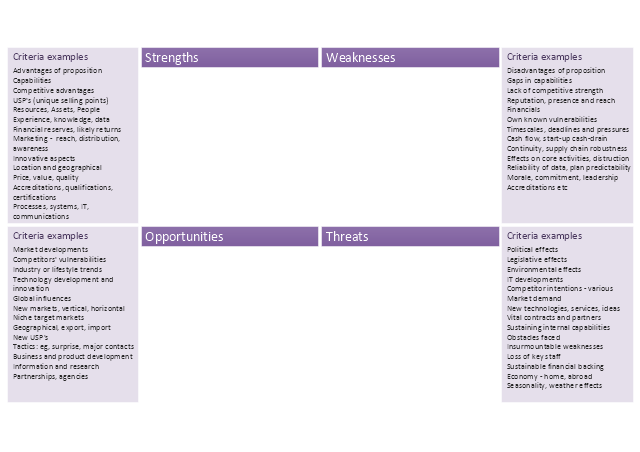
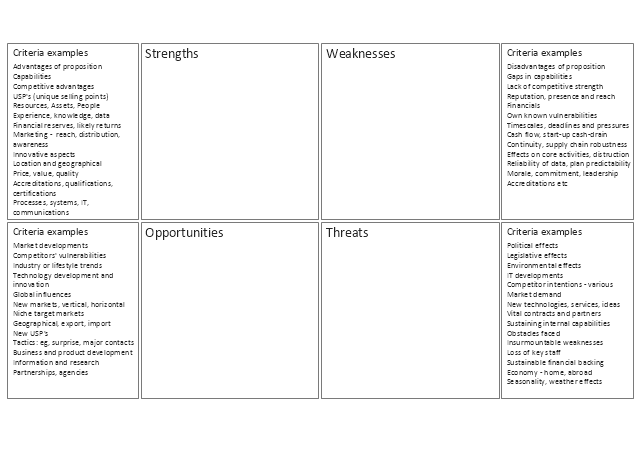
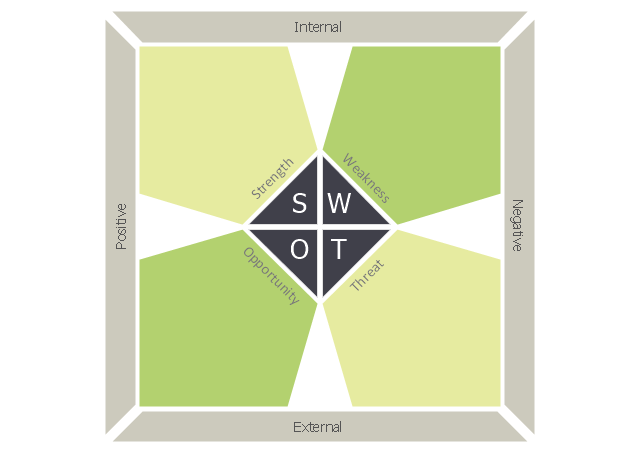
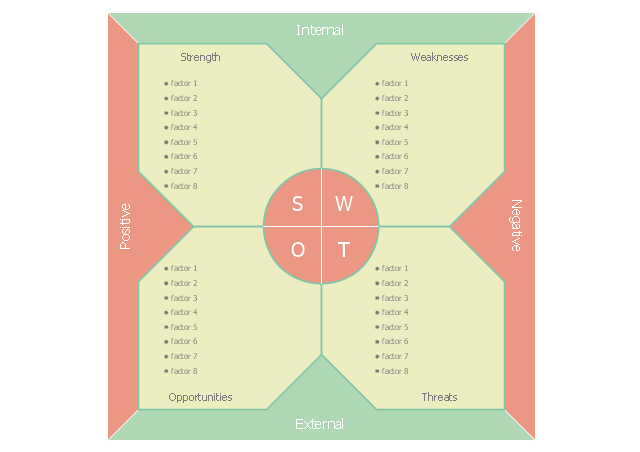
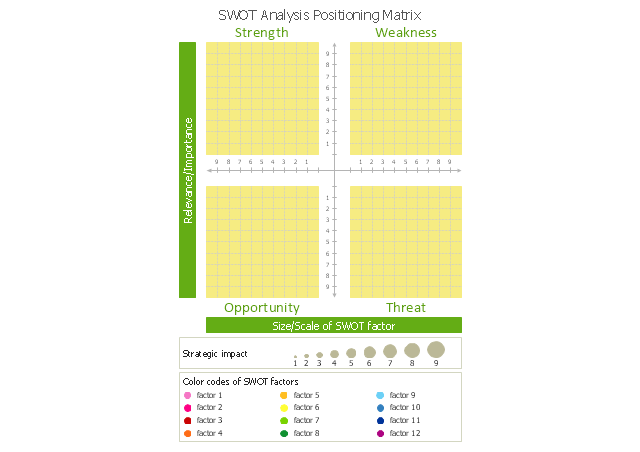
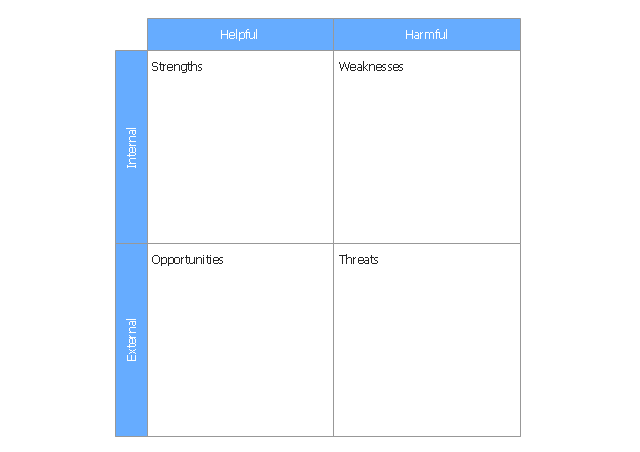
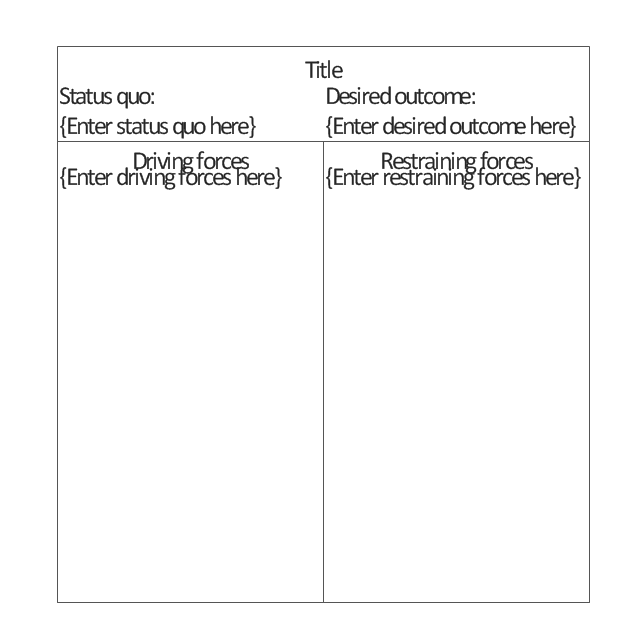
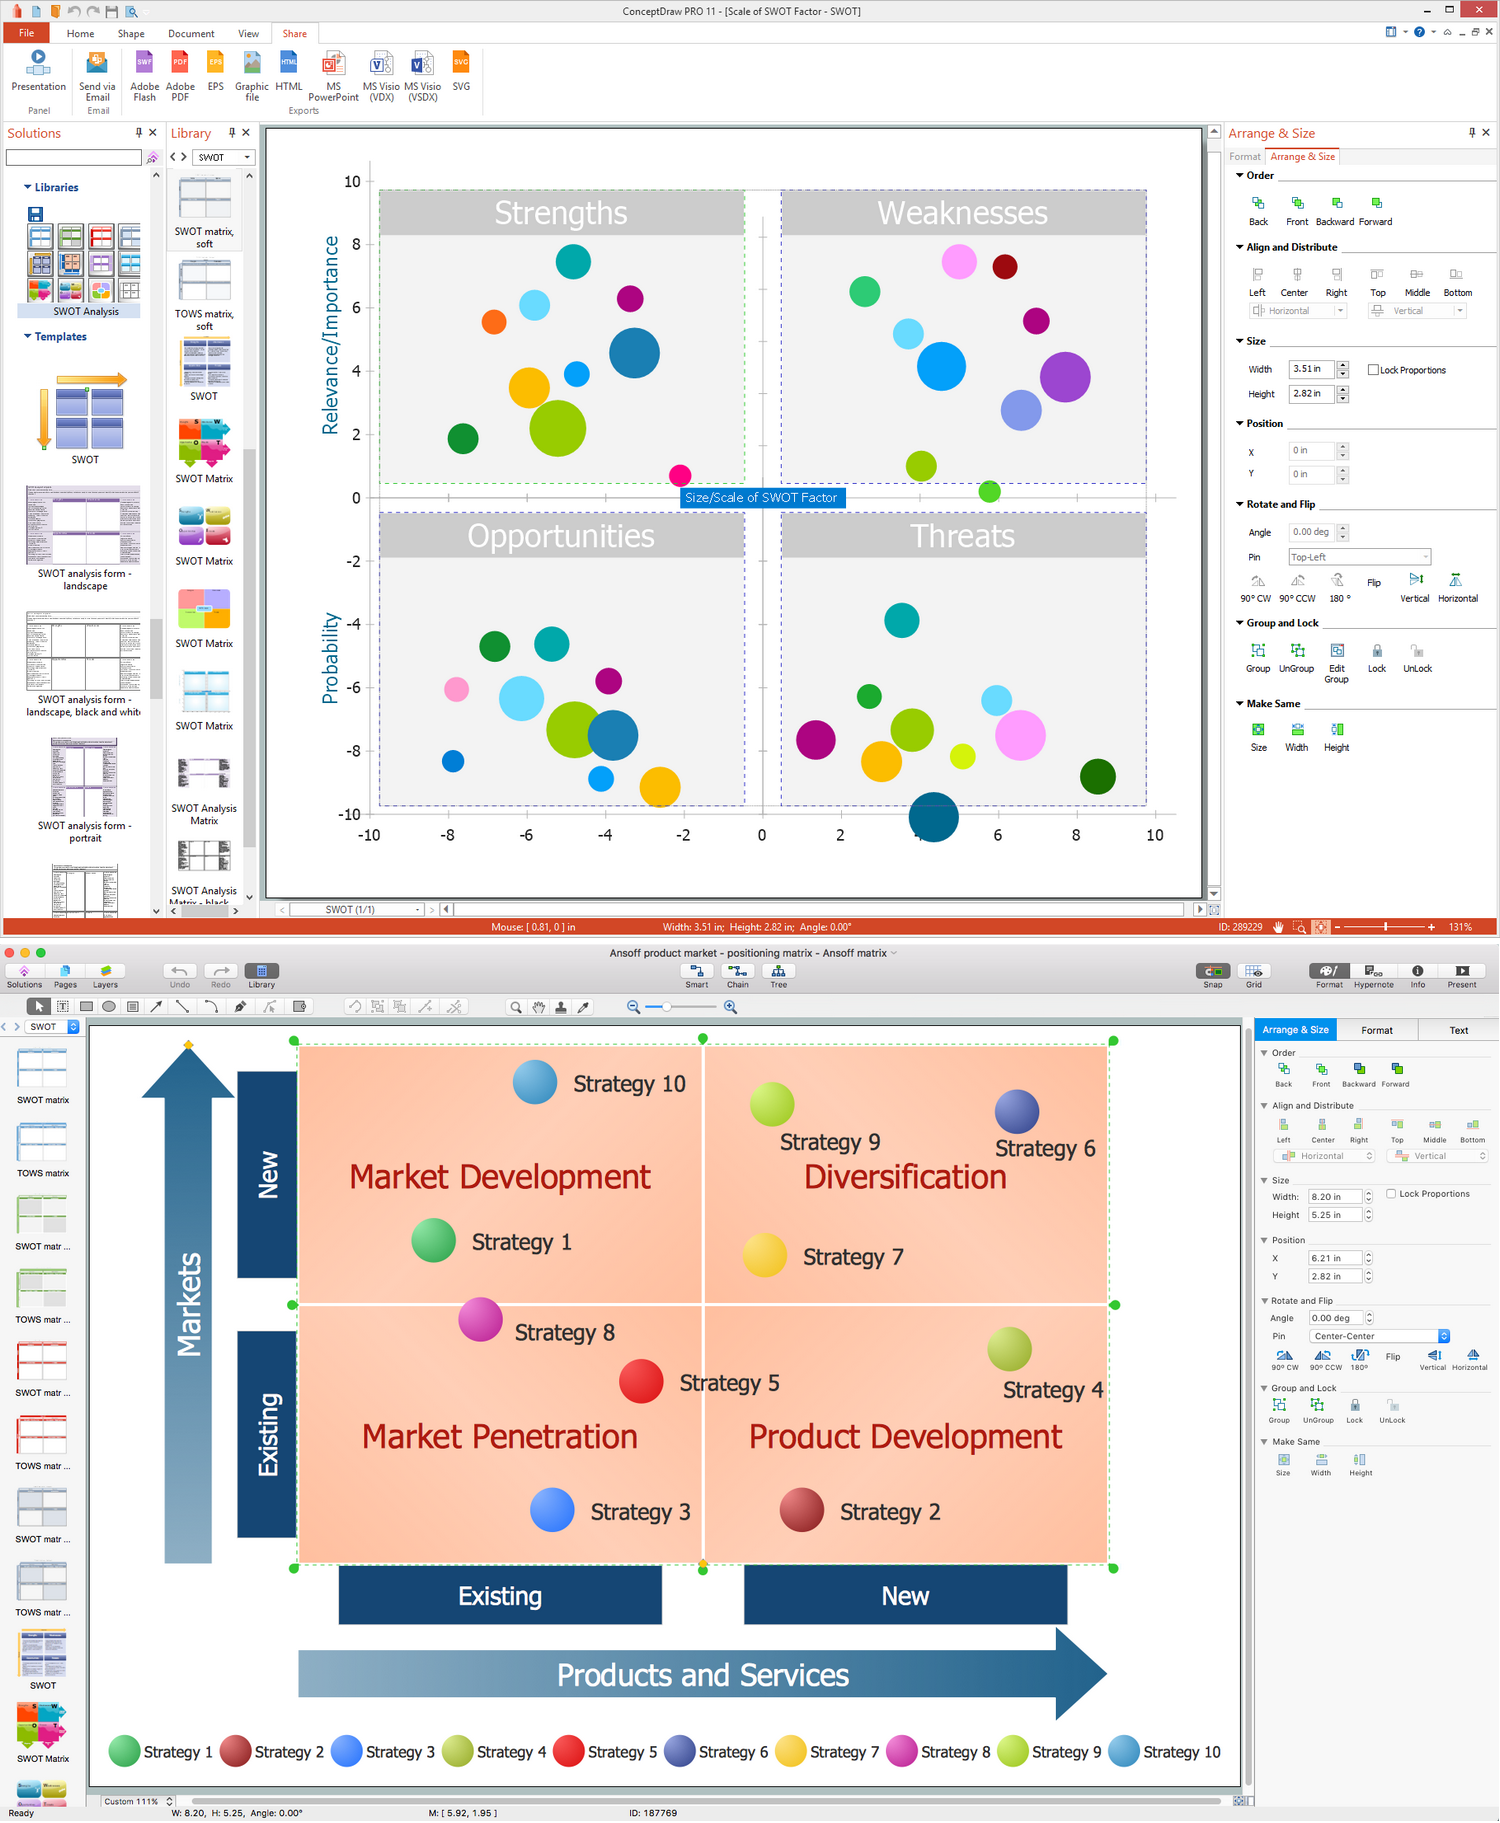
The vector stencils library "SWOT" contains 19 SWOT and TOWS analysis matrix diagram templates. Use it to create your SWOT and TOWS matrices in the ConceptDraw PRO diagramming and vector drawing software extended with the SWOT Analysis solution from the Management area of ConceptDraw Solution Park.
The vector stencils library "SWOT" contains 19 SWOT and TOWS analysis matrix diagram templates. Use it to create your SWOT and TOWS matrices in the ConceptDraw PRO diagramming and vector drawing software extended with the SWOT Analysis solution from the Management area of ConceptDraw Solution Park.
The vector stencils library "TQM diagrams" contains 58 TQM symbols. Use it in business process re-engineering, total quality management, continuous improvement, and quality solutions to draw cause-and-effect diagrams, top-down, and cross-functional process flow charts in the ConceptDraw PRO diagramming and vector drawing software extended with the Total Quality Management (TQM) Diagrams solution from the Quality area of ConceptDraw Solution Park.
SWOT Matrix Software
The SWOT Analysis solution from the Management area of ConceptDraw Solution Park contains set of examples, templates and vector design elements of SWOT and TOWS matrices. It helps you to quickly draw SWOT and TOWS analysis matrix diagrams using the best SWOT matrix software ConceptDraw DIAGRAM.The vector stencils library "SWOT" contains 19 SWOT and TOWS analysis matrix diagram templates. Use it to create your SWOT and TOWS matrices in the ConceptDraw PRO diagramming and vector drawing software extended with the SWOT Analysis solution from the Management area of ConceptDraw Solution Park.
Flowchart design. Flowchart symbols, shapes, stencils and icons
A flowchart is a type of diagram which represents an algorithm, process or workflow, displays the steps as boxes of various kinds and depicts their order by connecting them with arrows. Any business graphic document will be more colorful and understandable if will use professional-looking and visual diagrams and flowcharts. Flowchart design gives versatile presenting and explaining of the process. ConceptDraw DIAGRAM flowchart software enhanced with Flowcharts solution helps effectively make Flowchart Design. Use of predesigned flowchart symbols and bright color palette offers a fresh view and favorably distinguishes the flowcharts designed in ConceptDraw DIAGRAM from the black and white flowcharts on a paper. Preferably to use no more than three or four colors and apply identical for the same shape types. The best flowchart design can be achieved by starting with Flowchart template, or any of suitable ready examples or samples offered in ConceptDraw STORE, open one of them and enter the proper text into each Flowchart shape. Each symbol of the flowchart has a definition that can't be changed. This means that all flowcharts shapes can be grouped in according to their meaning. Users with ConceptDraw DIAGRAM flowchart software can style groups of symbols with close definitions by color sets chosen from complementary palette. Almost all workflows can be depicted as a flowchart. Colored diagrams are more light for perception of the certain information, this is part of flowchart design. Bright colors need to be used in the key points of Decision symbols, to focus attention on their importance for whole process flow.
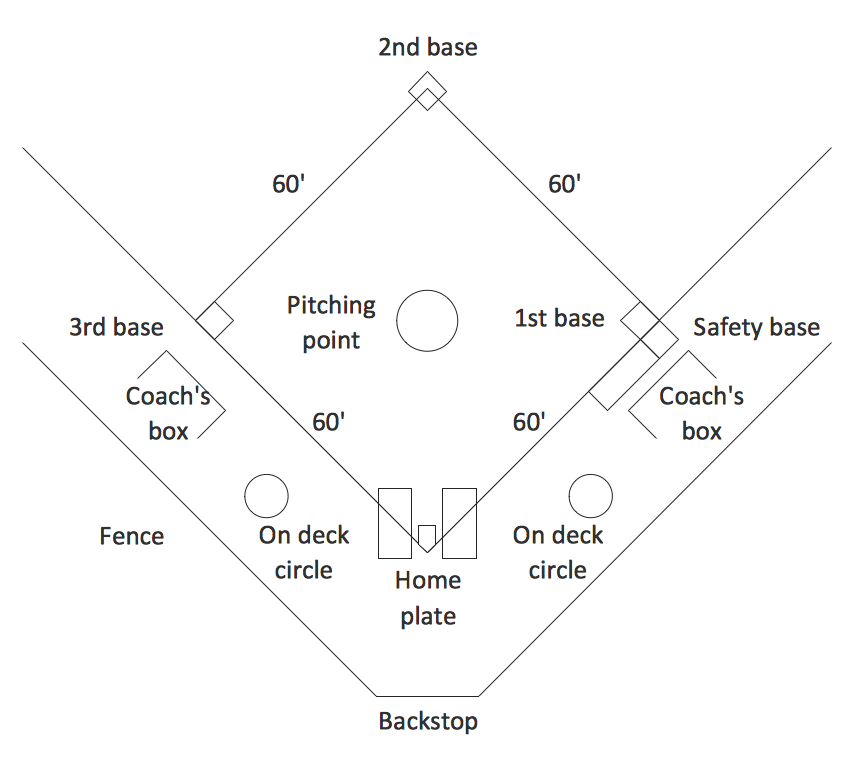
Simple Baseball Field — Sample
The Baseball solution for ConceptDraw DIAGRAM software contains a set of libraries, templates and samples allowing football specialists to draw baseball diagrams with ease. A set of predesigned fields and positions allows producing baseball diagrams without any drawing experience.Business Process Mapping — How to Map a Work Process
ConceptDraw DIAGRAM is a world-class diagramming platform that lets you display, communicate, and present dynamically. It′s powerful enough to draw everything from basic flowcharts to complex engineering schematics. Video tutorials on ConceptDraw products. Try it today!Create a Flow Chart
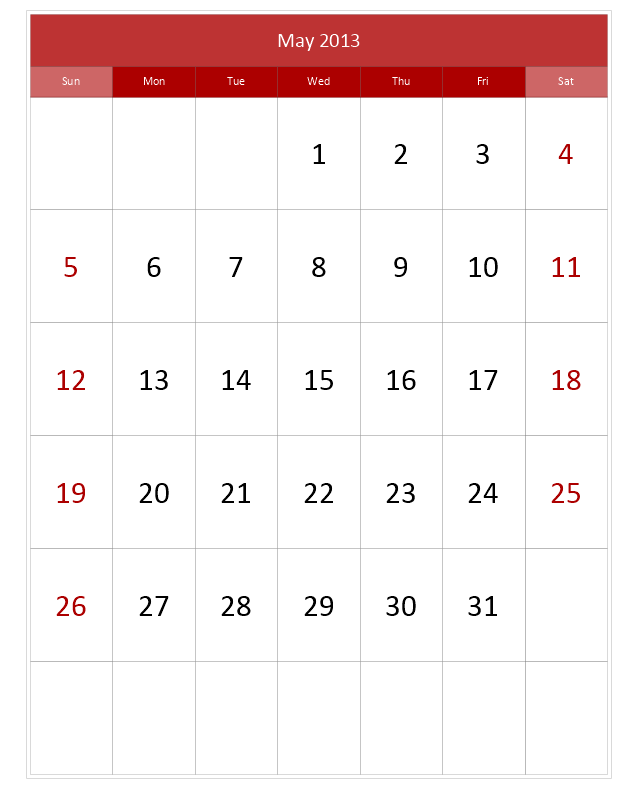
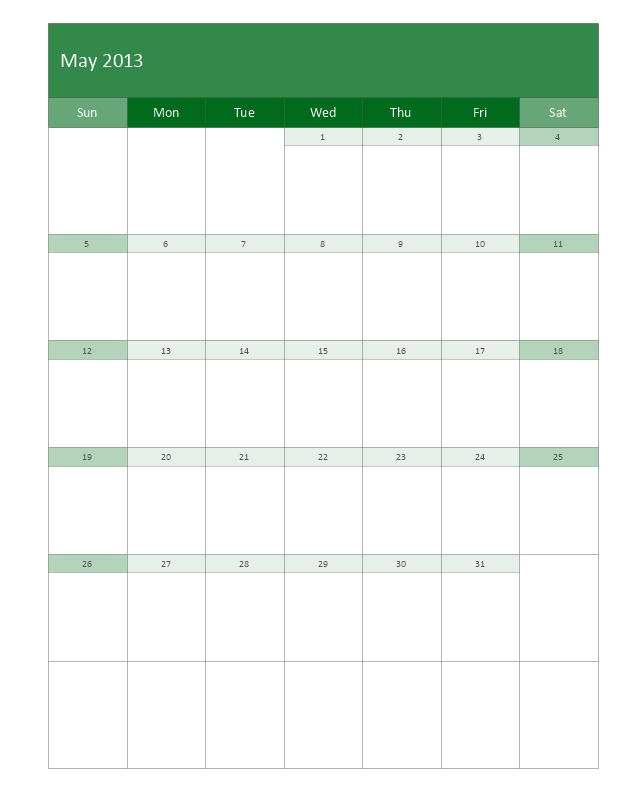
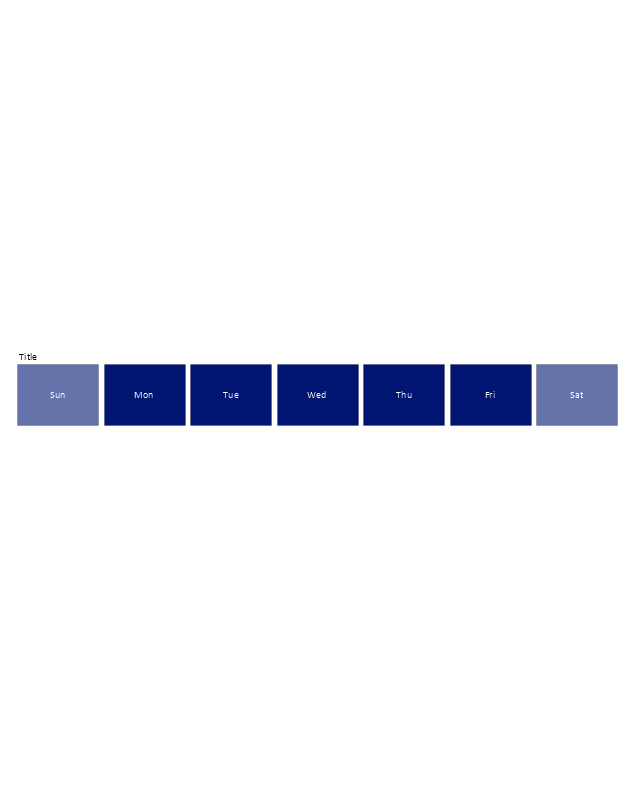
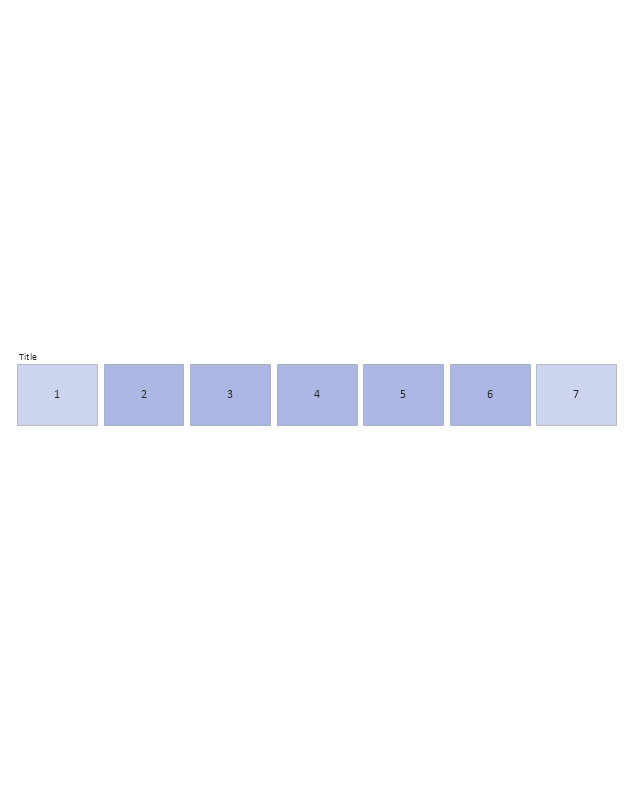
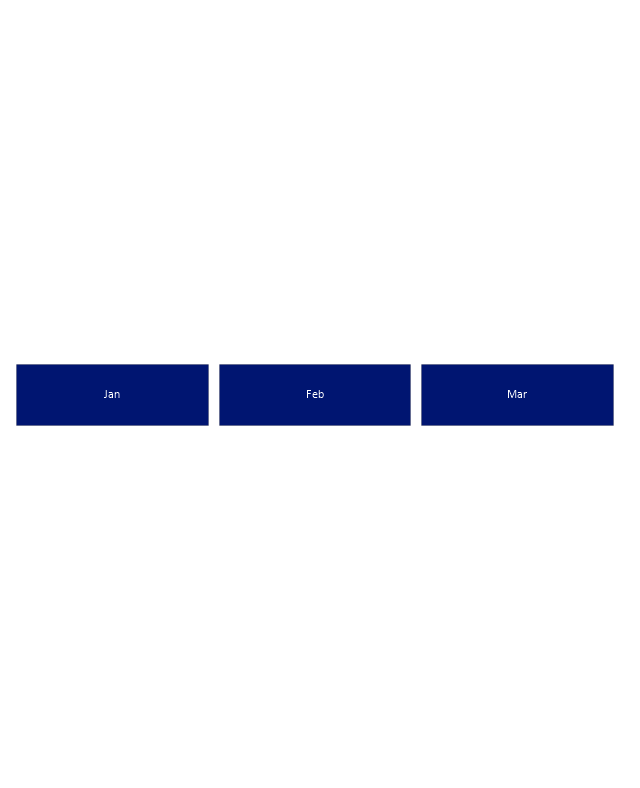
Users can start drawing their own flowchart diagrams in fast and simple way with ConceptDraw software.The vector stencils library "Calendars" contains 44 shapes of month calendars, marker icons and symbols for schedules, and clocks. Use it to create your calendars in the ConceptDraw PRO diagramming and vector drawing software extended with the Calendars solution from the Management area of ConceptDraw Solution Park.
S Video Connection
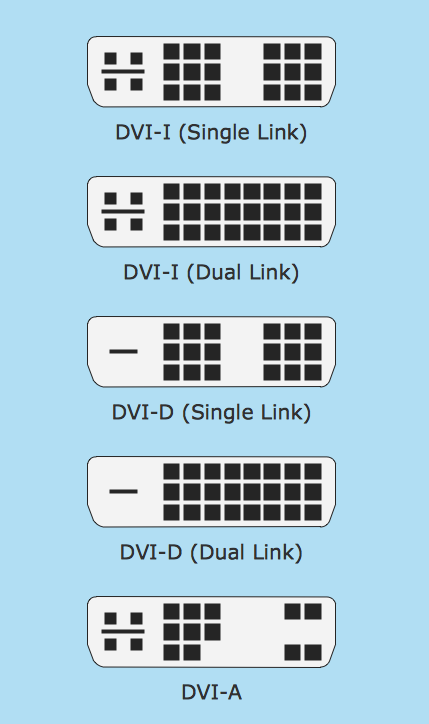
S-Video is a signaling standard for standard definition video. ConceptDraw DIAGRAM diagramming and vector drawing software extended with Audio and Video Connectors Solution from the Industrial Engineering Area can be helpful for demostrating and explaining the S Video connection which is widely used on TVs and home theater receivers.Create Flowchart
The Flowchart is a very popular type of diagram, it is widely used for analyzing, designing, managing and visualizing the business and technical processes, various software algorithms. But how to create Flowchart quick and easy? Flowcharts solution from the Diagrams area of ConceptDraw Solution Park helps you to design the professional looking Flowchart Diagrams quick and easy using the ConceptDraw DIAGRAM diagramming and vector drawing software.Social Media Flowchart Symbols
Social media is a popular view of mass communication which allows people, companies and organizations create, share, discover, modify, access, comment, discuss and exchange information through the Internet. Social Media Response solution for ConceptDraw DIAGRAM provides collection of 10 libraries with diversity of predesigned vector social media flowchart symbols for fast and easy creating interactive Social Media Flowcharts, Response Charts and Action Mind Maps.Entity Relationship Software
Entity Relationship Diagram (ERD) is a leading data modeling tool that is used to illustrate the logical structure of database, helps to organize and represent your project's data in terms of entities, attributes and relationships. To describe the database structure usually is used the ERD Chen's or Crow's Foot notation. Chen's notation supposes the representation of entities by rectangles with the entities names inside, relationships by diamonds and attributes by ovals connected with a line to exactly one entity. In Crow's Foot notation the boxes are used to depict the entities and their attributes, the lines between them - to depict relationships. ConceptDraw DIAGRAM software extended with Entity-Relationship Diagram (ERD) Solution is convenient and useful for designing the ER Diagrams, and supports the use of Chen's or Crow’s Foot notation according to your needs and desires. The ERD diagrams produced with ConceptDraw DIAGRAM Entity Relationship Diagram software can be successfully used in whitepapers, presentations, posters, datasheets, technical materials, etc.- Geo Map - Asia - Philippines | Philippine Map Black And White ...
- SWOT - Vector stencils library
- Metropolitan Area Network Black And White Diagram
- Football Pitch Black And White
- Person Resemblance Vector Black And White
- Black And White Telecom Dish
- Black And White Cartoon Map
- Black And White Electronic Diagram Vector
- Site Plan Grass Black And White Hand Drawing
- Map Of Canada Black And White
- Simple Black And White User Manual Template Word
- Profession Clipart Black And White
- A Black And White Illustrations Of A Pan Network
- Football Field Drawing Black And White
- Database Flowchart Symbol In Black And White Color
- River Clipart Black And White
- Standard Football Field Dimension Black And White
- Direction Clipart Black And White
- European Map Black And White Png
- SWOT Analysis Matrix - black and white







-tqm-diagrams---vector-stencils-library.png--diagram-flowchart-example.png)
-tqm-diagrams---vector-stencils-library.png--diagram-flowchart-example.png)
-tqm-diagrams---vector-stencils-library.png--diagram-flowchart-example.png)
-tqm-diagrams---vector-stencils-library.png--diagram-flowchart-example.png)






-tqm-diagrams---vector-stencils-library.png--diagram-flowchart-example.png)


-tqm-diagrams---vector-stencils-library.png--diagram-flowchart-example.png)
-tqm-diagrams---vector-stencils-library.png--diagram-flowchart-example.png)
-tqm-diagrams---vector-stencils-library.png--diagram-flowchart-example.png)
-tqm-diagrams---vector-stencils-library.png--diagram-flowchart-example.png)
-tqm-diagrams---vector-stencils-library.png--diagram-flowchart-example.png)
-tqm-diagrams---vector-stencils-library.png--diagram-flowchart-example.png)
-tqm-diagrams---vector-stencils-library.png--diagram-flowchart-example.png)
-tqm-diagrams---vector-stencils-library.png--diagram-flowchart-example.png)
-tqm-diagrams---vector-stencils-library.png--diagram-flowchart-example.png)
-tqm-diagrams---vector-stencils-library.png--diagram-flowchart-example.png)
-tqm-diagrams---vector-stencils-library.png--diagram-flowchart-example.png)
-tqm-diagrams---vector-stencils-library.png--diagram-flowchart-example.png)
-tqm-diagrams---vector-stencils-library.png--diagram-flowchart-example.png)










-calendars---vector-stencils-library.png--diagram-flowchart-example.png)
-calendars---vector-stencils-library.png--diagram-flowchart-example.png)
-calendars---vector-stencils-library.png--diagram-flowchart-example.png)
-calendars---vector-stencils-library.png--diagram-flowchart-example.png)
-calendars---vector-stencils-library.png--diagram-flowchart-example.png)
-calendars---vector-stencils-library.png--diagram-flowchart-example.png)
-calendars---vector-stencils-library.png--diagram-flowchart-example.png)
-calendars---vector-stencils-library.png--diagram-flowchart-example.png)
-calendars---vector-stencils-library.png--diagram-flowchart-example.png)
-calendars---vector-stencils-library.png--diagram-flowchart-example.png)
-calendars---vector-stencils-library.png--diagram-flowchart-example.png)


-calendars---vector-stencils-library.png--diagram-flowchart-example.png)


-calendars---vector-stencils-library.png--diagram-flowchart-example.png)
-calendars---vector-stencils-library.png--diagram-flowchart-example.png)
-calendars---vector-stencils-library.png--diagram-flowchart-example.png)
-calendars---vector-stencils-library.png--diagram-flowchart-example.png)
-calendars---vector-stencils-library.png--diagram-flowchart-example.png)
-calendars---vector-stencils-library.png--diagram-flowchart-example.png)
-calendars---vector-stencils-library.png--diagram-flowchart-example.png)
-calendars---vector-stencils-library.png--diagram-flowchart-example.png)
-calendars---vector-stencils-library.png--diagram-flowchart-example.png)
-calendars---vector-stencils-library.png--diagram-flowchart-example.png)
-calendars---vector-stencils-library.png--diagram-flowchart-example.png)
