Flowchart design. Flowchart symbols, shapes, stencils and icons


UML Deployment Diagram. Design Elements

IDEF0 Flowchart Symbols

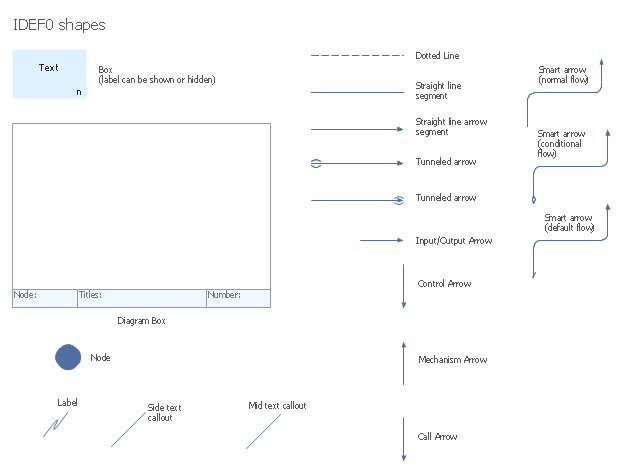
The vector stencils library "IDEF0 diagrams" contains 18 symbols for drawing IDEF0 function modeling diagrams using the ConceptDraw PRO diagramming and vector drawing software.
"The IDEF0 model ... is based on a simple syntax. Each activity is described by a verb-based label placed in a box. Inputs are shown as arrows entering the left side of the activity box while output are shown as exiting arrows on the right side of the box. Controls are displayed as arrows entering the top of the box and mechanisms are displayed as arrows entering from the bottom of the box. Inputs, Controls, Outputs, and Mechanisms are all referred to as concepts.
- Arrow : A directed line, composed of one or more arrow segments, that models an open channel or conduit conveying data or objects from source (no arrowhead) to use (with arrowhead). There are 4 arrow classes: Input Arrow, Output Arrow, Control Arrow, and Mechanism Arrow (includes Call Arrow). See Arrow Segment, Boundary Arrow, Internal Arrow.
- Box : A rectangle, containing a name and number, used to represent a function.
- Context : The immediate environment in which a function (or set of functions on a diagram) operates.
- Decomposition : The partitioning of a modeled function into its component functions.
- Fork : The junction at which an IDEF0 arrow segment (going from source to use) divides into two or more arrow segments. May denote unbundling of meaning.
- Function : An activity, process, or transformation (modeled by an IDEF0 box) identified by a verb or verb phrase that describes what must be accomplished.
- Join : The junction at which an IDEF0 arrow segment (going from source to use) merges with one or more other arrow segments to form a single arrow segment. May denote bundling of arrow segment meanings.
- Node : A box from which child boxes originate; a parent box. See Node Index, Node Tree, Node Number, Node Reference, Diagram Node Number." [IDEF0. Wikipedia]
The example "Design elements - IDEF0 diagram" is included in the IDEF0 Diagrams solution from the Software Development area of ConceptDraw Solution Park.
IDEF0 symbols
Entity Relationship Diagram - ERD - Software for Design Crows Foot ER Diagrams
_Win_Mac.png "Entity Relationship Diagram Software, Design Elements - Crows Foot (Windows, Macintosh)")

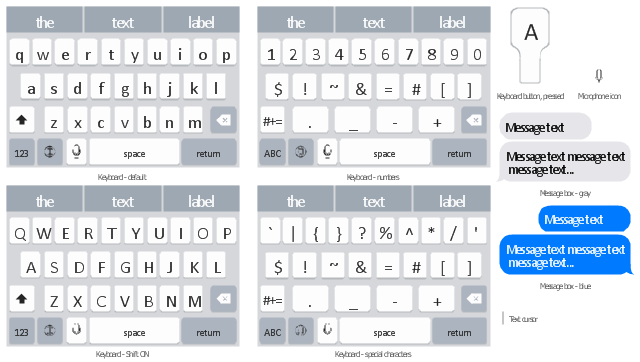
The vector stencils library "iMessage" contains 8 iMessage GUI elements: keyboards, buttons, microphone icon, message boxes.
Use the library "iMessage" to draw iMessage keyboard, message box and buttons for design of iPhone user interface sketches, mockups and prototypes.
The iOS GUI elements sample "Design elements - iMessage" was created using the ConceptDraw PRO diagramming and vector drawing software extended with the iPhone User Interface solution from the Software Development area of ConceptDraw Solution Park.
iOS GUI: iMessage
ERD Symbols and Meanings

Basic Flowchart Symbols and Meaning


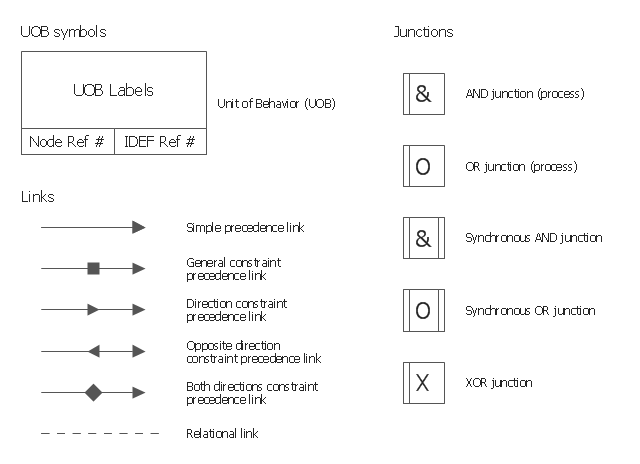
The vector stencils library "IDEF3 process schematic symbols" contains 12 shapes: unit of behavior (UOB), links, junctions, .
Use it to design your IDEF3 process schematic diagrams.
"Process schematics tend to be the most familiar and broadly used component of the IDEF3 method. These schematics provide a visualization mechanism for processcentered descriptions of a scenario. The graphical elements that comprise process schematics include Unit of Behavior (UOB) boxes, precedence links, junctions, referents, and notes. The building blocks here are:
- Unit of Behavior (UOB) boxes.
- Links: Links are the glue that connect UOB boxes to form representations of dynamic processes.
- Simple Precedence Links: Precedence links express temporal precedence relations between instances of one UOB and those of another.
- Activation Plots: Activation plots are used to represent activations.
- Dashed Links: Dashed links carry no predefined semantics.
- Link Numbers: All links have an elaboration and unique link numbers.
Activation Semantics for Nonbranching Process Schematics.
- Junctions: Junctions in IDEF3 provide a mechanism to specify the logic of process branching.
- UOB Decompositions: Elaborations capture and structure detailed knowledge about processes.
- UOB Reference Numbering Scheme: A UOB box number is assigned to each UOB box in an IDEF3 Process Description.
- Partial Descriptions: UOB boxes are joined together by links. Because of the description capture focus of IDEF3, it is possible to conceive of UOBs without links to other parts of an IDEF3 schematic.
- Referents: Referents enhance understanding, provide additional meaning, and simplify the construction (i.e., minimize clutter) of both process schematics and object schematics." [IDEF3. Wikipedia]
The shapes example "Design elements - IDEF3 process schematic symbols" was created using the ConceptDraw PRO diagramming and vector drawing software extended with the solution "IDEF Business Process Diagrams" from the area "Business Processes" of ConceptDraw Solution Park.
IDEF3 business process diagram
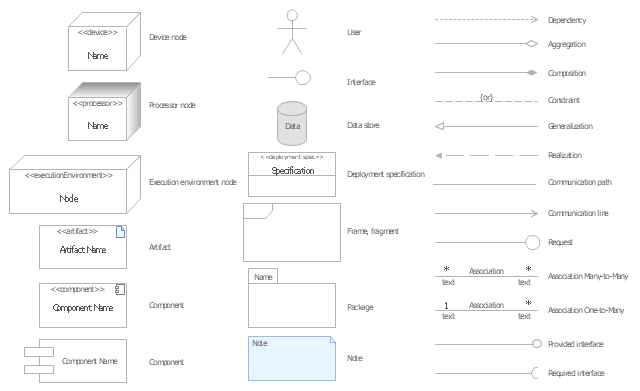
The vector stencils library "UML deployment diagrams" contains 31 symbols for the ConceptDraw PRO diagramming and vector drawing software.
"A deployment diagram in the Unified Modeling Language models the physical deployment of artifacts on nodes. ...
The nodes appear as boxes, and the artifacts allocated to each node appear as rectangles within the boxes. Nodes may have subnodes, which appear as nested boxes. A single node in a deployment diagram may conceptually represent multiple physical nodes, such as a cluster of database servers.
There are two types of Nodes.
(1) Device Node.
(2) Execution Environment Node." [Deployment diagram. Wikipedia]
The example "Design elements - UML deployment diagrams" is included in the Rapid UML solution from the Software Development area of ConceptDraw Solution Park.
UML deployment diagram symbols
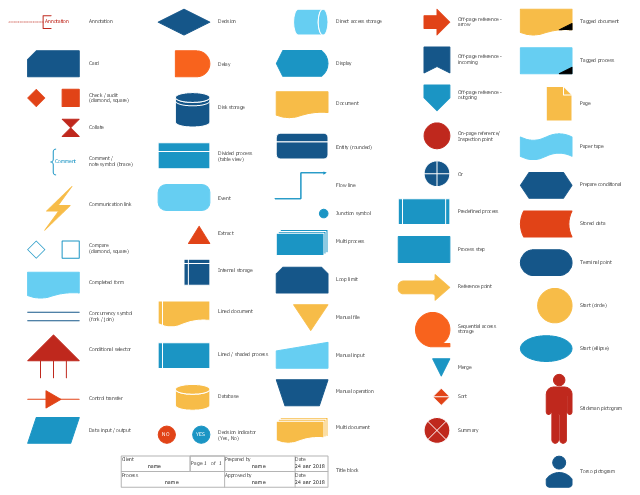
The vector stencils library "Flowchart" contains 26 symbols for drawing the flow charts using the ConceptDraw PRO diagramming and vector drawing software.
"Flowcharts are used in designing and documenting complex processes or programs. Like other types of diagrams, they help visualize what is going on and thereby help the viewer to understand a process, and perhaps also find flaws, bottlenecks, and other less-obvious features within it. There are many different types of flowcharts, and each type has its own repertoire of boxes and notational conventions. The two most common types of boxes in a flowchart are:
(1) a processing step, usually called activity, and denoted as a rectangular box;
(2) a decision, usually denoted as a diamond.
A flowchart is described as "cross-functional" when the page is divided into different swimlanes describing the control of different organizational units. A symbol appearing in a particular "lane" is within the control of that organizational unit. This technique allows the author to locate the responsibility for performing an action or making a decision correctly, showing the responsibility of each organizational unit for different parts of a single process. ...
Common alternate names include: flowchart, process flowchart, functional flowchart, process map, process chart, functional process chart, business process model, process model, process flow diagram, work flow diagram, business flow diagram. The terms "flowchart" and "flow chart" are used interchangeably." [Flowchart. Wikipedia]
The example "Design elements - Flowchart" is included in the Flowcharts solution from the area "What is a Diagram" of ConceptDraw Solution Park.
Flowchart notation

The vector stencils library "Bank UML deployment diagram" contains 10 shapes for drawing UML deployment diagrams.
Use it for object-oriented modeling of your bank information system.
"A deployment diagram in the Unified Modeling Language models the physical deployment of artifacts on nodes. To describe a web site, for example, a deployment diagram would show what hardware components ("nodes") exist (e.g., a web server, an application server, and a database server), what software components ("artifacts") run on each node (e.g., web application, database), and how the different pieces are connected (e.g. JDBC, REST, RMI).
The nodes appear as boxes, and the artifacts allocated to each node appear as rectangles within the boxes. Nodes may have subnodes, which appear as nested boxes. A single node in a deployment diagram may conceptually represent multiple physical nodes, such as a cluster of database servers.
There are two types of Nodes:
1. Device Node.
2. Execution Environment Node.
Device nodes are physical computing resources with processing memory and services to execute software, such as typical computers or mobile phones. An execution environment node (EEN) is a software computing resource that runs within an outer node and which itself provides a service to host and execute other executable software elements." [Deployment diagram. Wikipedia]
This example of UML deployment diagram symbols for the ConceptDraw PRO diagramming and vector drawing software is included in the ATM UML Diagrams solution from the Software Development area of ConceptDraw Solution Park.
UML deployment diagram symbols

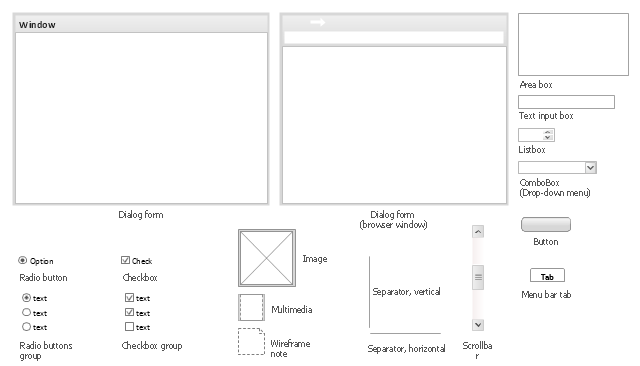
The vector stencils library "Wireframe" contains 18 elements for designing wireframe graphic user interface (GUI) of computer software.
"Wireframes may be utilized by ... designers ... to push the user interface (UI) process. ...
User interface design includes selecting and arranging interface elements to enable users to interact with the functionality of the system. The goal is to facilitate usability and efficiency as much as possible. Common elements found in interface design are action buttons, text fields, check boxes, radio buttons and drop-down menus." [Website wireframe. Wikipedia]
The example "Design elements - Wireframe" was created using the ConceptDraw PRO diagramming and vector drawing software extended with the Graphic User Interface solution from the Software Development area of ConceptDraw Solution Park.
Wireframe graphic user interface design elements
The vector stencils library "Sales flowchart" contains 62 flow chart symbols.
Use it to design your sales flowcharts, workflow diagrams and process charts by the ConceptDraw PRO diagramming and vector drawing software.
"Flowcharts are used in designing and documenting simple processes or programs. Like other types of diagrams, they help visualize what is going on and thereby help understand a process, and perhaps also find flaws, bottlenecks, and other less-obvious features within it. There are many different types of flowcharts, and each type has its own repertoire of boxes and notational conventions. The two most common types of boxes in a flowchart are:
(1) a processing step, usually called activity, and denoted as a rectangular box,
(2) a decision, usually denoted as a diamond." [Flowchart. Wikipedia]
The shapes example "Design elements - Sales flowchart" is included in the Sales Flowcharts solution from the Marketing area of ConceptDraw Solution Park.
Flowchart symbols
Software and Database Design with ConceptDraw PRO

- Title Box Vector Png
- Text Box Design Png
- Png Text Box Design
- Box Png Images
- Design For Title Png
- Text Box Png
- Design elements - Android system icons (toggle) | Exporting ...
- IDEF0 diagram - Inter- box connections | VoIP call with SIM box and ...
- Design elements - iMessage | App icons - Vector stencils library ...
- Controls - Vector stencils library | Interior Design Office Layout Plan ...
- Png Icon For Fire Extinguisher First Aid Kit Box Emergency Telephone
- Design elements - Advertising, post and mail | Mail and post - Vector ...
- Design elements - iMessage | App icons - Vector stencils library ...
- Design elements - Management title blocks | Design elements ...
- Music - Vector stencils library | Design elements - Music | Png Clip ...
- Logistic Truck Vector Png
- Paper Bag Png
- Red Vector Title Bar Element Png
- Ribbon Design Png
- Flowchart design . Flowchart symbols, shapes, stencils and icons ...