Entity Relationship Diagram Symbols
The semantic modeling method nowadays is successfully applied in database structure design. It is effective method of modeling the data structures, which is based on the meaning of these data. As a tool of semantic modeling, there are used different types of Entity-Relationship Diagrams. Entity Relationship Diagram (ERD) is applied to visually and clearly represent a structure of a business database. The main components of ERDs are: entity, relation and attributes. An entity is a class of similar objects in the model, each entity is depicted in the form of rectangle and has the name expressed by a noun. Relation is shown in the form of non-directional line that connects two entities. There are several notation styles used for ERDs: information engineering style, Chen style, Bachman style, Martin Style. The Entity Relationship Diagram symbols used for professional ERD drawing are predesigned by professionals and collected in the libraries of the Entity-Relationship Diagram (ERD) solution for ConceptDraw DIAGRAM software.
 Business Diagrams
The Business Diagrams Solution extends ConceptDraw DIAGRAM with an extensive collection of professionally designed illustrative samples and a wide variety of vector stencils libraries, which are the real help for all business-related people, business analysts, business managers, business advisers, marketing experts, PR managers, knowledge workers, scientists, and other stakeholders allowing them to design the bright, neat, expressive and attractive Bubble Diagrams, Circle-Spoke Diagrams, Circular Arrows Diagrams, and Venn Diagrams with different quantity of sets in just minutes; and then successfully use them in documents, reports, statistical summaries, and presentations of any style.
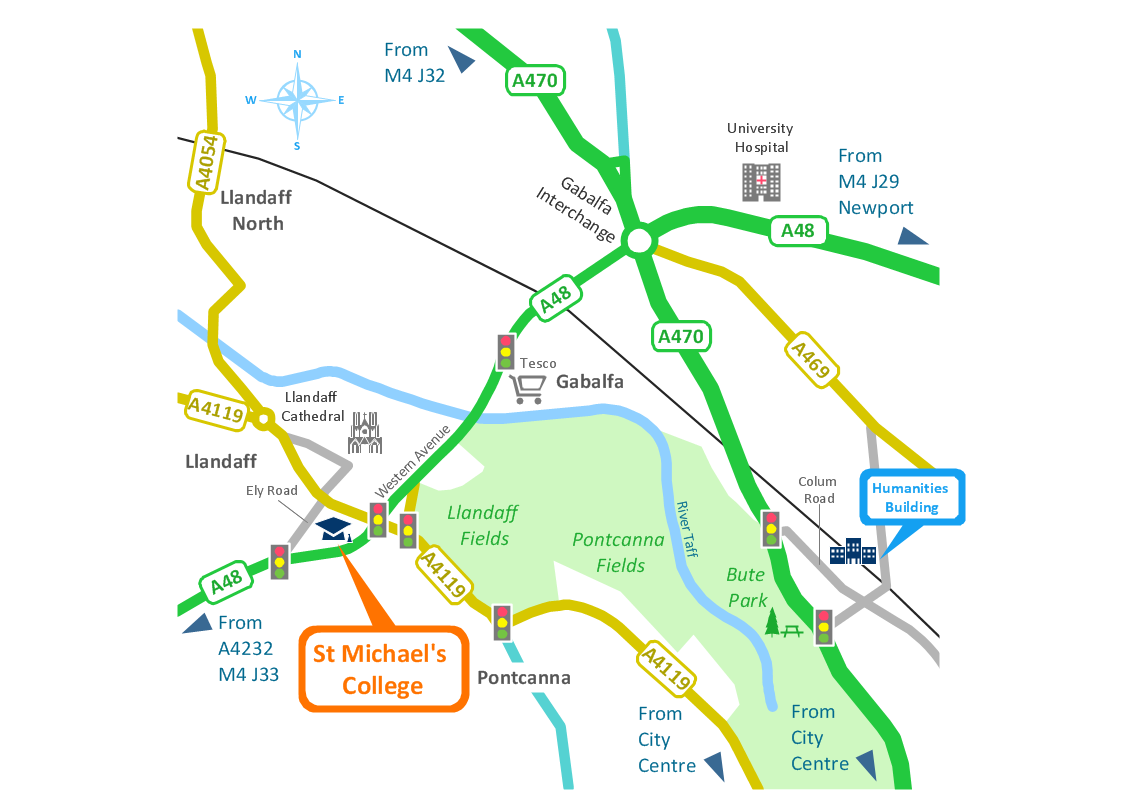
Brilliant Examples of Infographics Map, Transport, Road
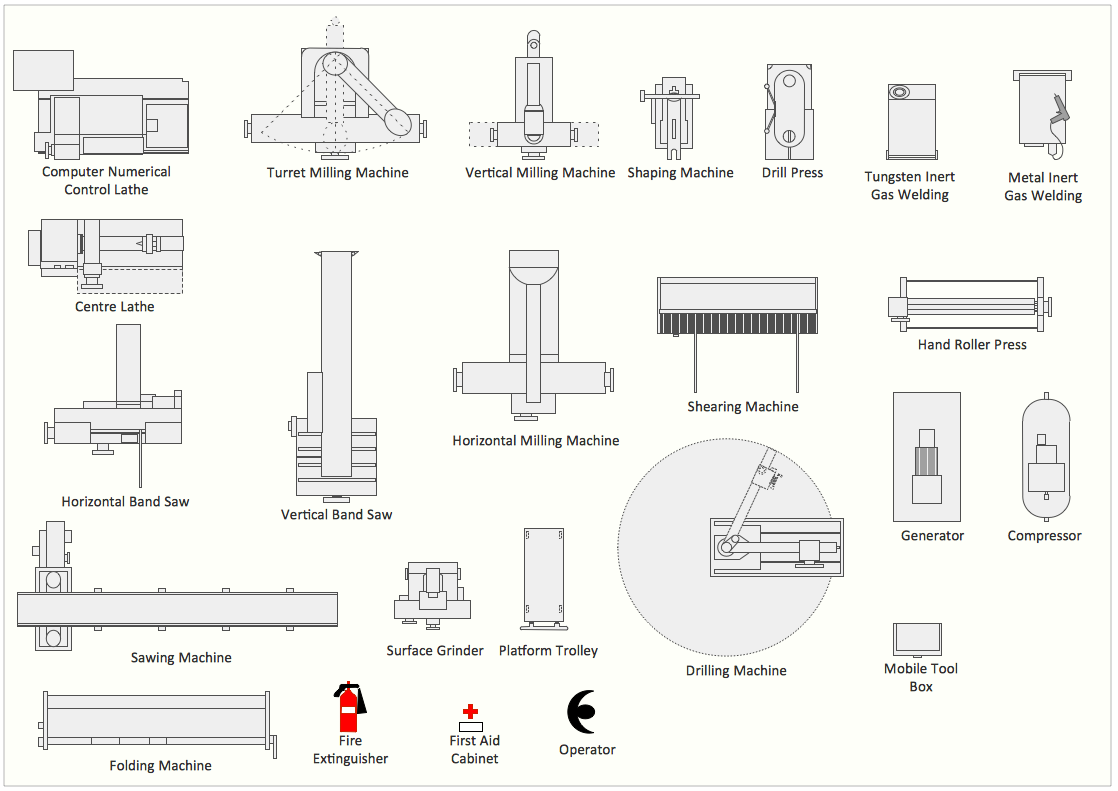
ConceptDraw DIAGRAM contains spatial infographics samples, map templates to be filled in, and libraries of vector stencils for main design elements of spatial infographics.Interior Design. Machines and Equipment — Design Elements
The Interior Design for the plant or any other industrial or manufacturing premise is equally important than for the home, office, etc. Its main goal is to be convenient and comfortable, providing favorable atmosphere for effective and productive work of workers. Good plant plan should illustrate the common plan of the premise and depict in details the distribution of special equipment and industrial machines within plant's premises. ConceptDraw DIAGRAM diagramming and vector drawing software extended with exclusive Plant Layout Plans solution from Building Plans area of ConceptDraw Solution Park is a powerful plant design software, which offers extensive libraries with vector design elements of machines and equipment, also storage, distribution, shipping and receiving facilities. They make easy development of Plant Layouts for production, receiving, storage, distribution, transport, and shipping of manufactured goods, Manufacturing equipment layouts, Plant layout plans, Plant interior design plans, Warehouse and Workshop floor plan layouts, etc.ConceptDraw MINDMAP : Brainstorming, Mind Mapping for macOS and Windows
ConceptDraw MINDMAP is a powerful business and personal productivity software application that provides visual organization and access to information for individuals and organizations.Data Flow Diagram Model
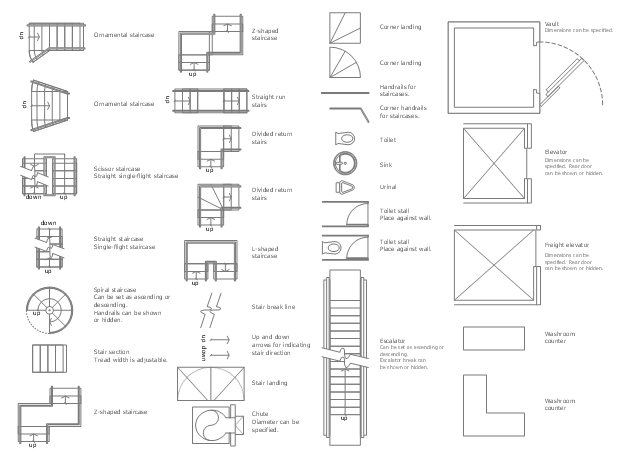
Data Flow Diagram (DFD) is a technique of graphical structural analysis, describing the sources external to the system, recipients of data, also logical functions, data flows and data stores that are accessed. The DFD's goal is to show how each process converts its inputs into the outputs and to identify relationships between these processes, at this make the system's description clear and understandable at every level of detail. Historically happened that for describing Data Flow Diagrams are used two notations - Yourdon and Gane-Sarson that differ each from other by graphical representation of symbols. The DFD model, like most other structural models is a hierarchical model. Each process can be subjected to decomposition on the structural components, the relationships between which in the same notation can be shown on a separate diagram. Typically, several DFD models are built when modeling the system. ConceptDraw DIAGRAM software enhanced with Data Flow Diagrams solution ideally suits for creation DFD models and professional drawing Data Flow Diagrams.The design elements library Building core contains 80 symbols of stairs, elevators, escalators, restroom fixtures, and a safe.
Use the shapes library Building core to draw the structural diagrams, bathroom layouts, building automation, architectural drawings, and riser diagrams, as well as space plans, store and shopping mall plans, and facility planning, plant layouts using the ConceptDraw PRO diagramming and vector drawing software.
"In architecture and building engineering, a floor plan otherwise known as a Scottish plan is a drawing to scale, showing a view from above, of the relationships between rooms, spaces and other physical features at one level of a structure.
The term may be used in general to describe any drawing showing the physical layout of objects.
A floor plan could show:
Interior walls and hallways;
Restrooms;
Windows and doors;
Appliances such as stoves, refrigerators, water heater etc.;
Interior features such as fireplaces, saunas and whirlpools;
The use of all rooms shall be indicated." [Floor plan. Wikipedia]
The vector stencils library Building core is provided by the Floor Plans solution from the Building Plans area of ConceptDraw Solution Park.
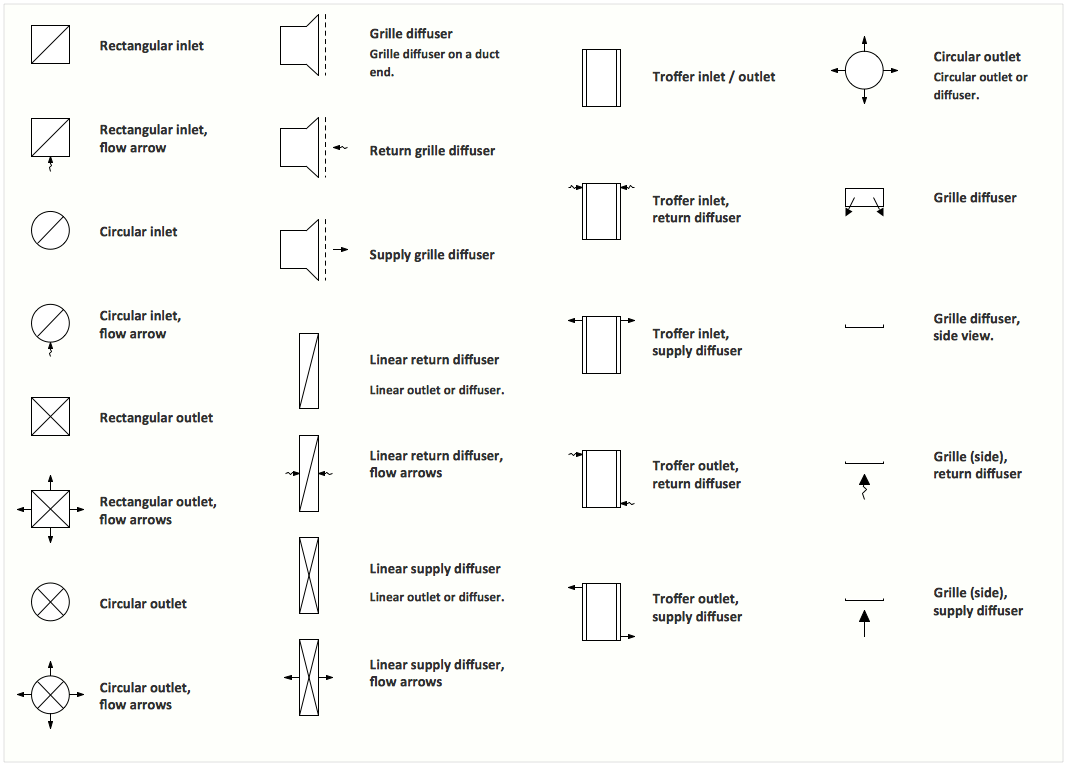
Interior Design. Registers, Drills and Diffusers — Design Elements
The interior design project for any home, flat, business center includes the set of different plans and documents, among them obligatory are the ceiling plans. For creation these plans will be convenient to use professional drawing software. It is especially useful in cases when you need create and propose for customer the multiple alternative design plans for choice. ConceptDraw DIAGRAM diagramming and vector drawing software extended with Reflected Ceiling Plan solution is the choice of architects, designers, electricians, and other building-related people. It is ideal for displaying the ceiling design ideas which meet any requirements of building and budget. Included templates, samples and especially wide selection of vector design elements, including the elements offered by Registers, Drills and Diffusers library are helpful in drawing without efforts professional-looking Reflected Ceiling plans, Reflective Ceiling plans, Lighting Plans, Electrical Plans, Plans of location the outlets, grilles, diffusers, registers, light fixtures, light panels, etc.Data Flow Diagram Process
Data Flow Diagram (DFD) is a hierarchy of functional processes, connected by data flows. The purpose of this presentation is to show how each process converts its inputs into outputs and to identify relationships between these processes. DFD is convenient way of modeling and construction the information processes, it step-by-step illustrates the flow of information in a process. For construction a DFD traditionally are used two different notations, which appropriate to the methods of Yourdon-Coad and Gane-Sarson. These notations slightly different from each other by graphical representation of symbols for processes, data stores, data flow, external entities. When designing a DFD it is required to decompose the system into the components (sub-systems), for explaining a complex system you may need represent numerous levels. The Data Flow Diagrams solution from ConceptDraw Solution Park contains numerous predesigned DFD symbols for both notations, which help easy and effectively design professional-looking Data Flow Diagrams (DFDs) and DFD Process Diagrams.Form Maker
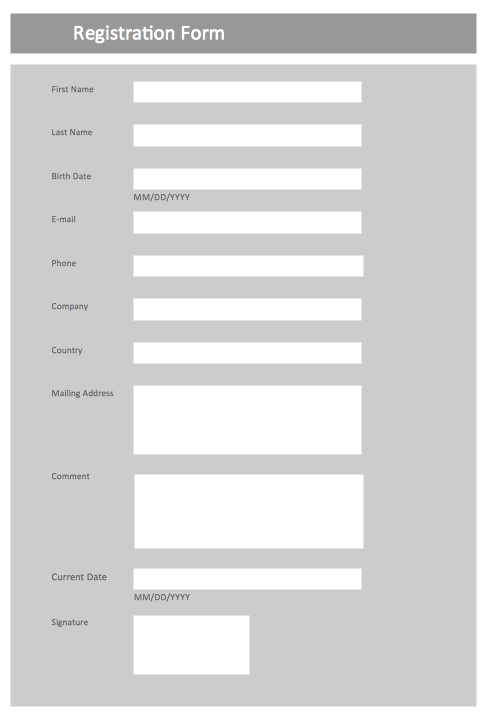
Use the Basic Diagramming Solution from the Universal Diagramming area of ConceptDraw Solution Park to easy create simple forms, questionnaires, survey forms, registration and application forms, etc.HelpDesk
How to Create a Hook-Up Diagram
Hook-up diagram of the audio-video system is a detailed drawing showing the audio video connections in a correct manner so that the system operates properly. Using the hook-up diagram you can understand how the elements of your audio-video system should be installed. ConceptDraw DIAGRAM allows you to draw the Hook Up diagram of Audio-Video system easily using the set of special libraries provided by Audio and Video Connectors solution.Data Flow Diagram (DFD)
A Data Flow Diagram (DFD) illustrates the flow of data through an information system, visualizes how the information is handled in terms of inputs and outputs, how the data enter to system and leave it. It is effective to use a Data Flow Diagram for creation the system's overview, to show the system's scope and boundaries. There are two different types of notations for DFDs: Yourdon-Coad and Gane-Sarson, which differ in visual representations for processes, data flow, data stores, external entities, etc. Thus, for example the processes are depicted as circles in Yourdon-Coad notation and as rounded squares in Gane-Sarson notation. Gane-Sarson notation is usually used for visualization information systems and Yourdon-Coad - for system analysis and design. The Data Flow Diagrams solution included to Software Development area of ConceptDraw Solution Park offers a lot of DFD templates, samples and examples, libraries of vector stencils for construction without efforts the DFDs according to both Gane-Sarson and Yourdon-Coad notations."A commercial building is a building that is used for commercial use. Types can include office buildings, warehouses, or retail (i.e. convenience stores, 'big box' stores, shopping malls, etc.). In urban locations, a commercial building often combines functions, such as an office on levels 2-10, with retail on floor 1. Local authorities commonly maintain strict regulations on commercial zoning, and have the authority to designate any zoned area as such. A business must be located in a commercial area or area zoned at least partially for commerce." [Commercial building. Wikipedia]
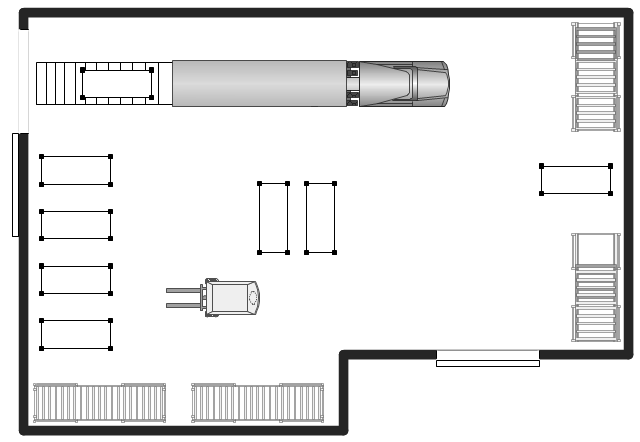
The warehouse floor plan example "Shipping, receiving and storage" was created using the ConceptDraw PRO diagramming and vector drawing software extended with the Plant Layout Plans solution from the Building Plans area of ConceptDraw Solution Park.
The warehouse floor plan example "Shipping, receiving and storage" was created using the ConceptDraw PRO diagramming and vector drawing software extended with the Plant Layout Plans solution from the Building Plans area of ConceptDraw Solution Park.
 SWOT and TOWS Matrix Diagrams
SWOT and TOWS Matrix Diagrams solution extends ConceptDraw DIAGRAM and ConceptDraw MINDMAP software with features, templates, samples and libraries of vector stencils for drawing SWOT and TOWS analysis matrices and mind maps.
Sales Process Flowchart Symbols
The most easier way of creating the visually engaging and informative Sales Process Flowchart is to create the new ConceptDraw document and to use the predesigned vector symbols offered in 6 libraries of the Sales Flowchart Solution. There are more than six types of sales process flow diagrams, ConceptDraw DIAGRAM software is flowchart maker which include six collections of extended flowchart symbols for effective diagramming. There are main collections of color coded flowchart symbols: Sales Department, Sales Steps, Sales Workflow, Sales Symbols and special set of Sales Arrows and Sales Flowchart.This vector stencils library contains 195 cloud computing icons.
Use it to design cloud computing infographic and diagrams with ConceptDraw PRO software.
"Cloud computing, also on-demand computing, is a kind of Internet-based computing that provides shared processing resources and data to computers and other devices on demand. It is a model for enabling ubiquitous, on-demand access to a shared pool of configurable computing resources (e.g., networks, servers, storage, applications and services), which can be rapidly provisioned and released with minimal management effort. Cloud computing and storage solutions provide users and enterprises with various capabilities to store and process their data in third-party data centers.
Cloud computing has become a highly demanded service or utility due to the advantages of high computing power, cheap cost of services, high performance, scalability, accessibility as well as availability." [Cloud computing. Wikipedia]
The vector stencils library "Cloud clipart" is included in the Cloud Computing Diagrams solution from the Computer and Networks area of ConceptDraw Solution Park.
ConceptDraw Arrows10 Technology
How should diagramming software work? Is it possible to develop a diagram as quickly as the ideas come to you? The innovative ConceptDraw Smart Connectors Technology - This is more than enough versatility to draw any type of diagram with any degree of complexity. Connection points are necessary for diagramming network, flowchart and organizational charts. In ConceptDraw you connect shapes by attaching, or snapping and gluing, connectors to shape connection points.How to Draw EPC Diagram Quickly
An event-driven process chain diagram is a flowchart used in business process analysis. It evolved from Architecture of Integrated Information Systems (ARIS) and utilised in the business process improvement and analysis. It is also used to facilitate enterprise resource planning. An EPC diagram is a complex flowchart that shows different business processes through various workflows. The workflows are seen as functions and events that are connected by different teams or people, as well as tasks that allow business processes to be executed. ConceptDraw DIAGRAM is a software for making EPC diagrams that allows managers visually present business process models for making decisions for business.
 Gym and Spa Area Plans
Gym and Spa Area Plans solution extends abilities of the architects, designers, engineers, builders, marketing experts, gym instructors, fitness trainers, health and beauty services specialists. It is a real finding for all them due to the unique functionally thought-out drawing tools, samples and examples, template and libraries of pre-made vector design elements offered to help create the Gym and Spa area plans, Fitness plans, Gym workout plan, Gym layout plan, Spa design plans, Gym floor plan and Spa floor plan with any degree of detailing.
The vector stencils library "Sales symbols" contains 55 sales pictograms.
Use these icon set to draw your sales flowcharts, workflow diagrams and process charts with the ConceptDraw PRO diagramming and vector drawing software.
The vector stencils library "Sales symbols" is included in the Sales Flowcharts solution from the Marketing area of ConceptDraw Solution Park.
Use these icon set to draw your sales flowcharts, workflow diagrams and process charts with the ConceptDraw PRO diagramming and vector drawing software.
The vector stencils library "Sales symbols" is included in the Sales Flowcharts solution from the Marketing area of ConceptDraw Solution Park.
- What Are The Flow Chart And Booble Diagram Of Shopping Mall
- Bubble Diagram For Shoping Center
- Example Of A Shopping Mall Bubble Diagram
- Wiring Diagram For A Shopping Mall
- Office Layout Plans | Bubble Diagram For A Mall Pdf
- Draw A Flowchart On Shopping On Shopping Mall
- Make An Er Diagram On Shopping Mall
- Building Plans | Bubble diagrams in Landscape Design with ...
- Business diagrams & Org Charts with ConceptDraw DIAGRAM ...
- Data Flow Diagrams (DFD) | Flowchart For Online Shopping Mall ...
- Sample Layout Plan Of A Shopping Mall
- Bubble diagrams in Landscape Design with ConceptDraw DIAGRAM
- Bubble diagrams in Landscape Design with ConceptDraw ...
- Shopping Mall Organizational Structure
- Pdf Shopping Mall Floor Plan With Dimensions
- Shopping Mall Example Floor Plan
- Commercial Chart Diagram
- How To Draw Building Plans | Food Court | Playground Layouts ...
- Plant Layout Plans | How to Create a Plant Layout Design | Bubble ...
- Shipping, receiving and storage | Network Diagram Software ...








-cloud-clipart---vector-stencils-library.png--diagram-flowchart-example.png)
-cloud-clipart---vector-stencils-library.png--diagram-flowchart-example.png)


-cloud-clipart---vector-stencils-library.png--diagram-flowchart-example.png)


-cloud-clipart---vector-stencils-library.png--diagram-flowchart-example.png)
-cloud-clipart---vector-stencils-library.png--diagram-flowchart-example.png)


