Business Process Modeling Notation
ConceptDraw PRO is a software for simplу depicting the business processes based on BPMN 2.0. Business Process Diagrams Cross-Functional-Flowcharts, Workflows, Process Charts, IDEF0 and IDEF2, Timeline, Calendars, Gantt Charts, Business Process Modeling, Audit and Opportunity Flowcharts and Mind Maps (presentations, meeting agendas).Basic Flowchart Symbols and Meaning
Flowcharts are the best for visually representation the business processes and the flow of a custom-order process through various departments within an organization. ConceptDraw PRO diagramming and vector drawing software extended with Flowcharts solution offers the full set of predesigned basic flowchart symbols which are gathered at two libraries: Flowchart and Flowcharts Rapid Draw. Among them are: process, terminator, decision, data, document, display, manual loop, and many other specific symbols. The meaning for each symbol offered by ConceptDraw gives the presentation about their proposed use in professional Flowcharts for business and technical processes, software algorithms, well-developed structures of web sites, Workflow diagrams, Process flow diagram and correlation in developing on-line instructional projects or business process system. Use of ready flow chart symbols in diagrams is incredibly useful - you need simply drag desired from the libraries to your document and arrange them in required order. There are a few serious alternatives to Visio for Mac, one of them is ConceptDraw PRO. It is one of the main contender with the most similar features and capabilities.
Fishbone Diagram Template
A causal model is an abstract concept, that describes the causal mechanisms of a system, by noting certain variables and their influence on each other, in an effort to discover the cause of a certain problem or flaw. This model is presented in diagram form by using a fishbone diagram. ConceptDraw PRO diagramming and vector drawing software enhanced with Fishbone Diagrams solution helps you create business productivity diagrams from Fishbone diagram templates and examples, that provide to start using of the graphic method for the analysis of problem causes. Each predesigned Fishbone Diagram template is ready to use and useful for instantly drawing your own Fishbone Diagram.How to Report Task's Execution with Gantt Chart
ConceptDraw PROJECT’s powerful reporting engine lets you generate a set of tabular reports with just one click, or visualize your project as Radial Tasks Structures, Work Breakdown Structures and Resource Calendars. It also provides you with dynamic Project Dashboards.
 Audio, Video, Media
Use it to make professional-looking documents, impressive presentations, and efficient websites with colorful and vivid illustrations and schematics of digital audio, video and photo gadgets and devices, audio video connections and configurations, S Video connection, HD and 3D television systems, home entertainment systems, Closed-circuit television (CCTV) surveillance systems. All audio video schematics, drawings and illustrations designed in ConceptDraw PRO are professional looking, clear and understandable for all thanks to applying the most commonly used standards of designations, and are effective for demonstrating in front of a small audience and on the big screens.
UML Diagram
The accepted open standard that is used in software engineering and system design, when modeling object-oriented systems and business processes is known as Unified Modeling Language (UML). UML was created for definition, visualization, design and documentation software systems. It isn't a programming language, but on the base of UML model can be generated code. UML uses generic set of graphic notations for creation an abstract model of the system called UML-model. The UML notation lets visually represent requirements, subsystems, structural and behavioral patterns, logical and physical elements, etc. UML defines 13 types of diagrams: Class (Package), Use Case, Sequence, Object, Collaboration, Component, Timing, Interaction Overview, State Machine, Composite Structure, Activity, and Deployment. All these types of UML Diagrams can be fast and easy created with powerful ConceptDraw PRO software extended with special Rapid UML solution from Software Development area of ConceptDraw Solution Park.Value Stream Maps Visualize
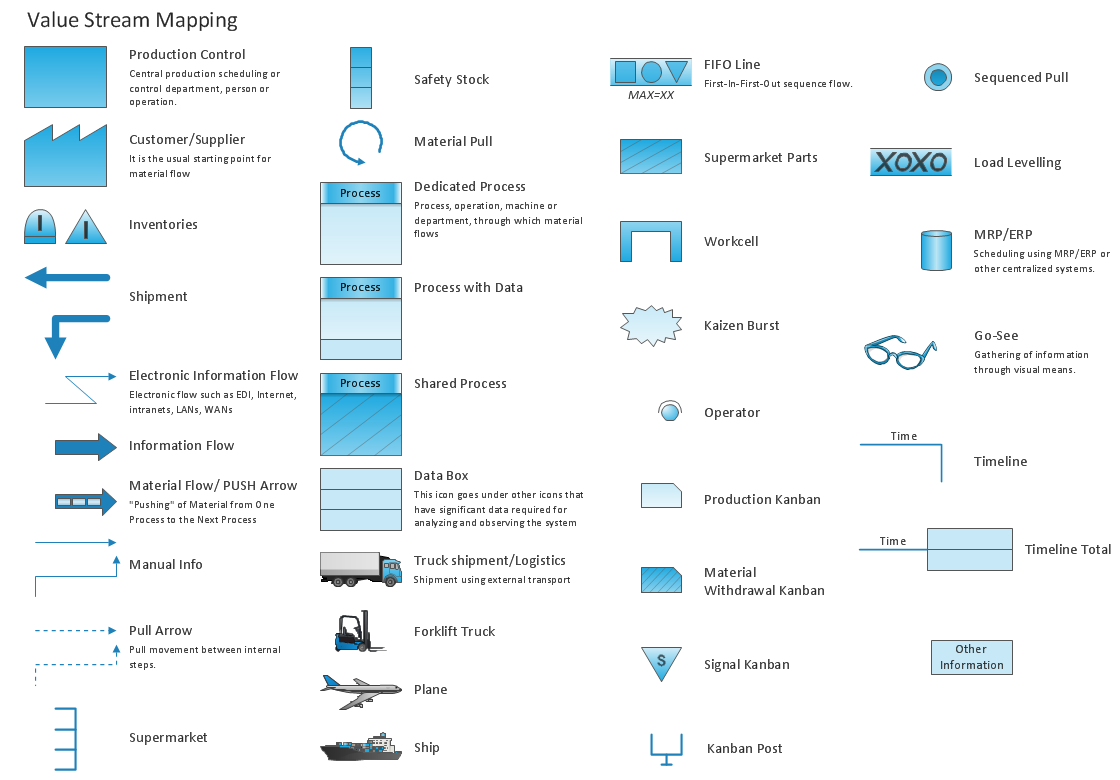
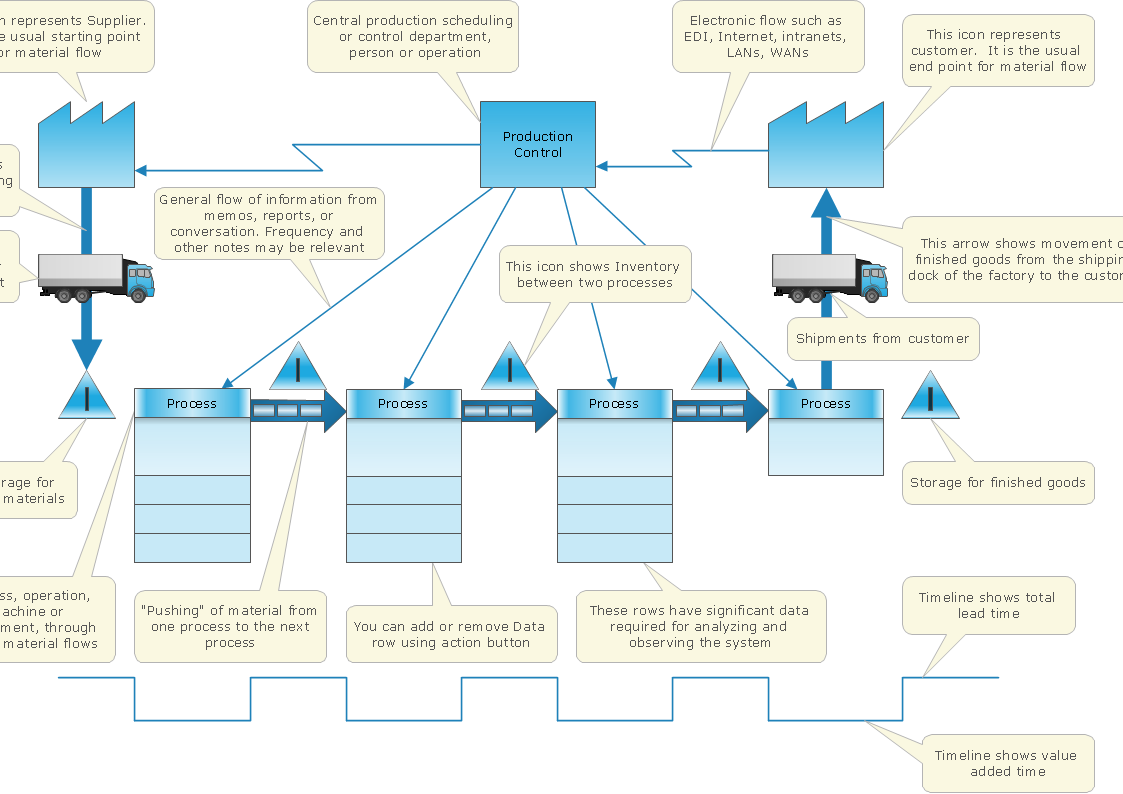
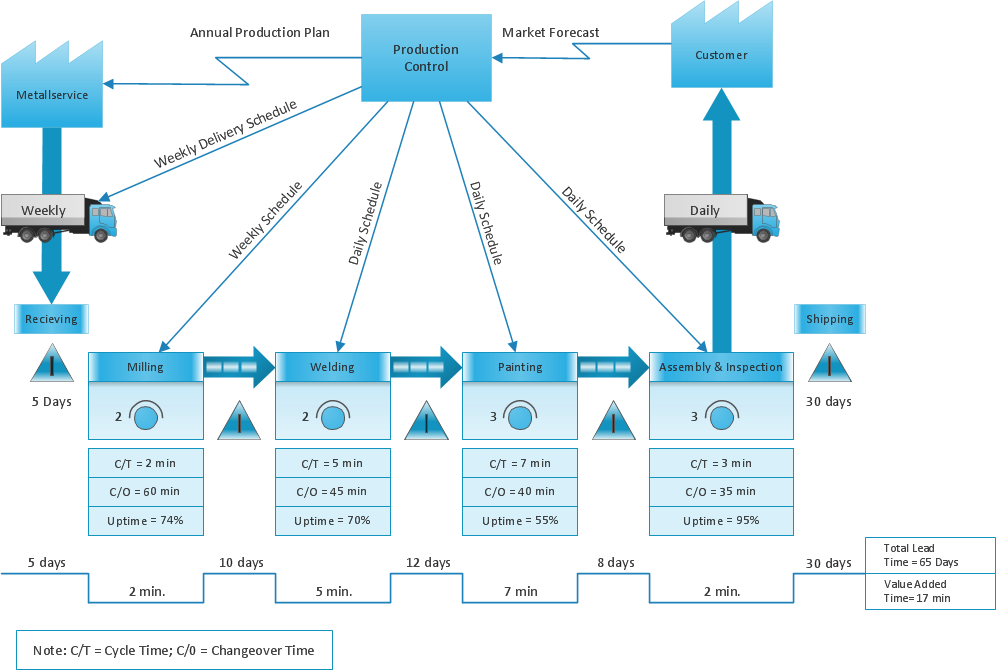
ConceptDraw Value Stream Maps visualize for a manufacturing plant the material and information flow.How To create Value Stream Map (VSM)
Value Stream Map template helps you to create VSM diagrams using ConceptDraw PRO software.Learn how to create a current state value stream map
Value Stream Mapping solution extends ConceptDraw PRO software with templates, samples and vector shapes for drawing the current state value stream maps.
 Plumbing and Piping Plans
Plumbing and Piping Plans solution extends ConceptDraw PRO v10.2.2 software with samples, templates and libraries of pipes, plumbing, and valves design elements for developing of water and plumbing systems, and for drawing Plumbing plan, Piping plan, PVC Pipe plan, PVC Pipe furniture plan, Plumbing layout plan, Plumbing floor plan, Half pipe plans, Pipe bender plans.
Create a Value Stream Map
Use ConceptDraw PRO software extended with Value Stream Mapping solution to create your own VSM diagrams.
 Office Layout Plans
Office layouts and office plans are a special category of building plans and are often an obligatory requirement for precise and correct construction, design and exploitation office premises and business buildings. Designers and architects strive to make office plans and office floor plans simple and accurate, but at the same time unique, elegant, creative, and even extraordinary to easily increase the effectiveness of the work while attracting a large number of clients.
How to Create Gantt Chart
To begin managing a new project, you will need to define the individual Tasks that must be completed to deliver it. The default view for a new project in ConceptDraw PROJECT is the Gantt Chart.
 ConceptDraw Solution Park
ConceptDraw Solution Park collects graphic extensions, examples and learning materials
- Types of Flowchart - Overview | Flowchart - HR management ...
- Line Graphs | Bar Graphs | Line Graph Charting Software | Graph
- Process Flowchart | Active Directory Diagram | Network Diagram ...
- UML activity diagram - Cash withdrawal from ATM | Event-driven ...
- Truck vehicle clipart | Road Transport - Design Elements | Food ...


