HelpDesk
How to Create a House of Quality Diagram
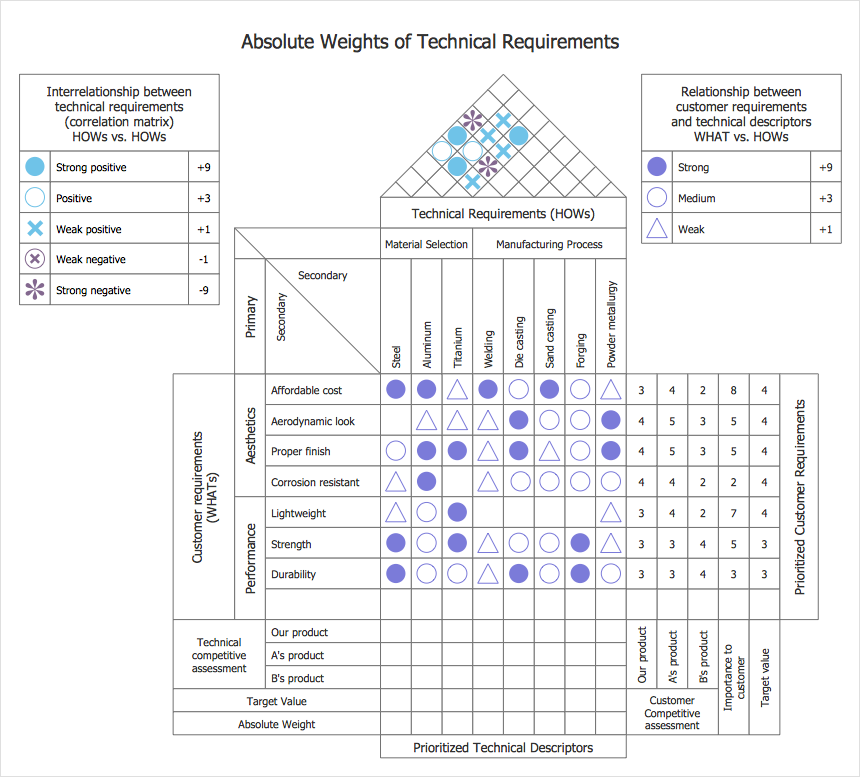
The House of Quality diagram is a part of quality function deployment method (QFD) designed by Japanese planning specialists to help turn customer requirements (voice of the customer) into technical features of a final product. The House of Quality solution for ConceptDraw DIAGRAM is a tool for designing HOQ diagrams. There are 2 libraries containing 54 vector stencils you can use to create House of Quality diagrams of any type.Organizational Structure Total Quality Management
The Total Quality Management Diagram solution helps you and your organization visualize business and industrial processes. Create Total Quality Management diagrams for business process with ConceptDraw software.Pyramid Diagram
The Time-Money-Quality Triangle illustrates an advertising truism, that you can't have all three.Total Quality Management Business Diagram
The Total Quality Management Diagram solution helps you and your organization visualize business and industrial processes. Create Total Quality Management diagrams for business process with ConceptDraw software.TQM Diagram Tool
The Total Quality Management Diagram solution helps you and your organization visualize business and industrial processes. Create Total Quality Management diagrams for business process with ConceptDraw software.Management Tools — Total Quality Management
The Total Quality Management Diagram solution helps your organization visualize business and industrial processes. Create Total Quality Management diagrams for business process with ConceptDraw software.
 Total Quality Management TQM Diagrams
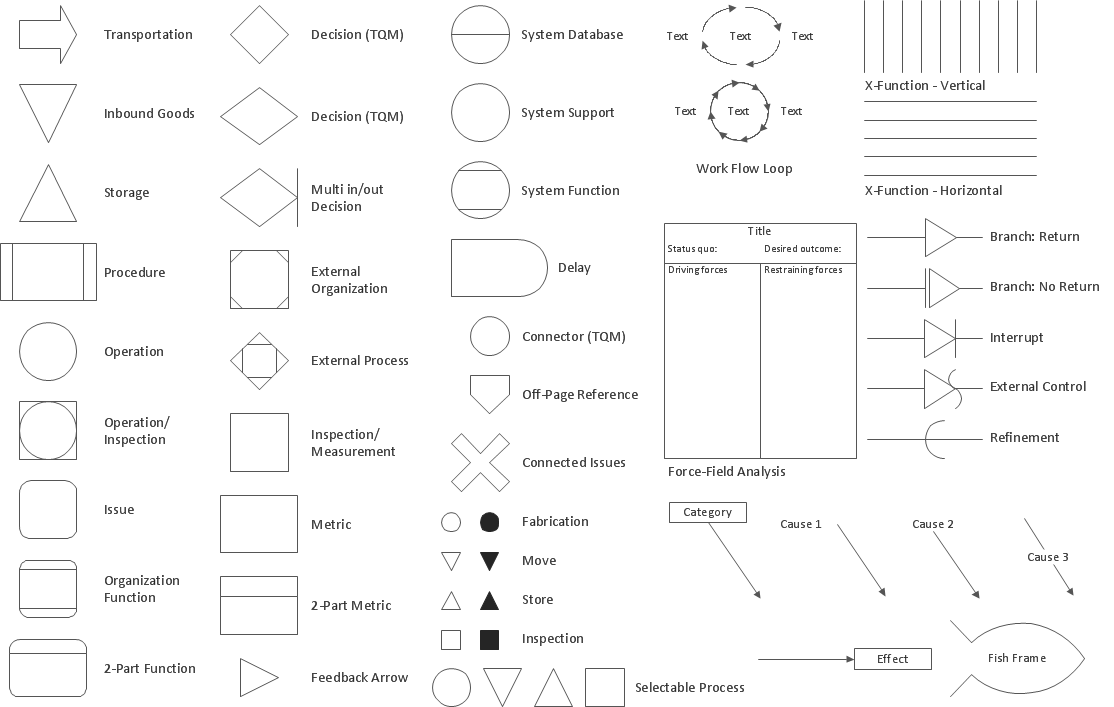
Total Quality Management Diagrams solution extends ConceptDraw DIAGRAM software with samples, templates and vector stencils library for drawing the TQM flowcharts.
TQM Diagram — Professional Total Quality Management
The Total Quality Management Diagram solution helps you and your organization visualize business and industrial processes. Create Total Quality Management diagrams for business process with ConceptDraw software.Definition TQM Diagram
The Total Quality Management Diagram solution helps your organization visualize business and industrial processes. Create Total Quality Management diagrams for business process with ConceptDraw software.
 Seven Basic Tools of Quality
Manage quality control in the workplace, using fishbone diagrams, flowcharts, Pareto charts and histograms, provided by the Seven Basic Tools of Quality solution.
TQM Diagram Example
The Total Quality Management Diagram solution helps you and your organization visualize business and industrial processes. Create Total Quality Management diagrams for business process with ConceptDraw software.Probability Quality Control Tools
The Total Quality Management Diagram solution helps your organization visualize business and industrial processes. Create Total Quality Management diagrams for business process with ConceptDraw software.Seven Basic Tools of Quality - Fishbone Diagram
ConceptDraw DIAGRAM enhanced with Seven Basic Tools of Quality solution from the Quality area of ConceptDraw Solution Park is an ideal software for fast and easy drawing professional looking quality diagrams, including a Fishbone diagram.Create TQM Flowcharts for Mac
The Total Quality Management Diagram solution helps your organization visualize business and industrial processes. Create Total Quality Management diagrams for business process with ConceptDraw software.The Fifty Two Elements of TQM
The Total Quality Management Diagram solution helps your organization visualize business and industrial processes. Create Total Quality Management diagrams for business process with ConceptDraw software.Best Value — Total Quality Management
The Total Quality Management Diagram solution helps your organization visualize business and industrial processes. Create Total Quality Management diagrams for business process with ConceptDraw software.TQM Software — Build Professional TQM Diagrams
The Total Quality Management Diagram solution helps you and your organization visualize business and industrial processes. Create Total Quality Management diagrams for business process with ConceptDraw software.Total Quality Management Value
The Total quality management (TQM) is an enterprise-wide method of continuous quality improvement of all organizational processes, including the enhancement of ability to deliver high-quality products and services to the customers. The TQM includes eight main elements, which have great value: customer-focused, process-centered, total employee involvement, integrated system, continual improvement, strategic and systematic approach, fact-based decision making, communications. ConceptDraw DIAGRAM diagramming and vector drawing software offers the Total Quality Management Diagram solution with effective drawing tools, predesigned vector elements, samples and templates that help easy design the Total Quality Management diagrams, TQM flowcharts and Mind Maps widely used in quality management projects to visualize the business processes and industrial processes for your organization, to demonstrate the quality control step-by-step in a visual manner, to compare visually the ideal and real stages of processes.
 House of Quality
House of Quality solution provides the powerful drawing tools, numerous specific samples and examples, and set of vector design elements of House of Quality shapes and symbols, which will help you in application the Quality function deployment (QFD) methodology and in easy creation the House of Quality Matrices intended for satisfaction the consumers' desires and requirements, for representing them in a visual way and then transformation into the targets and technical requirements to be followed for development the best products.
Quality Engineering Diagrams
Create Quality Engineering Diagrams (value stream maps) - for value stream analysis and value stream management, material and information flow mapping, using our quick start templates included with ConceptDraw.- Fishbone diagram - Causes of low- quality output | Fishbone ...
- Fishbone Diagrams | Fishbone diagram - Causes of low- quality ...
- Quality Management System | Process Flowchart | Identifying Quality ...
- Block Diagram Of Quality Control
- Process Flowchart | TQM Diagram Example | Definition TQM ...
- Total Quality Management Value | Fishbone Diagram | 4ms Of ...
- Fishbone Diagrams | Total Quality Management with ConceptDraw ...
- Definition TQM Diagram | TQM Diagram Example | TQM diagram ...
- Management Tools — Total Quality Management | Identifying ...
- How to Create a House of Quality Diagram | House of Quality ...
- What Is The 4ms Of Total Quality Management
- How to Create a House of Quality Diagram | House of quality 9 step ...
- Quality Control | Value-Stream Mapping for Manufacturing | TQM ...
- Quality Diagram Symbols And Meanings Pdf
- Total Quality Management Value | Manufacturing 8 Ms fishbone ...
- Fishbone Diagrams | Fish Bone Diagram In Quality Management
- TQM Diagram Tool | Picture Graphs | Seven Basic Tools of Quality ...
- Process Flowchart | Quality Control Chart Software — ISO ...
- Fishbone diagram - Causes of low- quality output | Total Quality ...


