TQM Software — Build Professional TQM Diagrams
The Total Quality Management Diagram solution helps you and your organization visualize business and industrial processes. Create Total Quality Management diagrams for business process with ConceptDraw software.Total Quality Management Value
The Total quality management (TQM) is an enterprise-wide method of continuous quality improvement of all organizational processes, including the enhancement of ability to deliver high-quality products and services to the customers. The TQM includes eight main elements, which have great value: customer-focused, process-centered, total employee involvement, integrated system, continual improvement, strategic and systematic approach, fact-based decision making, communications. ConceptDraw DIAGRAM diagramming and vector drawing software offers the Total Quality Management Diagram solution with effective drawing tools, predesigned vector elements, samples and templates that help easy design the Total Quality Management diagrams, TQM flowcharts and Mind Maps widely used in quality management projects to visualize the business processes and industrial processes for your organization, to demonstrate the quality control step-by-step in a visual manner, to compare visually the ideal and real stages of processes.
 Quality Management Area
The solutions from Quality Management Area extend ConceptDraw DIAGRAM software with samples, templates and vector stencils libraries for drawing quality management diagrams and mind maps.
Total Quality Management
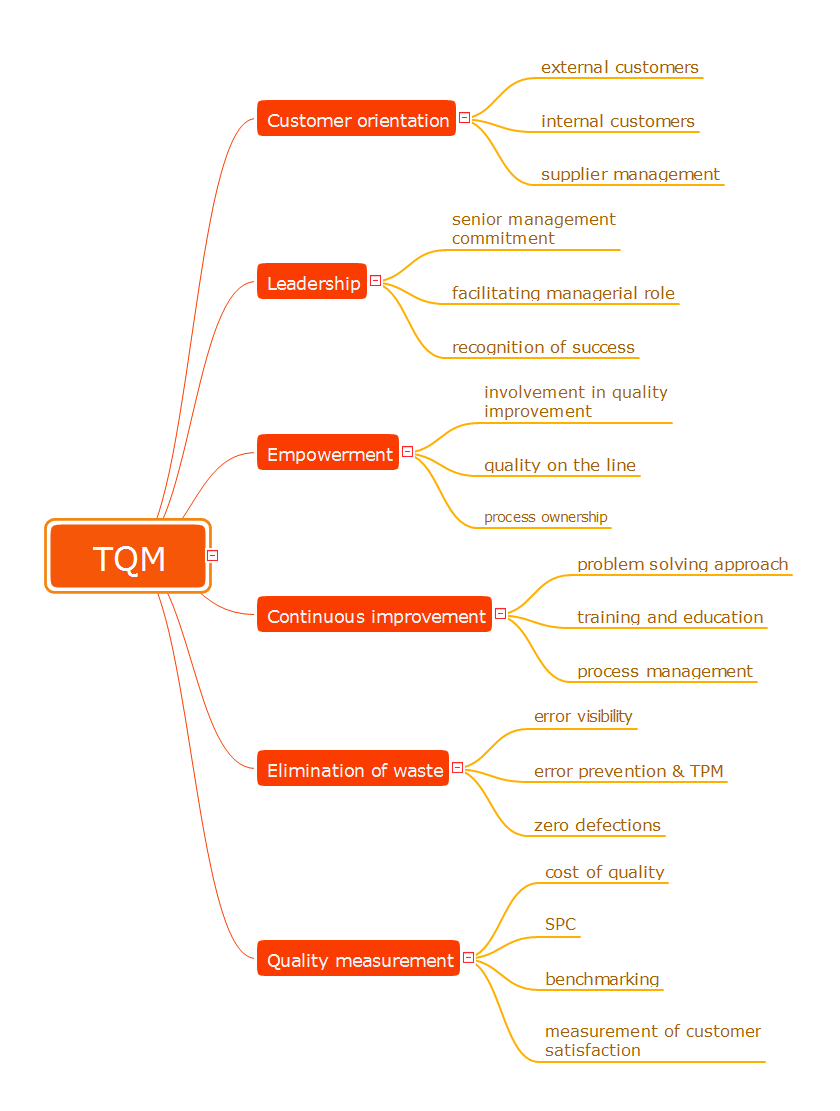
The desire to encourage the production of competitive goods led to the establishment of new method of continuous quality improvement of all organizational processes, production and service. This method successfully launched in Japan and the USA was named Total Quality Management (TQM). Now, the TQM is a dynamically developed concept, a strategic approach to management that is based on manufacturing goods or services of the best quality among innovative counterparts from the point of view of consumers. The main idea of TQM is that the company should work not only on the product quality, but also on the quality of company's work, including the work of staff. The constant parallel improvement of product quality, quality of organization processes, level of qualification the personnel allow to achieve more rapid and effective business development. Mind Maps are effective in a field of quality management and allow to structure all key quality points on one page. This Mind Map designed in ConceptDraw MINDMAP software illustrates the well-known Total Quality Management (TQM) methodology.TQM Diagram Tool
The Total Quality Management Diagram solution helps you and your organization visualize business and industrial processes. Create Total Quality Management diagrams for business process with ConceptDraw software.Total Quality Management
Apart from a well-known quality management, there is also such term as a Total quality management that consists of some particular organization-wide efforts that are taken in order to install and to make permanent some definite climate in which an organization can continuously improve its ability to deliver only high-quality products/services to its customers.Total quality management techniques are known to be drawing on the previously developed ones used within the quality control. Total quality management enjoyed widespread attention during the early 1990s before being overshadowed by Lean manufacturing, ISO 9000 and Six Sigma.
Quality management presentation
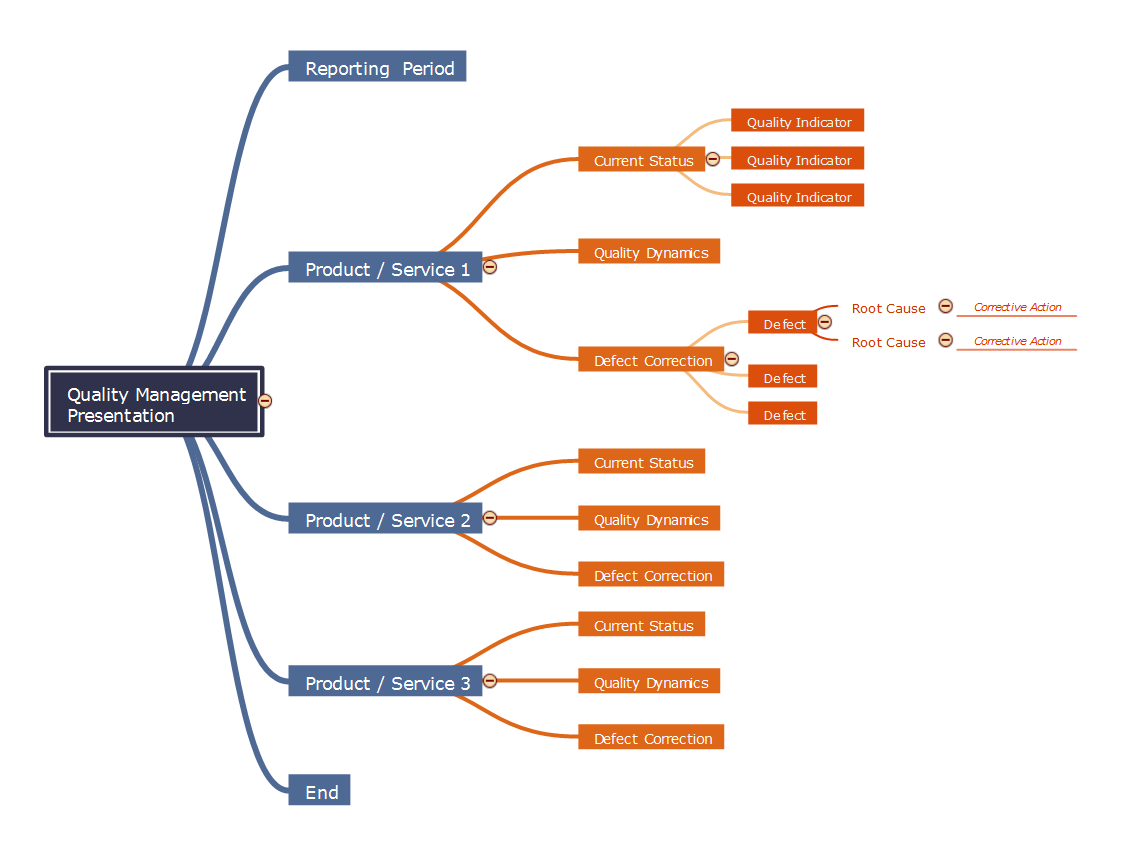
The presence of serious competition in a market economics obliges to pay great attention to quality issues. That's why today a quality management became an essential part of any business. Quality management is an approach responsible for the processes of managing, ensuring and improvement quality, and also increasing efficiency and flexibility of any business. The presentation is a special form of representation the information. Its main objective is to interest the audience in promoted product, service, idea, etc. In accordance with the theme of presentation and conditions of its carrying out is chosen the video for product demonstration, sound and color design. The brighter presentation is the better and more attractive for the target audience. The presentation finds its active use in any field, including marketing, management, and quality management. ConceptDraw MINDMAP software and numerous solutions from the Quality area of ConceptDraw Solution Park supply their users with powerful visualization tools for providing the quality control and improvement, and for designing quality Mind Maps, diagrams and presentations.Mind Mapping in the Quality Management
ConceptDraw MINDMAP has a addition to the ConceptDraw Solution Park that provides a creative approach to visualizing quality processes, Quality Mind Map Solution.TQM Diagram Example
The Total Quality Management Diagram solution helps you and your organization visualize business and industrial processes. Create Total Quality Management diagrams for business process with ConceptDraw software.Value-Stream Mapping for Manufacturing
Create value stream maps - for value stream analysis and value stream management, material and information flow mapping, using our quick start templates included with ConceptDraw.Quality Control
Quality control can separate the act of testing different products for uncovering the defects from the decision in order to deny or allow any product release, which may be determined by different fiscal constraints. Quality control issues are known to be among the top reasons for not renewing the contracts and, thus, they have to be taken into consideration while working on some project.
 Fishbone Diagrams
The Fishbone Diagrams solution extends ConceptDraw DIAGRAM software with the ability to easily draw the Fishbone Diagrams (Ishikawa Diagrams) to clearly see the cause and effect analysis and also problem solving. The vector graphic diagrams produced using this solution can be used in whitepapers, presentations, datasheets, posters, and published technical material.
Value Stream Map
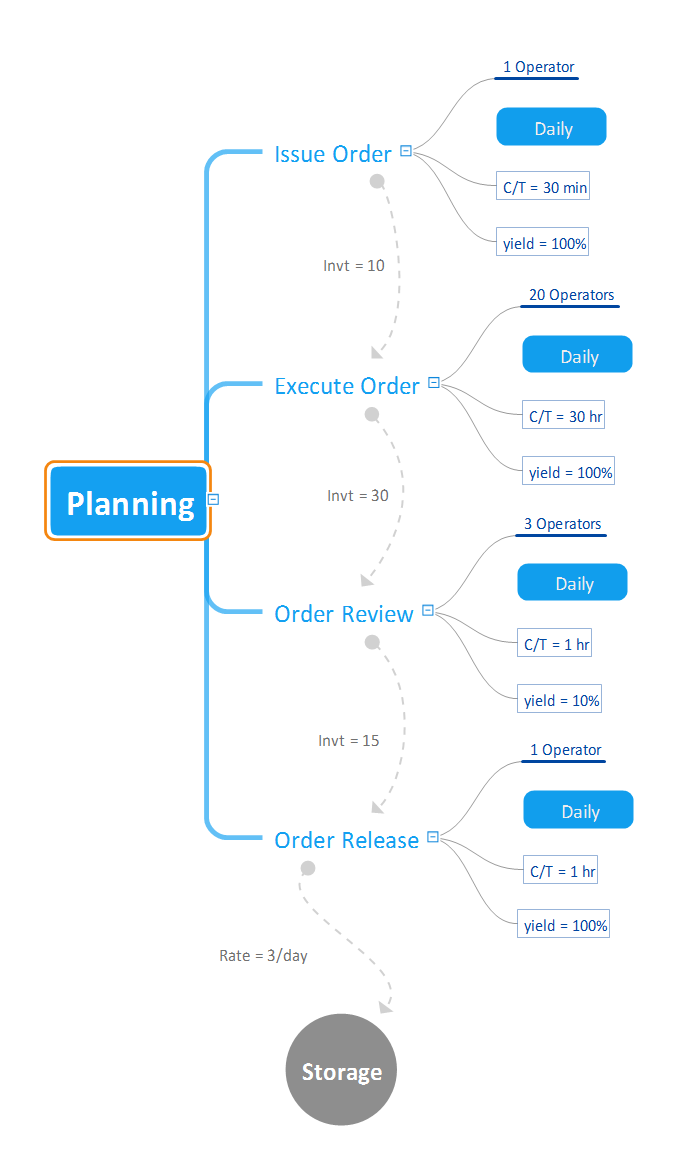
Value stream mapping is a well-known lean manufacturing and lean management method of depiction, analyzing and improvement the current state of flow of manufacturing and production process, of designing a future state for the serie of events that occur with product during the long way from the beginning to customer. Value stream map helps a manufacturing team to represent visually the flow of materials through the process, as well as the flow of information required to deliver a product or a service from the supplier to customer. Value stream map is a first step on the way to ideal state of organization due to the possibility to detect immediately the process delays, to analyze and identify the potential process improvement opportunities, to identify the waste in a process and to minimize them. The Mind Maps are widely applied in lean manufacturing and management. This Mind Map created using the powerful tools of ConceptDraw MINDMAP software demonstrates how the Value Stream Map can be represented as a mind map.What is Value Stream Mapping?
Value stream maps (VSM) are an essential tool for organizations applying Lean methods.
 Total Quality Management TQM Diagrams
Total Quality Management Diagrams solution extends ConceptDraw DIAGRAM software with samples, templates and vector stencils library for drawing the TQM flowcharts.
Bar Diagrams for Problem Solving. Create manufacturing and economics bar charts with Bar Graphs Solution
Create bar charts for visualizing problem solving in manufacturing and economics using the ConceptDraw DIAGRAM diagramming and vector drawing software extended with the Bar Graphs Solution from the Graphs and Charts area of ConceptDraw Solition Park.- Total Quality Management Value | Fishbone Diagram | 4ms Of ...
- Total Quality Management Value | Manufacturing 8 Ms fishbone ...
- What Is The 4ms Of Total Quality Management
- New Quality Solutions for ConceptDraw PRO v9 and ConceptDraw ...
- CS Odessa Adds New Quality Solutions for ConceptDraw PRO v9
- TQM Diagram Example | Process Flowchart | Quality Control Chart ...
- Manufacturing 8 Ms fishbone diagram - Template | Fishbone ...
- Manufacturing 8 Ms fishbone diagram - Template | Total Quality ...
- Total Quality Management Definition | Process Flowchart | Block ...
- Quality Management Issue Report About Fishbone Diagram Pdf
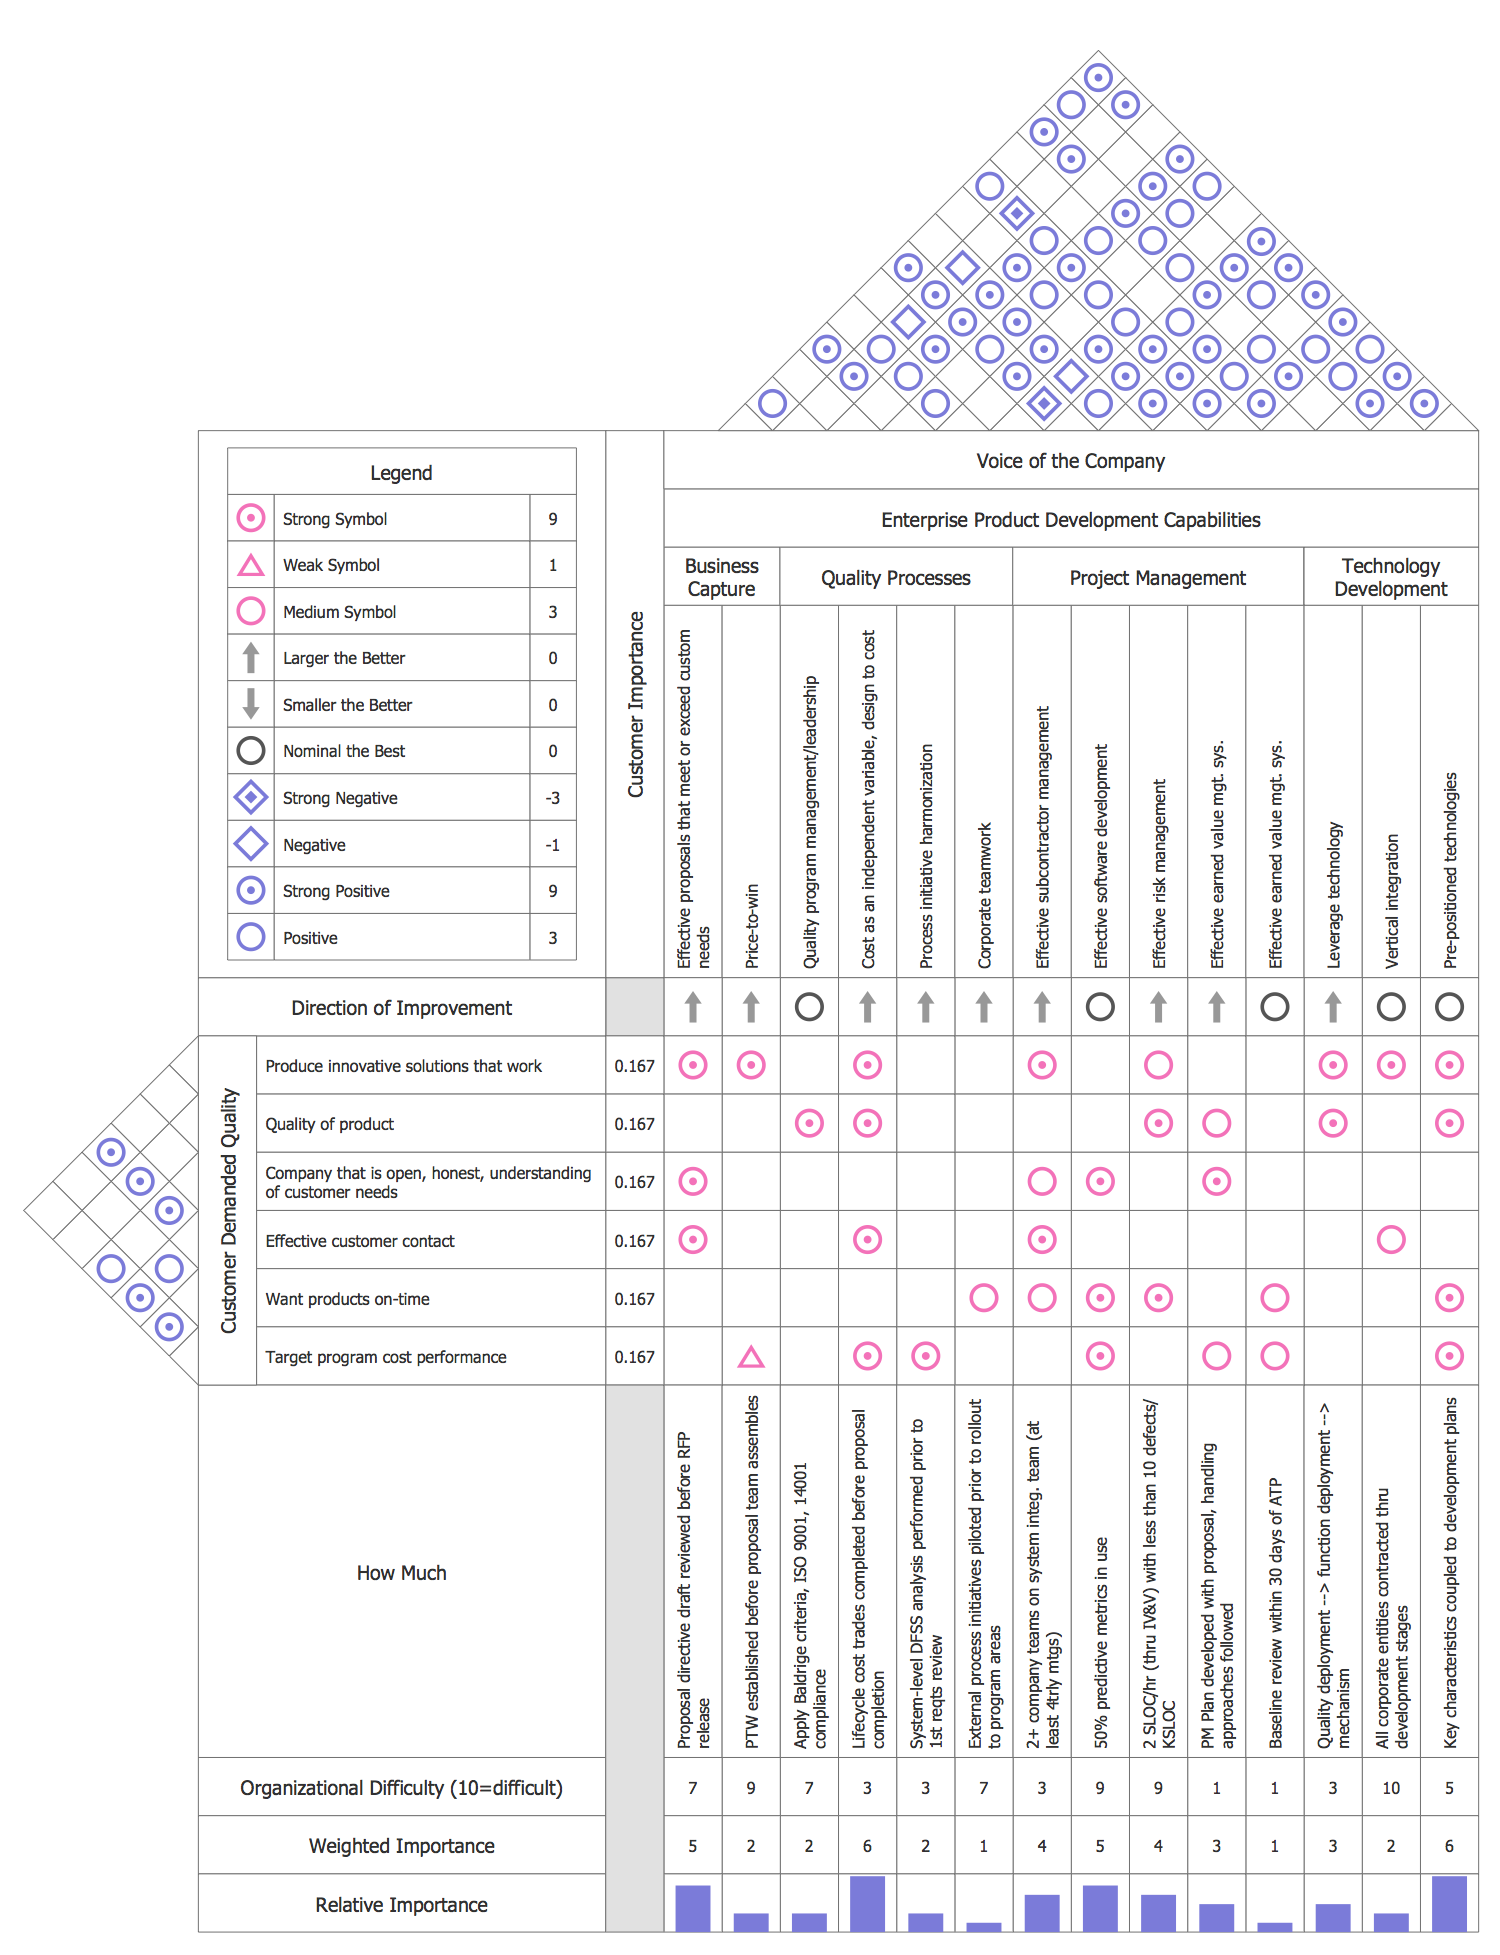
- CS Odessa Releases New House of Quality Solution
- 4 Ms fishbone diagram - Production process | Manufacturing 8 Ms ...
- 4 Ms fishbone diagram - Production process | Total Quality ...
- How to Construct a Fishbone Diagram | Total Quality Management ...
- Mechanical Related Quality Control Symbols And Their Meaning In ...
- Quality In Manufacturing Pdf And Ppt
- TQM Diagram Tool | Picture Graphs | Seven Basic Tools of Quality ...
- New House of Quality Solution for ConceptDraw PRO
- Mind Mapping in the Quality Management | Quality Control ...


