Use Case Diagrams technology with ConceptDraw DIAGRAM
Use case diagrams are used at the development of software and systems for definition of functional system requirements or system of systems. Use case diagram presents the consecution of object’s actions (user’s or system’s) which are executed for reaching the definite result.
 Universal Diagramming Area
This area collects solutions for drawing diagrams, charts, graphs, matrices, geographic and road maps for education, science, engineering, business.
 Entity-Relationship Diagram (ERD)
Entity-Relationship Diagram (ERD) solution extends ConceptDraw DIAGRAM software with templates, samples and libraries of vector stencils from drawing the ER-diagrams by Chen's and crow’s foot notations.
Applications
ConceptDraw DIAGRAM is a multipurpose software from ConceptDraw suite intended for diagramming, business and technical drawing, and visual documenting. You can reach a lot of practical benefits from the use of ConceptDraw DIAGRAM. The list of ConceptDraw DIAGRAM applications and versatile possibilities is extremely great. Among them network and system diagramming, business diagramming, Cisco network design, network visualization, software and database design, software development, business flowcharting, data flow design, databases modeling and visualization, business processes modeling, business drawing, technical drawing, GUI prototyping, Organizational charts construction, business processes fixing, web site planning and design, Internet solutions design, information architecture design, UML modeling, ER diagrams design, home and landscape design, and a lot of other applications. ConceptDraw DIAGRAM offers the users a beneficial collaboration, compatibility with MS Visio and many other popular programs, including other products from ConceptDraw suite.Control and Information Architecture Diagrams (CIAD) with ConceptDraw DIAGRAM
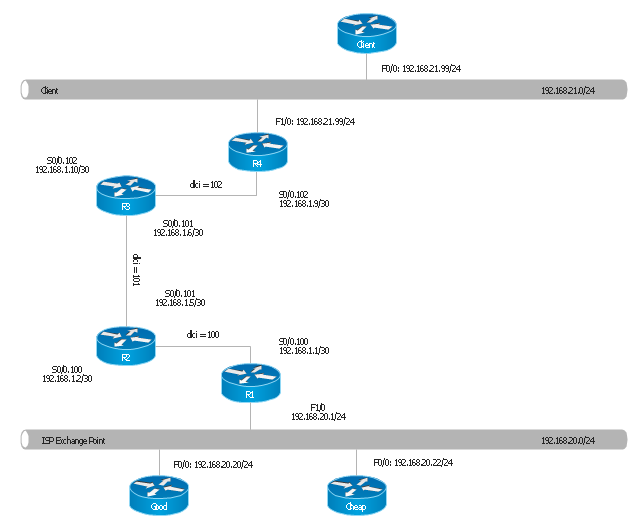
One of the three main constituents of any enterprise is the Control and Information Architecture. The rest two are Production facilities and People and Organization."Logical topology, or signal topology, is the arrangement of devices on a computer network and how they communicate with one another. How devices are connected to the network through the actual cables that transmit data, or the physical structure of the network, is called the physical topology. Physical topology defines how the systems are physically connected. It represents the physical layout of the devices on the network. The logical topology defines how the systems communicate across the physical topologies.
Logical topologies are bound to network protocols and describe how data is moved across the network. ...
EXAMPLE : twisted pair Ethernet is a logical bus topology in a physical star topology layout. while IBM's token ring is a logical ring topology, it is physically set up in star topology." [Logical topology. Wikipedia]
This Cisco logical computer network diagram example was created using the ConceptDraw PRO diagramming and vector drawing software extended with the Cisco Network Diagrams solution from the Computer and Networks area of ConceptDraw Solution Park.
- UML Diagrams with ConceptDraw PRO | Use Case Diagrams ...
- Design Element: IVR for Network Diagrams | Network Diagramming ...
- UML Diagrams with ConceptDraw PRO | UML Diagram | Rapid UML |
- Structured Systems Analysis and Design Method (SSADM) with ...
- Network Diagram Software Logical Network Diagram | Network ...
- Design Element: Rack Diagram for Network Diagrams | How to Draw ...
- Network Diagram Software Topology Network | Cisco Network ...
- Universal Diagramming Area | Engineering | Network Diagram ...
- ConceptDraw PRO Network Diagram Tool | Hotel Network Topology ...
- How to Draw a Computer Network Diagrams | Network Diagram ...
- UML Diagrams with ConceptDraw PRO | Software Development ...
- UML Diagram of Parking | Diagramming Software for Design UML ...
- Structured Systems Analysis and Design Method (SSADM) with ...
- Network Diagram Software Logical Network Diagram | How to Draw ...
- Cisco Network Topology
- Account Flowchart. Flowchart Examples | Control and Information ...
- Network Diagram Examples | Cisco logical network diagram | Cisco ...
- Diagramming software for Amazon Web Service diagrams , charts ...
- ConceptDraw PRO Network Diagram Tool | Computer Network of an ...
- Good Flow Chart app for Mac | Marketing Diagrams | Circular arrows ...


