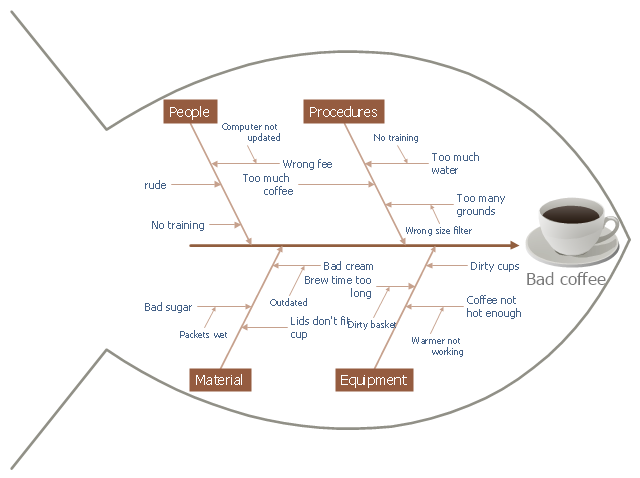
This cause and effect diagram sample was redesigned from the Wikimedia Commons file: Fishbone BadCoffeeExample.jpg. [commons.wikimedia.org/ wiki/ File:Fishbone_ BadCoffeeExample.jpg]
This file is licensed under the Creative Commons Attribution-Share Alike 3.0 Unported license. [creativecommons.org/ licenses/ by-sa/ 3.0/ deed.en]
The fishbone diagram example "Bad coffee" was created using the ConceptDraw PRO diagramming and vector drawing software extended with the Fishbone Diagrams solution from the Management area of ConceptDraw Solution Park.
 Fishbone Diagrams
The Fishbone Diagrams solution extends ConceptDraw PRO v10 software with the ability to easily draw the Fishbone Diagrams (Ishikawa Diagrams) to clearly see the cause and effect analysis and also problem solving. The vector graphic diagrams produced using this solution can be used in whitepapers, presentations, datasheets, posters, and published technical material.
Using Fishbone Diagrams for Problem Solving
Problems are obstacles and challenges that one should overcome to reach the goal. They are an inseparable part of any business, and the success of an enterprise often depends on ability to solve all problems effectively. The process of problem solving often uses rational approach, helping to find a suitable solution.Using Fishbone Diagrams for Problem Solving is a productive and illustrative tool to identify the most important factors causing the trouble. ConceptDraw PRO extended with Fishbone Diagrams solution from the Management area of ConceptDraw Solution Park is a powerful tool for problem solving with Fishbone Ishikawa diagram graphic method.
Fishbone Diagram
Fishbone Diagram is another name for the Cause and Effect Diagram or the Ishikawa Diagram which got its name from the fact that it looks like a fish skeleton. Developed by Kaoru Ishikawa in 1968, a Fishbone Diagram is effectively used for a cause and effect analysis which allows to consider all possible causes for a certain problem or event.ConceptDraw PRO supplied with Fishbone Diagrams solution from the Management area is the best software for fast and easy drawing professional looking Fishbone Diagram.
- Bar Diagrams for Problem Solving. Create business management ...
- Fishbone diagram - Bad coffee | Fishbone Diagrams | Using ...
- Cause and Effect Analysis ( Fishbone Diagrams ) | Business ...
- PROBLEM ANALYSIS. Root Cause Analysis Tree Diagram | Using ...
- Fishbone Diagram | Fishbone Diagrams | Business Productivity ...
- Using Fishbone Diagrams for Problem Solving | Cause And Effect ...
- Business Productivity Diagramming | Fishbone Diagram | Cause ...
- Using Fishbone Diagrams for Problem Solving | Solution Of Bad ...
- Fishbone Diagram | Business Productivity Diagramming | Fishbone ...
- Fishbone Diagram | Business Productivity Diagramming | Cause ...
- Using Fishbone Diagrams for Problem Solving | Cause and Effect ...
- Using Fishbone Diagrams for Problem Solving | Fishbone Diagram ...
- Cause and Effect Analysis ( Fishbone Diagrams ) | Using Fishbone ...
- Fishbone Diagram | Using Fishbone Diagrams for Problem Solving ...
- Fishbone Diagram | Business Productivity Diagramming | Cross ...
- Fishbone Diagram | Fishbone Diagrams | Cause and Effect Analysis ...
- Fishbone Diagram | Business Productivity Diagramming | Use a ...
- Fishbone Diagram | Use a Fishbone Diagram to Attack Complex ...
- Fishbone Diagram | Business Productivity Diagramming | Business ...
- Using Fishbone Diagrams for Problem Solving | Concept map - Risk ...


