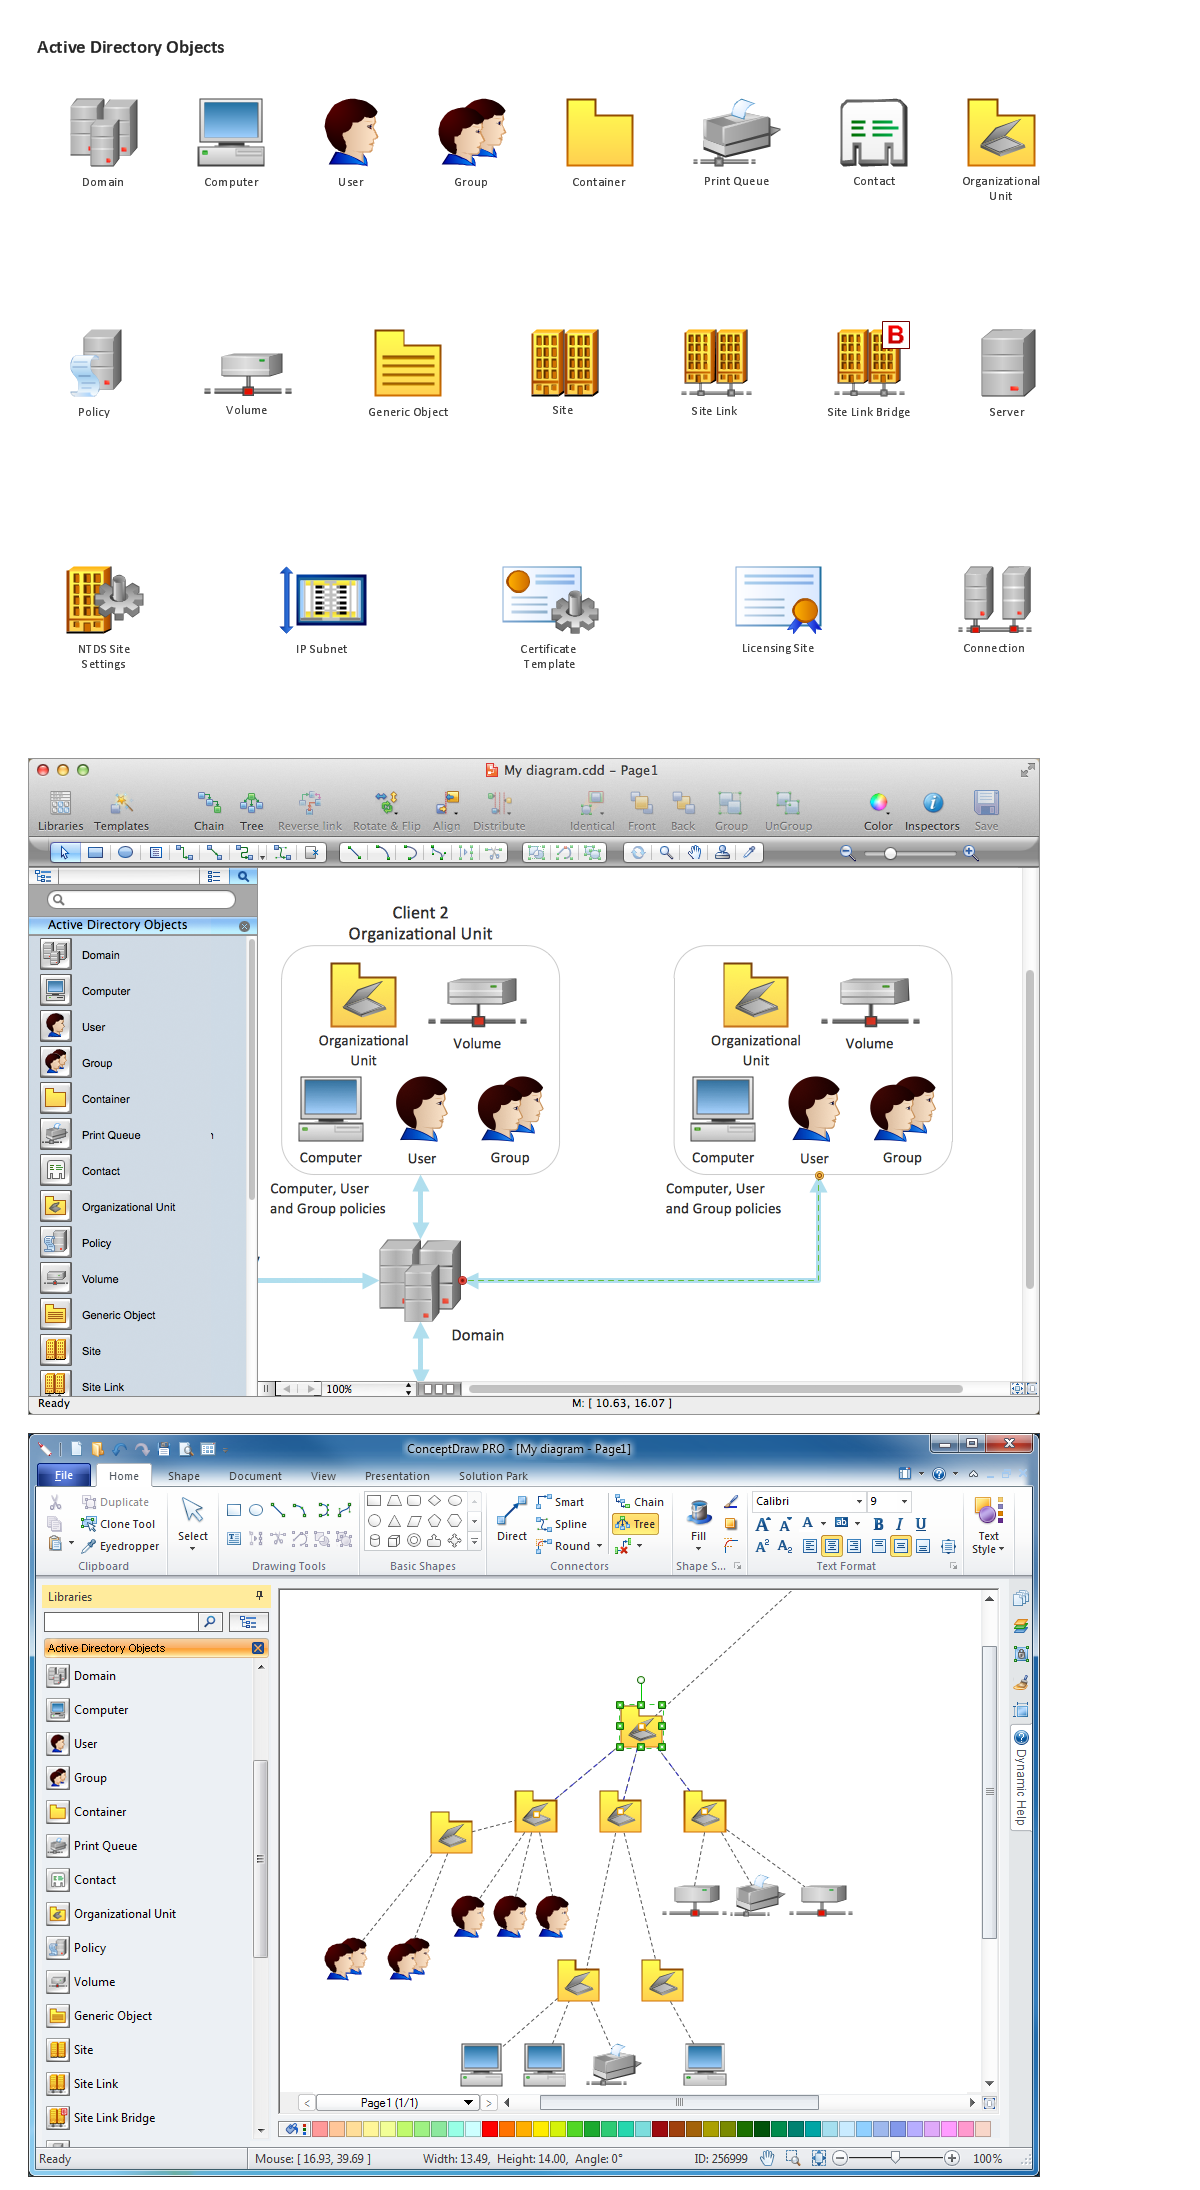
Network Diagramming Software for Network Active Directory Diagrams
ConceptDraw PRO is perfect for software designers and software developers who need to draw Network Active Directory Diagrams.
HelpDesk
How to Draw a Fishbone Diagram with ConceptDraw PRO
Fishbone (Ishikawa) Diagram is often used in business to determine the cause of some problem. A Fishbone diagram is also called cause-and-effect diagram.The main goal of the Fishbone diagram is to illustrate in a graphical way the relationship between a given outcome and all the factors that influence this outcome. The complete diagram resembles a fish skeleton as its name implies. Cause and Effect analysis is used in management to identify the possible causes of a problem in order to eliminate them. The ability to create a Fishbone Diagram is supported by the Fishbone Diagram solution.HelpDesk
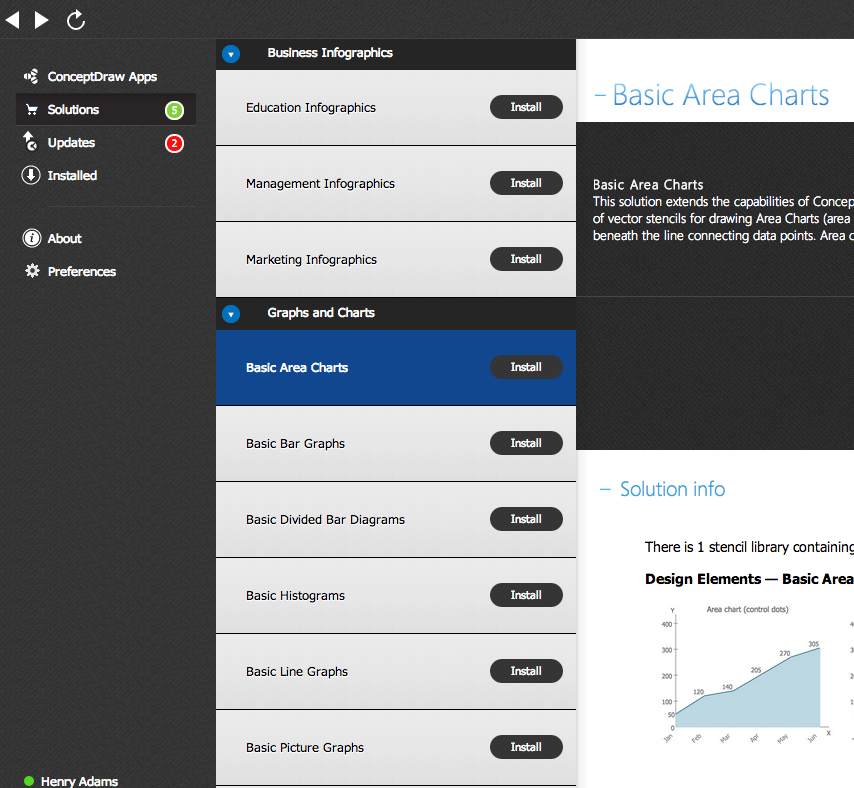
Download and Install a Solution from ConceptDraw Solution Park
All Users of ConceptDraw software are enabled to download a set of business solutions intended to provide productivity increasing for number of specific business tasks. Solutions available for download are collected in the Solution Park. ConceptDraw STORE is an application designed to manage downloads from Solution Park. Each ConceptDraw product has a built-in access to Solution Park and supports a possibility to download and install solutions from Solution Park using STORE.
 Remote Presentation for Skype
This solution extends ConceptDraw MINDMAP software with the ability to collaborate via Skype.
 Health Food
The Health Food solution contains the set of professionally designed samples and large collection of vector graphic libraries of healthy foods symbols of fruits, vegetables, herbs, nuts, beans, seafood, meat, dairy foods, drinks, which give powerful possi
 Soccer
The Soccer (Football) Solution extends ConceptDraw PRO v9.5 (or later) software with samples, templates, and libraries of vector objects for drawing soccer (football) diagrams, plays schemas, and illustrations. It can be used to make professional looking
 Histograms
How to make a Histogram? Making a Histogram is an incredibly easy process when it is done with ConceptDraw PRO. The Histograms Solution enhances ConceptDraw PRO v10 functionality with extensive drawing tools, numerous samples, and examples; also a quick-start template and library of ready vector stencils for visualization the data and professional drawing Histograms.
- How to Draw a Computer Network Diagrams
- Examples of Flowcharts, Org Charts and More | 3D Network ...
- Cloud Computing Diagrams | Computer and Networks Area ...
- 3D Network Diagram Software | 3D Network Diagrams. Computer ...
- Computer Network Diagrams | Computer and Networks Area ...
- Computer Network Diagrams | Audio and Video Connectors | DVI ...
- Cloud Computing | Computer and Networks Area | Cloud Computing ...
- Personal area (PAN) networks . Computer and Network Examples ...
- Cloud Computing Diagrams | Computer and Networks Area | Cloud ...
- Cloud Computing Diagrams | Cloud Computing | Computer and ...
- Personal area (PAN) networks . Computer and Network Examples ...
- Bus network topology diagram
- Personal area (PAN) networks . Computer and Network Examples ...
- AWS Architecture Diagrams | How to Draw a Computer Network ...
- Storage area networks (SAN). Computer and Network Examples ...
- ConceptDraw PRO Network Diagram Tool | Audio and Video ...
- Computer and Networks Area | Computer Network Diagrams ...
- Diagramming tool - Amazon Web Services and Cloud Computing ...
- Network Layout Floor Plans | Network Topologies | Cisco Network ...


