The vector stencils library "Workflow diagrams" contains 54 symbol icons of workflow diagrams.
The workflow diagrams represent information flow, automation of business processes, business process re-engineering, accounting, management, and human resources tasks in industry, business, and manufacturing.
Use this library to draw workflow diagrams in the ConceptDraw PRO diagramming and vector drawing software extended with the Workflow Diagrams solution from the Business Processes area of ConceptDraw Solution Park.
www.conceptdraw.com/ solution-park/ business-process-workflow-diagrams
Accounting

Accounts Payable

Accounts Receivable

Bank

Board of Directors

Copy Center

Customer Service

Distribution

Finance

Information Systems

International Division

International Marketing

International Sales

Inventory

Legal Department

Mailroom 2

Mailroom 1

Management

Manufacturing

Marketing

Motor Pool

Packaging

Payroll

Person 1

Person 2

Personnel/ Staff

Publications

Purchasing

Quality Assurance

Exchange

Reception

Research and Development

Sale contract

Shipping

Suppliers

Telecommunications

Treasurer

Warehouse

Lorry

Quality

Production

Box

Boxes

Open box

Payment

Receiving

Sales

Phone

Operator 1

Online booking

Operator 2

Server

Car

Mini truck

The vector stencils library "HR department" contains 50 workflow symbols.
Use this department icon set to draw your HR process flowcharts, workflow diagrams and infographics with the ConceptDraw PRO diagramming and vector drawing software.
The HR pictograms library "HR department" is included in the HR Flowcharts solution from the Management area of ConceptDraw Solution Park.
Accounting

Accounts payable

Accounts receivable

Audit

Bank

Board of directors

Career center

Copy center

Customer service operator

Customer service technician

Data center

Delivery

Design

Devices management

Distribution

Distribution 2

Employee

Engineering

Facilities

Finance

Human resource

Information services

Information systems

International division

International marketing

International sales

Inventory

Legal department

Mail room

Mail service

Management

Manufacturing

Marketing

Motorpool

Online service

Packaging

Payroll

Publications

Purchasing

Quality assurance

Receiving

Reception

Research and development

Scales

Sales growth

Security

Shipping

Suppliers

Telecommunication

Warehouse

The vector stencils library "Sales department" contains 49 company department icons.
Use these sales pictograms to draw your sales flowcharts, workflow diagrams and process charts with the ConceptDraw PRO diagramming and vector drawing software.
The vector stencils library "Sales department" is included in the Sales Flowcharts solution from the Marketing area of ConceptDraw Solution Park.
Accounting

Accounts payable

Accounts receivable

Audit

Bank

Board of directors

Copy center

Customer service operator

Customer service technician

Data center

Delivery

Design

Devices management

Distribution

Distribution

Employee

Engineering

Facilities

Finance

Human resource

Devices management

Information systems

International division

International marketing

International sales

Inventory

Legal department

Mail room

Mail service

Management

Manufacturing

Marketing

Motorpool

Online service

Packaging

Payroll

Publications

Purchasing

Quality assurance

Receiving

Reception

Research and development

Sales growth

Scales

Security

Shipping

Suppliers

Telecommunication

Warehouse

HelpDesk
How to Add Data-driven Infographics to MS Word Document

Geo Map - Africa - Botswana

Geo Map - Africa - Kenya

HelpDesk
How to Add a Bubble Diagram to MS Word

HelpDesk
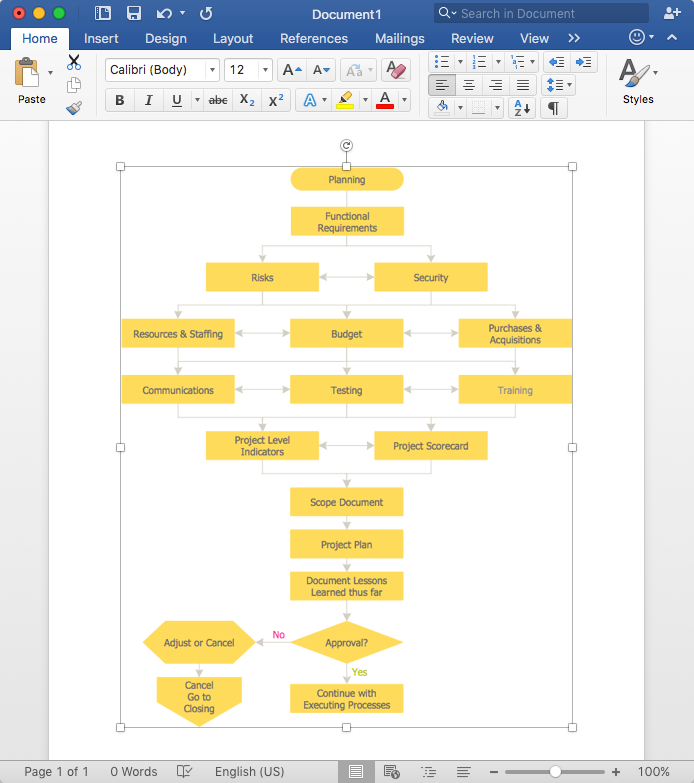
How to Add a Flowchart to MS Word Document
The vector stencils library "Toolbar control elements" contains 42 toolbar graphical control elements.
Use this tool bar control element UI icon set to design graphic user interface (GUI) of your software application for OS X 10.10 Yosemite Apple Mac operating system.
The example "Toolbar control elements - Vector stencils library" was created using the ConceptDraw PRO diagramming and vector drawing software extended with the Mac OS User Interface solution from the Software Development area of ConceptDraw Solution Park.
Drop-down button

Drop-down button - ON press left

Drop-down button - ON press right

Tool bar button

Tool bar button - ON press

Tool bar button - selected

Left segment

Left segment - ON press

Left segment - selected

Middle segment

Middle segment - ON press

Middle segment - selected

Right segment

Right segment - ON press

Right segment - selected

Segmented control - 2 buttons

Segmented control - 3 buttons

Segmented control - 4 buttons

Small button toggle

Back - Forward button

List/Icons view control
Arrange button

Action menu

Downloads button

Copy button

Share button

Edit tags button

Sidebar button

Slider element

Tool bar button 2

Tool bar button 2 - ON press

Tool bar button 2 - selected

Search field

Search field - active

"Stoplights" control
Close button

Minimize button

Maximize button

Close button - hover

Minimize button - hover

Maximize button - hover

Action button - inactive

Geo Map - Africa - Egypt

Geo Map - Africa - Cameroon

Geo Map - Africa - Djibouti

Geo Map - Africa - Burkina Faso

HelpDesk
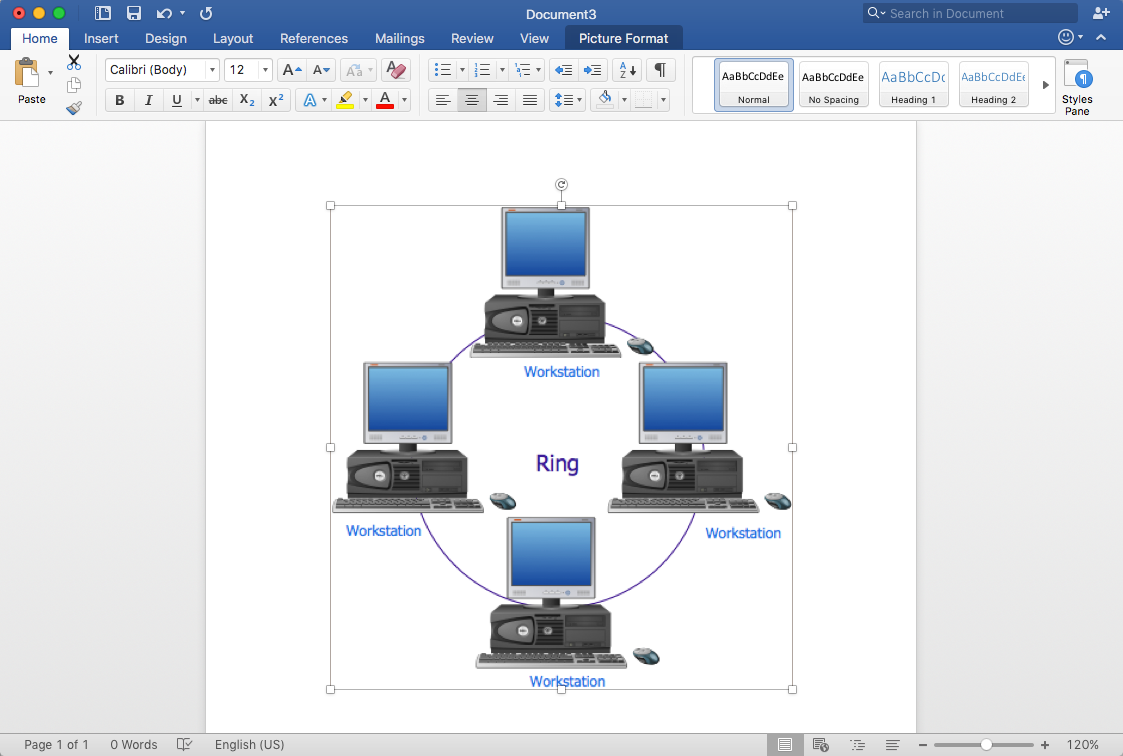
How to Add a Network Diagram to MS Word
Gane Sarson Diagram

- Carton Manufacturing Vector Png
- Warehouse Vector Png
- Department Vector Png
- Vector Growth Png
- Accounts Payable Vector Png
- Workflow diagrams - Vector stencils library | Transport pictograms ...
- Customer Care Vector Png
- Customer Services Vector Png
- Job Payroll Png Vector
- Reception Disk Top View Png
- Technician Png Clip Art
- Development Vector Png
- Truck Vector Png
- Floor Plans | Electrical Symbols — Stations | Office furniture - Vector ...
- Bank Vector Png
- Reception Vector Png
- Workflow diagrams - Vector stencils library | Human In A Truck ...
- People Auditor Vector Png
- Sales Marketing Vector Png
- Workflow diagrams - Vector stencils library | Industrial transport ...