How to Create a Powerful Infographic When You do not Have a Designer
Create a powerful infographic, become inspired by the people with ConceptDraw.Subway infographic design elements - software tools
Subway infographic design elements of MetroMap and ConceptDraw software tools.
 What are Infographic Area
Solutions of the area What is Infographics from ConceptDraw Solution Park collect templates, samples and vector stencils libraries with design elements for the drawing information graphics.
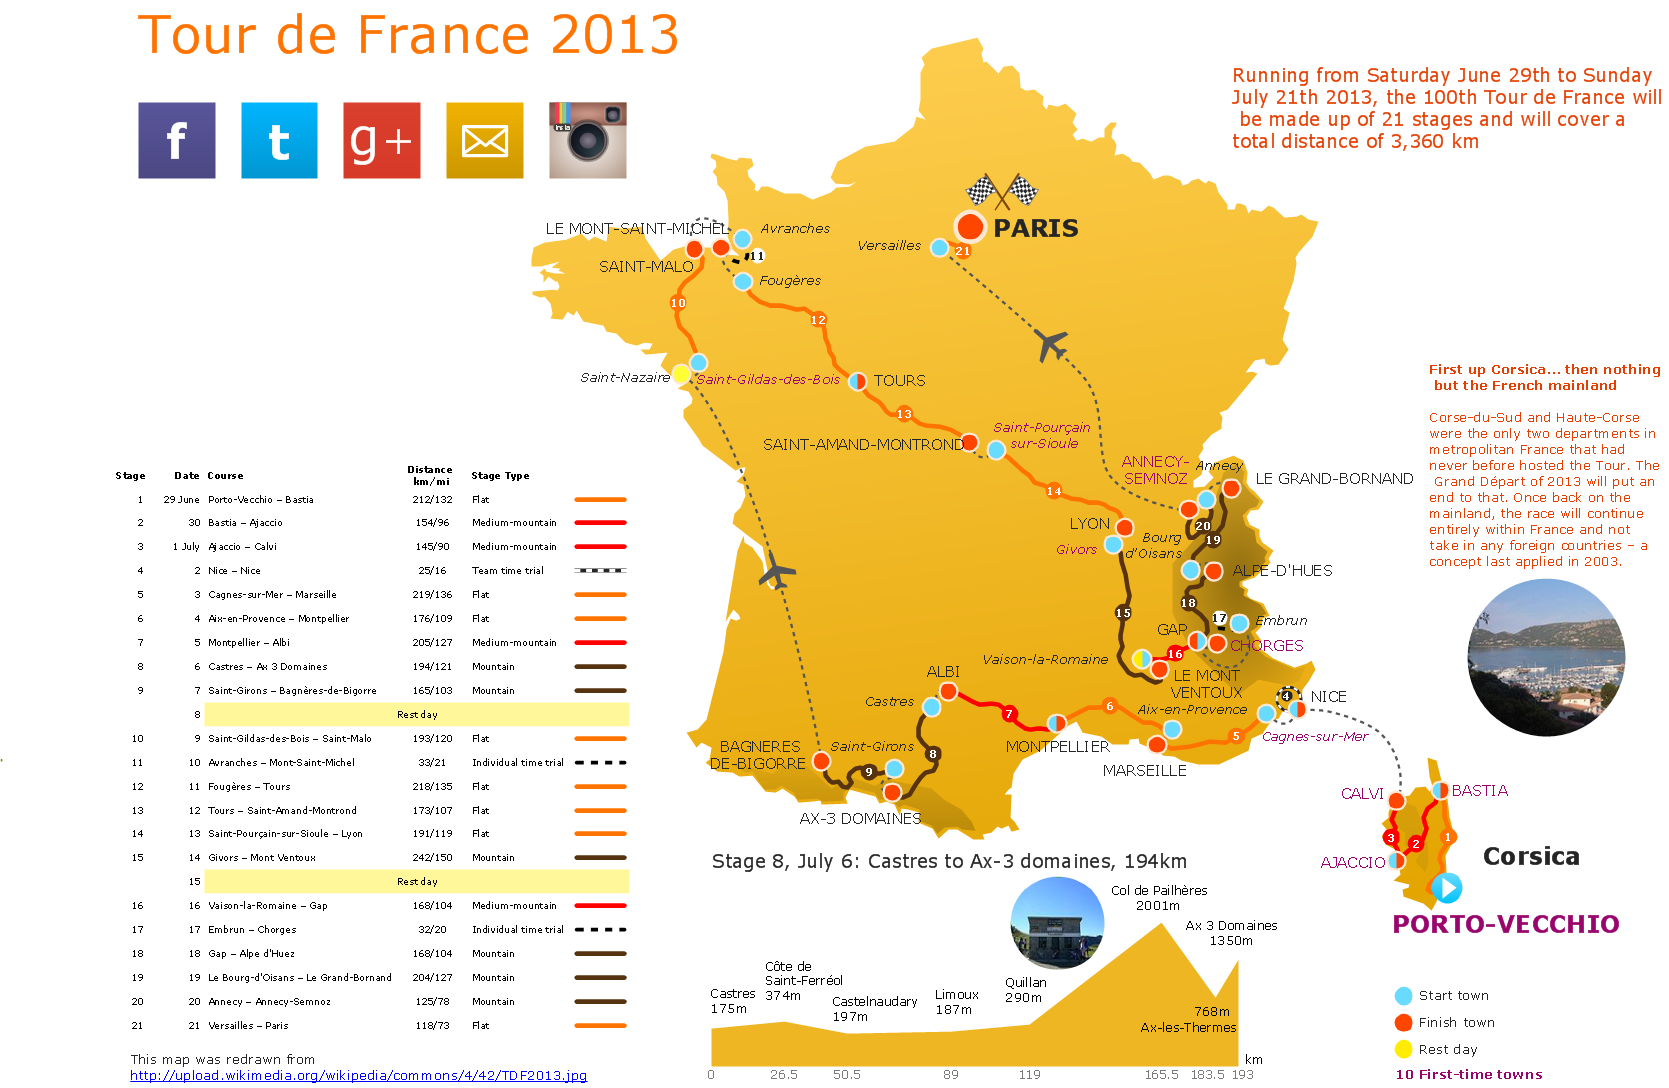
 Spatial Infographics
Spatial infographics solution extends ConceptDraw PRO software with infographic samples, map templates and vector stencils libraries with design elements for drawing spatial information graphics.
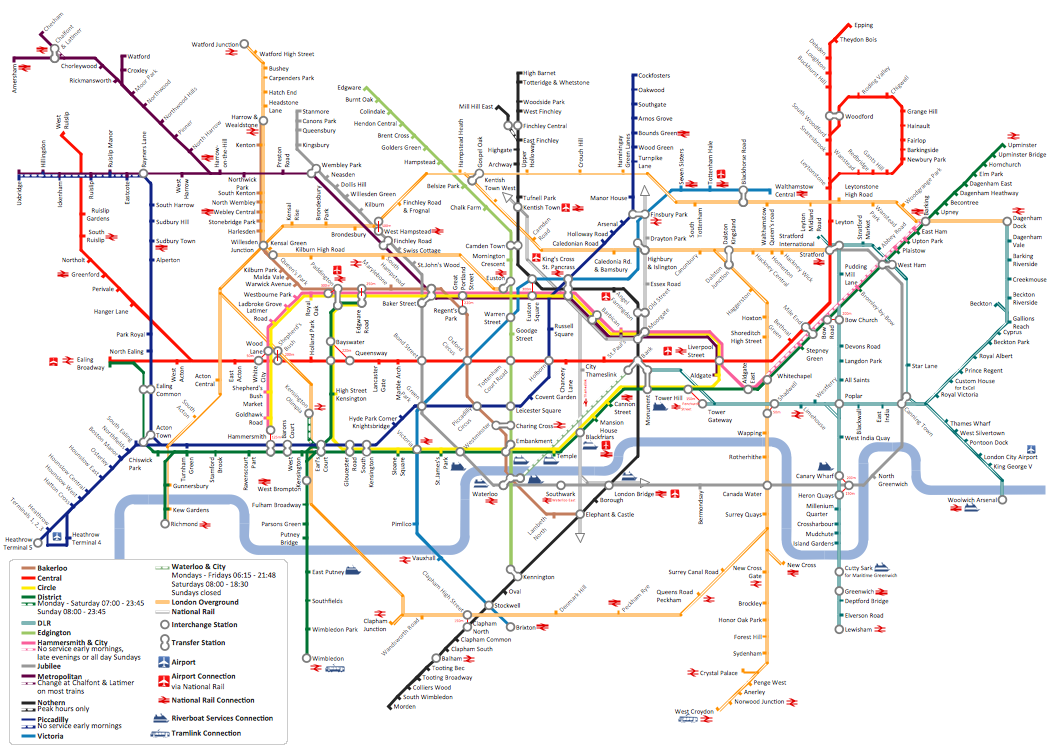
How to draw Metro Map style infographics? (London)
Tool to draw Metro Map styled inforgraphics. London Tube map sample.Tools to Create Your Own Infographics
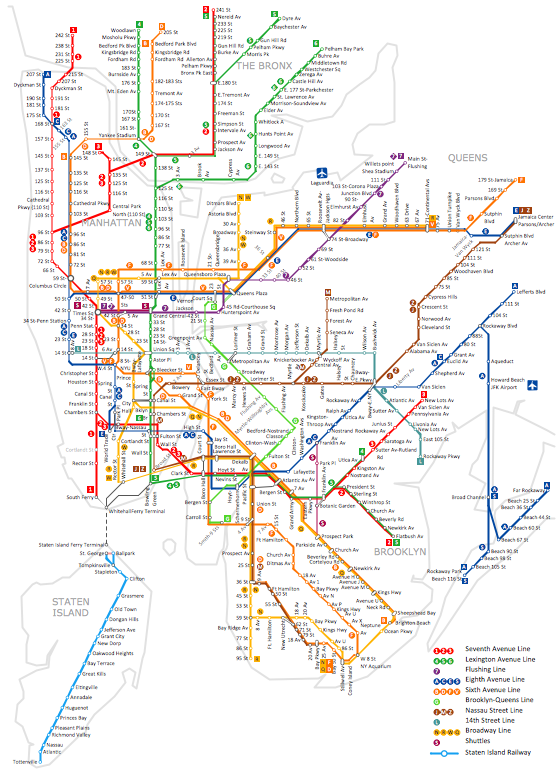
Over the past few centuries, data visualization has evolved so much that we use it every day in all areas of our lives. Many believe that infographic is an effective tool of storytelling, as well as analytics, and that it is able to overcome most of the language and educational barriers. Understanding the mechanisms of human perception will help you to understand how abstract forms and colors used in data visualization can transmit information more efficient than long paragraphs of text.Infographic software: the sample of New York City Subway map
Tool to draw Metro Map styled inforgraphics. New York City Subway map sample.How to draw Metro Map style infographics? Moscow, New York, Los Angeles, London
The solution handles designs of any complexity, and the comprehensive library covers all key aspects of a transportation system. To further enhance your map design, there is the option to embed links, that can display station images or other relevant, important information. We have also included a set of samples in the solution, that show the possible real-world application — complex tube systems including the London Tube and New York City Subway show the level of detail possible when using the Metro Map Solution.Winter Sports. Using Winter Sports Design Elements Producing Infographics
The Winter Sports solution from Sport Area of ConceptDraw Solution Park contains winter sports pictogram you may use illustrating any kind of material about Olympic Games or any other sport competitions.
 ConceptDraw Solution Park
ConceptDraw Solution Park collects graphic extensions, examples and learning materials
 Fishbone Diagram
Fishbone Diagrams solution extends ConceptDraw PRO software with templates, samples and library of vector stencils for drawing the Ishikawa diagrams for cause and effect analysis.
- Map Infographic Design
- Spatial Infographics | Map Infographic Design | Spatial infographics ...
- How to draw Metro Map style infographics ? (New York)
- Map Infographic Design
- Superb Examples of Infographic Maps | How to Create a Powerful ...
- Map Infographic Creator | Spatial infographics Design Elements ...
- Subway infographic design elements - software tools ...
- How to draw Metro Map style infographics ? (London) | Infographic ...
- Spatial infographics Design Elements: Transport Map
- How to draw Metro Map style infographics ? (New York) | How to ...
- How to Create a Powerful Infographic When You do not Have a ...
- Metro Map | Best Value Stream Mapping mac Software | Subway ...
- Infographic design elements, software tools Subway and Metro style ...
- Spatial infographics Design Elements: Continental Map | Map ...
- Transportation Infographics | How to Create a Powerful Infographic ...
- What is Infographics Area | How to draw Metro Map style ...
- Map Infographic Creator | How to draw Metro Map style infographics ...
- Value Stream Mapping - Design Elements | Subway infographic ...
- Excellent Examples of Infographic Maps | Visualization Spatial Data ...
- Maps | Brilliant Examples of Infographics Map, Transport, Road ...


