This site uses cookies. By continuing to browse the ConceptDraw site you are agreeing to our Use of Site Cookies.
HelpDesk

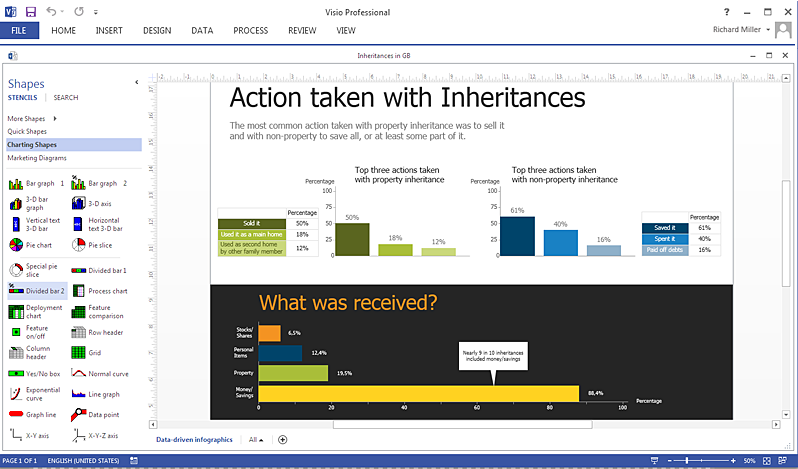
How To Create an MS Visio Data-Driven Infographics

ConceptDraw DIAGRAM allows you to easily create data-driven infographics of any complexity and then make an MS Visio file from your diagram in a few simple steps.
HelpDesk

How To Create Visio Bubble Chart

ConceptDraw DIAGRAM allows you to easily create business charts and diagrams of any complexity, including the bubbles diagram and then make a MS Visio file from your diagram in a few simple steps.
HelpDesk

How To Make Visio Circle-Spoke Diagram

Circle-Spoke Diagram consists of a central round balloon, which is circled with other balloons as a ring. The Circle-Spoke Diagram is usually used in marketing. It shows the relationships between entities and the central element. Circle-Spoke Diagram can be used in marketing documentation and presentations. ConceptDraw DIAGRAM allows you to easily create marketing charts of any complexity, including the circle-spoke diagram and then make an MS Visio file from your diagram in a few simple steps. You can easily design your business documentation and share it easily with MS Visio users.

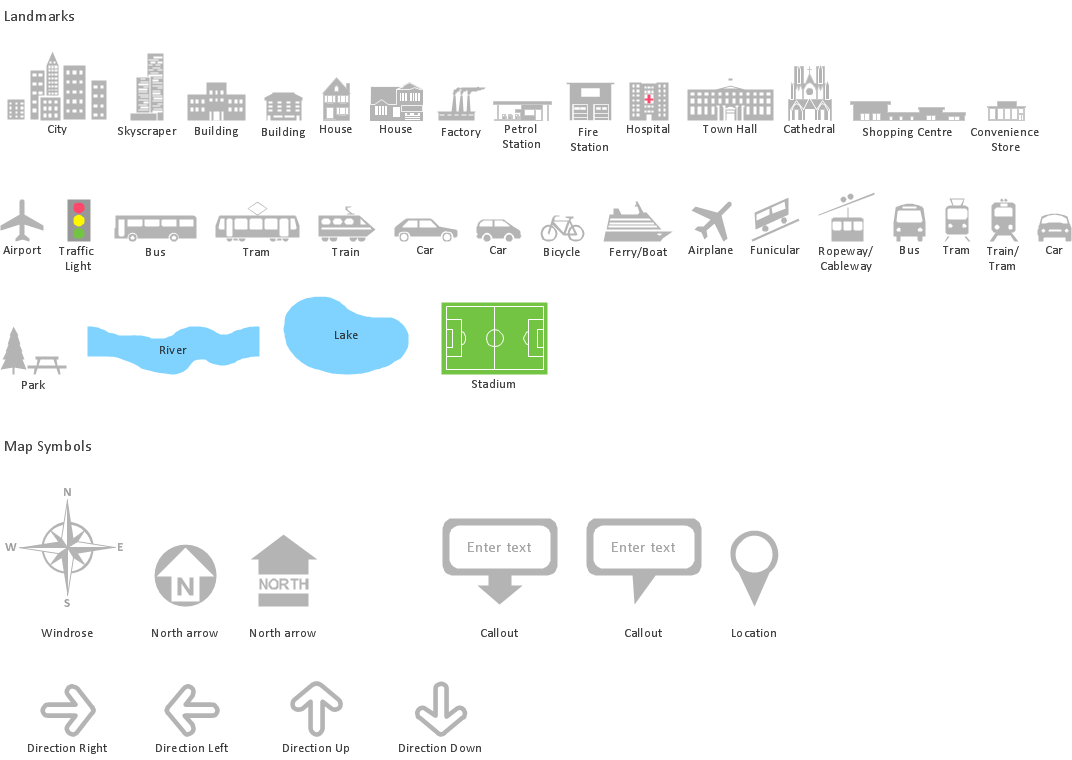
Spatial infographics Design Elements: Transport Map

Do you like infographics and data visualization? Creating infographics is super-easy with ConceptDraw.

Best Tool for Infographic Construction

ConceptDraw is a best data visualization tool that will allow everyone to create rich infographics and visualizations quickly and easily.

ConceptDraw DIAGRAM Comparison with Omnigraffle Professional and MS Visio

ConceptDraw DIAGRAM comparison with Omnigraffle Professional and MS Visio shows you the significant benefits of ConceptDraw DIAGRAM , which offers varied useful drawing tools, the capability of creation multi-page documents, wide export / import capabilities in graphics formats, integration with Visio and Microsoft Office applications, availability of built-in scripting language and ConceptDraw Solution Park with numerous solutions, vector objects libraries, templates and samples. Business today is conducted with incredible rate and dynamic presentations become very popular. Sometimes while conducting the business, may happen that you can't describe some situation, state, or process with only words. In these cases, it is convenient to include graphics and diagrams associated with the text. This guarantees successful communication with other stakeholders and team members, and faultless understanding the information by them. The combination of words and graphics is an ideal combination, it improves the clarity and removes any doubt. ConceptDraw DIAGRAM helps you easily create any kinds of diagrams and dynamic presentations too.

Map Infographic Maker

Take inspiration with ConceptDraw to visualise your maps and make eye-catching infographics.

Pictorial Chart

You want design Pictorial Chart or Infographic? And you need powerful infographic software? Then ConceptDraw DIAGRAM diagramming and vector drawing software extended with Pictorial Infographics Solution from the “Infographics” Area is exactly what you need.
HelpDesk

How To Create MS Visio Cross-Functional Flowchart

Cross-functional is a process involving several functional layers. Such processes typically cause the most problems, and therefore, is the most potential for improvement. Cross-functional business processes usually illustrate the processes of product development, commercial proposal development, the order execution process - everything, that involves several departments. The package of possible improvements - is the task of re-engineering. To illustrate the cross-functional processes often use cross-functional flowchart is often used to illustrate the cross-functional processes. ConceptDraw DIAGRAM allows you to easily create a cross-functional flowchart. Then, you can export it to MS Visio VSDX or VDX format and successfully share it with your colleagues still using MS Visio.

Typography Infographic Software

ConceptDraw DIAGRAM supplied with Typography Infographics Solution from the “Infographics” Area is a powerful typography infographic software that provides a set of useful typography infographics tools. Use the Typography Infographics Solution for ConceptDraw DIAGRAM typography infographic software to create your own professional looking Typography Infographics of any complexity quick, easy and effective, and then successfully use them in various fields.

Infographic Generator

ConceptDraw DIAGRAM extended with Typography Infographics Solution from the “Infographics” Area is the best Infographic Generator. Make sure in it right now! Typography Infographics Solution offers you the best numerous collection of predesigned infographics examples and 9 libraries with large quantity of ready-to-use vector stencils that will help you design your own Typography Infographics of any complexity in minutes..

How to Create an Infographic

How to Create an Infographic? It’s very easy! All what you need is a powerful infographic software. Never before creation of Infographics wasn’t so easy as now with Typography Infographics Solution from the “Infographics” Area for ConceptDraw Solution Park.

Table Seating Chart Template

The arrangement of tables and seating charts near them have great value in many premises and situations. It is often very convenient to draw a plan before the furniture arrangement. ConceptDraw DIAGRAM software offers the Seating Plans solution from the Building Plans area for fast and easy drawing the table seating chart template and samples.

energy icons, electrical power industry, industry icons, industry symbols, renewable energy industry, electrical substation diagram Energy Industry Infographics

energy icons, electrical power industry, industry icons, industry symbols, renewable energy industry, electrical substation diagram
Energy Industry Infographics solution is ideal for designing energy-related business infographics, diagrams, charts, illustrations for documents and presentations. It provides a set of libraries with special vector energy industry symbols, icons for electrical power industry, nuclear power industry, fossil fuel industry, and renewable energy industry, energy icons of fuel gas, liquid fuel, solid fuel, industry icons of electrical substations, power plants. Collection of samples including nuclear fuel cycle and energy distribution schematics, electrical substation diagram, energy intelligence dashboard, electricity grid schematics, and many more is also included. This solution is indispensable for all engineers, chefs, managers, marketers, and other professionals working in energy industry.

Infographic Tools

ConceptDraw DIAGRAM diagramming and vector drawing software offers the best infographic tools - Data-driven Infographics Solution from the “Infographics” Area of ConceptDraw Solution Park.

Typography Infographic Examples

ConceptDraw DIAGRAM extended with Typography Infographics Solution from the “Infographics” Area is a powerful infographic software that offers you variety of infographics examples. Use of predesigned examples as the base for your own Typography Infographics is a timesaving and useful way. Simply open the desired example, change for your needs and then successfully use it in any field of your activity.