Credit Card Order Process Flowchart. Flowchart Examples

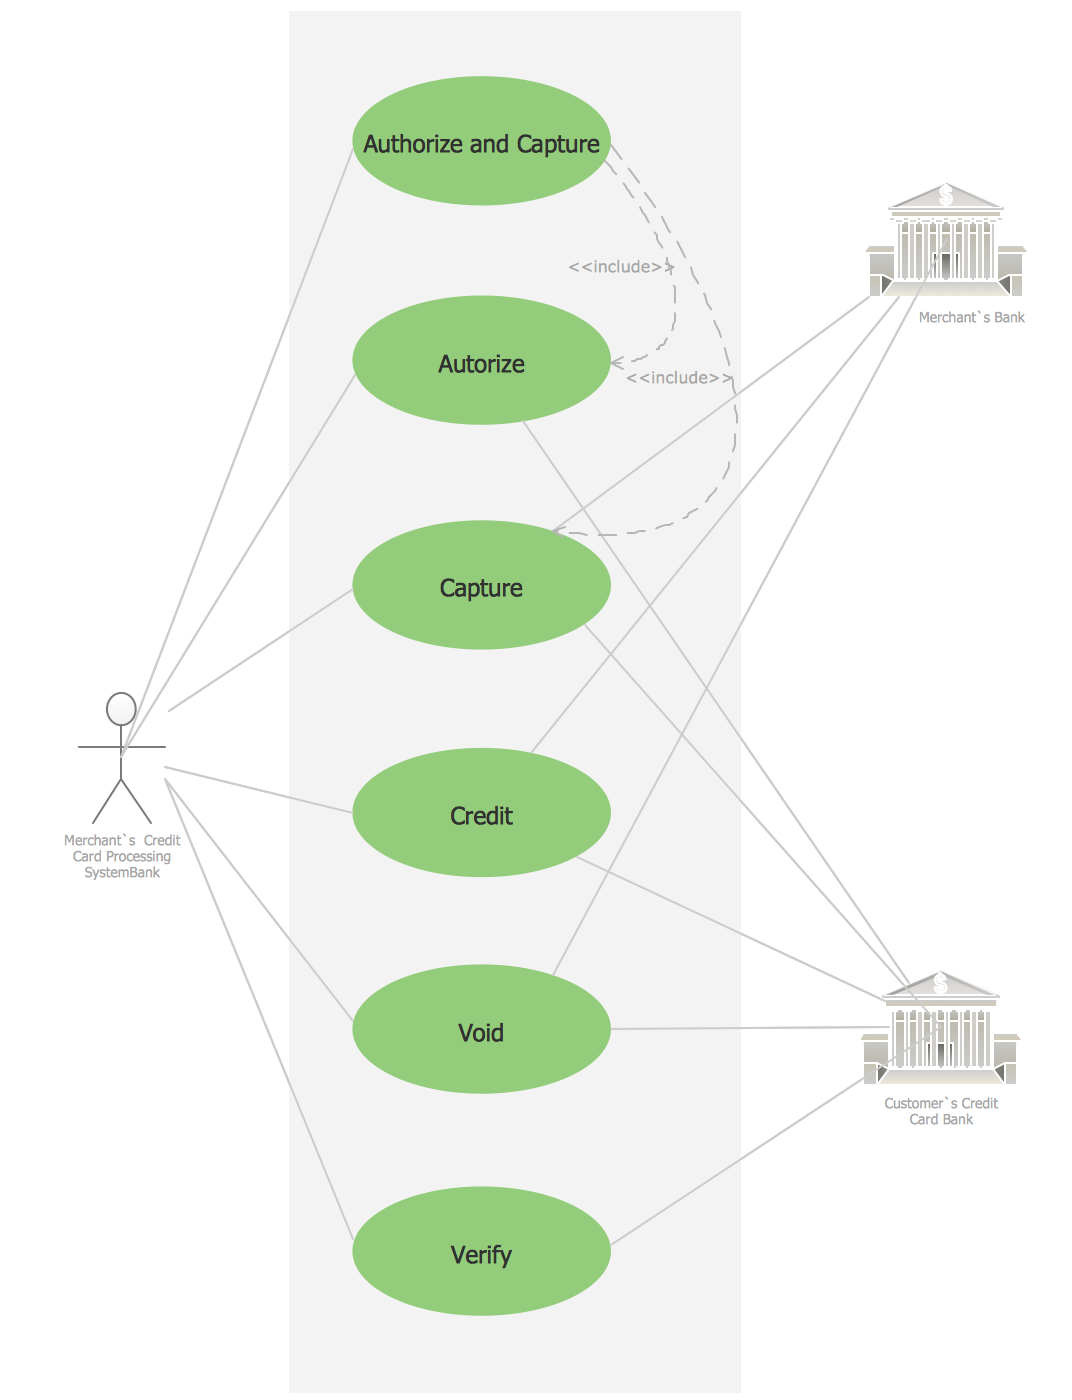
Credit Card Processing System UML Diagram
Work Order Process Flowchart. Business Process Mapping Examples

 Cross-Functional Flowcharts
Cross-functional flowcharts are powerful and useful tool for visualizing and analyzing complex business processes which requires involvement of multiple people, teams or even departments. They let clearly represent a sequence of the process steps, the order of operations, relationships between processes and responsible functional units (such as departments or positions).
 Audit Flowcharts
Audit flowcharts solution extends ConceptDraw DIAGRAM software with templates, samples and library of vector stencils for drawing the audit and fiscal flow charts.
 Flowcharts
The Flowcharts solution for ConceptDraw DIAGRAM is a comprehensive set of examples and samples in several varied color themes for professionals that need to represent graphically a process. Solution value is added by the basic flow chart template and shapes' libraries of flowchart notation. ConceptDraw DIAGRAM flow chart creator lets one depict the processes of any complexity and length, as well as design the Flowchart either vertically or horizontally.
 Accounting Flowcharts
Accounting Flowcharts solution extends ConceptDraw DIAGRAM software with templates, samples and library of vector stencils for drawing the accounting flow charts.
 PM Easy
PM Easy solution extends the ConceptDraw PROJECT functionality with an ability to support neutral methodology of project management and to quickly start a project by listing the task relationships and dependencies, that makes the iterative planning much easier. The project management tool and available visual tools, such as mind mapping, increase the effectiveness of tracking and analysis your project tasks. PM Easy solution from ConceptDraw Solution Park is mainly targeted at project managers in small or medium-sized companies, allowing them to make the project plan and execute projects using mind mapping technique, to implement planning using mind mapping, and to track tasks using ConceptDraw PROJECT application.
 Quality Mind Map
This solution extends ConceptDraw MINDMAP software with Quality Management Mind Maps (Presentations, Meeting Agendas, Problem to be solved).
 Area Charts
Area Charts are used to display the cumulative totals over time using numbers or percentages; or to show trends over time among related attributes. The Area Chart is effective when comparing two or more quantities. Each series of data is typically represented with a different color, the use of color transparency in an object’s transparency shows overlapped areas and smaller areas hidden behind larger areas.
- Flow Chart For Credit Application
- Credit Management Process Flow Chart
- Workflow Diagrams | Credit Card Order Process Flowchart ...
- Credit Card Order Process Flowchart. Flowchart Examples | Credit ...
- Process Flow For Credit Card Application
- UML Tool & UML Diagram Examples
- Credit Card Application Process Flow Diagram
- Flowcharts | Event-driven Process Chain Diagrams EPC | Value ...
- Accounting Flowcharts | Accounting Flowchart Symbols | Credit Card ...
- Credit Card Order Process Flowchart. Flowchart Examples ...
- Contoh Flowchart | Flow chart Example. Warehouse Flowchart ...
- Process Flowchart | Flow chart Example. Warehouse Flowchart ...
- Credit Card Order Process Flowchart. Flowchart Examples | Cross ...
- Credit Card Processing System UML Diagram | Processing Flow ...
- Credit Card Order Process Flowchart. Flowchart Examples | Credit ...
- Data Flow Diagram For Credit Card System
- Process Flowchart | Credit Card Processing System UML Diagram ...
- Euclidean algorithm - Flowchart | Basic Flowchart Symbols and ...
- Process Flow Chart Examples Powerpoint
- Basic Flowchart Symbols and Meaning | Credit Card Order Process ...