This cycle process chart was redesigned from the Wikimedia Commons file: Business Feedback Loop PNG version.png.
"A business ideally is continually seeking feedback from customers: are the products helpful? are their needs being met? Constructive criticism helps marketers adjust offerings to meet customer needs."
[commons.wikimedia.org/ wiki/ File:Business_ Feedback_ Loop_ PNG_ version.png]
The cycle process diagram example "Business feedback loop" was created using the ConceptDraw PRO diagramming and vector drawing software extended with the Sales Flowcharts solution from the Marketing area of ConceptDraw Solution Park.
Customers feedback cycle process chart

Process Flowchart


Flowchart design. Flowchart symbols, shapes, stencils and icons


What is the Accounting Cycle?

Steps of Accounting Cycle

This Water cycle diagram example was drawn using the ConceptDraw PRO diagramming and vector graphics software extended with the clipart libraries Geography and Weather.
"The water cycle, also known as the hydrologic cycle or the H2O cycle, describes the continuous movement of water on, above and below the surface of the Earth. The mass water on Earth remains fairly constant over time but the partitioning of the water into the major reservoirs of ice, fresh water, saline water and atmospheric water is variable depending on a wide range of climatic variables. The water moves from one reservoir to another, such as from river to ocean, or from the ocean to the atmosphere, by the physical processes of evaporation, condensation, precipitation, infiltration, runoff, and subsurface flow. In so doing, the water goes through different phases: liquid, solid (ice), and gas (vapor)." [Water cycle. Wikipedia]
This water cycle diagram example is included in the Nature solution from the Illustration area of ConceptDraw Solution Park.
Vector illustration

Sales Process Flowchart Symbols

Beauty in nature Illustrations and Clipart

BPR Diagram. Business Process Reengineering Example

This circle pie chart sample was created on the base of the figure illustrating the article "Impacts of Parking Strategies" from the Chicago Metropolitan Agency for Planning website. "Todd Litman's "Cycle of Automobile Dependency" shows how auto-centric land use planning and excessive parking supply have created this situation. Parking management strategies can be used to break this cycle, by changing development patterns and improving travel options (2006)." [cmap.illinois.gov/ about/ 2040/ supporting-materials/ process-archive/ strategy-papers/ parking/ impacts-of-parking-strategies]
The circle pie chart example "Cycle of automobile dependency" was created using the ConceptDraw PRO diagramming and vector drawing software extended with the Target and Circular Diagrams solution from the Marketing area of ConceptDraw Solution Park.
www.conceptdraw.com/ solution-park/ marketing-target-and-circular-diagrams
Circle pie chart

Draw Flowcharts with ConceptDraw

Basic Diagramming


"A Guide to the Project Management Body of Knowledge - Fifth Edition provides guidelines for managing individual projects and defines project management related concepts. It also describes the project management life cycle and its related processes, as well as the project life cycle.
The Guide recognizes 47 processes that fall into five basic process groups and ten knowledge areas that are typical of almost all projects.
The five process groups are:
Initiating,
Planning,
Executing,
Monitoring and Controlling,
Closing.
The ten knowledge areas are:
Project Integration Management,
Project Scope Management,
Project Time Management,
Project Cost Management,
Project Quality Management,
Project Human Resource Management,
Project Communications Management,
Project Risk Management,
Project Procurement Management,
Project Stakeholders Management (added in 5th edition).
Each of the ten knowledge areas contains the processes that need to be accomplished within its discipline in order to achieve an effective project management program. Each of these processes also falls into one of the five basic process groups, creating a matrix structure such that every process can be related to one knowledge area and one process group." [A Guide to the Project Management Body of Knowledge. Wikipedia]
The flow chart example "Project management life cycle" was created using the ConceptDraw PRO diagramming and vector drawing software extended with the Flowcharts solution from the area "What is a Diagram" of ConceptDraw Solution Park.
Flowchart - Project management life cycle

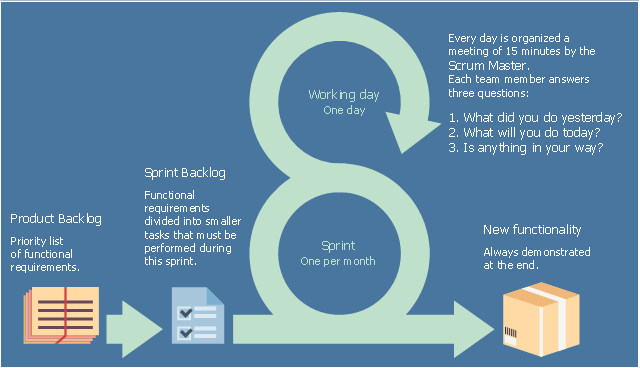
This agile software development infographic example was designed on the base of the Wikimedia Commons file: NL-scrum.jpg. [commons.wikimedia.org/ wiki/ File:NL-scrum.jpg]
"Sprint
A time period (typically 1–4 weeks) in which development occurs on a set of backlog items that the team has committed to — commonly referred to as a time-box or iteration" [Scrum (software development). Wikipedia]
The infographic sample "Scrum sprint cycle" was created using the ConceptDraw PRO software extended with the Scrum solution from the Project Management area of ConceptDraw Solution Park.
Infographic
Drawing a Nature Scene

- Hydrologic Cycle Png
- Geography - Vector stencils library | Water cycle diagram | Flat ...
- National Preparedness Cycle - Arrow ring chart | Circular diagrams ...
- Arrow Down Png
- Product life cycle process - Flowchart | Create Process Flowcharts ...
- Arrow Blue Png
- Exporting ConceptDraw PRO document to . PNG , .JPG, or other ...
- Life cycle of an ASAM standard | Education pictograms - Vector ...
- Arrow Icon Png
- Arrow Png
- Arrow Photoshop Png
- Product life cycle process - Flowchart | Use the Best FlowChart Tool ...
- Research cycle - Circle diagram | Lifecycle of an award - Circle ...
- Snow Png
- Moving Arrows Png
- Research cycle - Circle diagram | Offensive Play – Double Wing ...
- Process Flowchart | Biology | Biology Symbols | Draw 3 Program Cycle
- Rounded Arrow Png
- Innovation life cycle - Arrow loop diagram | BPR Diagram. Business ...
- Rotating Arrows Png