Gantt Chart Software
ConceptDraw PROJECT is a powerful Gantt Chart Software. The Gantt Charts are useful for displaying a large amount of detailed information, project tasks and timelines in a visually pleasing, easy-to-understand format. ConceptDraw PROJECT provides wide capabilities of importing and exporting in various formats: Microsoft Project, ConceptDraw MINDMAP, Mindjet MindManager, PDF file.Sample Project Flowchart. Flowchart Examples
This sample shows the Flowchart that displays the architecture of SQL Exception Translation. This sample was created in ConceptDraw PRO diagramming and vector drawing software using the Flowcharts solution from the What is a Diagram area of ConceptDraw Solution Park.
Pie Chart Software
A pie chart is a circular diagram showing a set of data divided into proportional slices. There are several variations of this chart such as donut chart, exploded pie chart, multi-level pie charts. Although it is not very informative when a ring chart or circle chart has many sections, so choosing a low number of data points is quite important for a useful pie chart. ConceptDraw PRO software with Pie Charts solution helps to create pie and donut charts for effective displaying proportions in statistics, business and mass media for composition comparison, i.e. for visualization of part percentage inside one total.Flowchart on Bank. Flowchart Examples
This sample was created in ConceptDraw PRO diagramming and vector drawing software using the Flowcharts solution from the What is a Diagram area of ConceptDraw Solution Park. This sample shows the Flowchart of the Subprime Mortgage Crisis. This Flowchart describes the decline in housing prices when the housing bubble burst and what it caused on the housing and financial markets. You can also see the Government and Industry responses in this crisis situation.
 School and Training Plans
Planning a school and its campus layout needs to depict the premises, represent internal spaces, location of windows and direction of natural light. Detailed classroom seating chart helps you visualize location of the blackboard and desks, taking into account the specifics of the room and its lighting, with a goal to design the classroom to be comfortable for each pupil and teacher.
Best Program to Make Flow Chart Diagrams
ConceptDraw the best business process modeling tool to make flow chart diagrams. Start creating your own flowchart with ConceptDraw PRO and accomplish great results in the moment. This is the best program to make flow chart diagrams that gives users the ability to simply draw any type of flowchart. The fast creating visualization for the structural data with the vector stencils from object libraries by using RapidDraw technology makes ConceptDraw PRO the first program in drawing flow data.Bar Diagram Math
ConceptDraw PRO extended with Divided Bar Diagrams solution from Graphs and Charts area of ConceptDraw Solution Park is the best software for quick and simple drawing the Divided Bar Diagrams and Bar Diagram Math.Draw Company Structure with Organization Charting Software
Draw Company Structure Diagram - get the detailed information about the company structure and hierarchy - who execute what tasks and who is in charge at this company. This information shows the reasoning and success of business and is indispensable for investors and financial institutions.
Chart Maker for Presentations
Easy charting software comes with beautiful chart templates and examples. This makes it easy to create professional charts without prior experience.Floor Plan
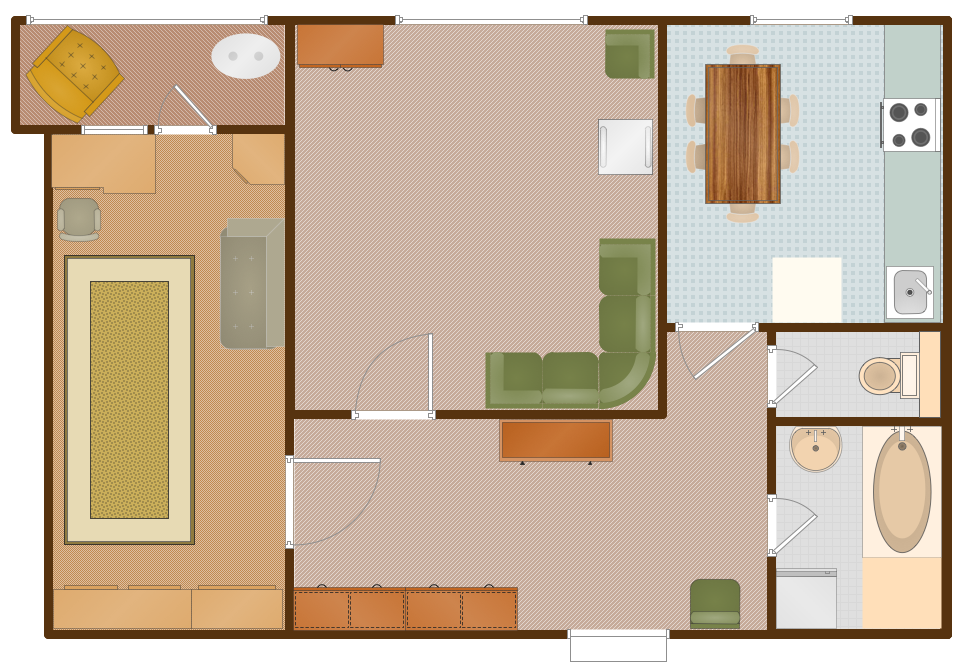
A Floor Plan is a scaled diagram that visualizes from above the room or relationships between several rooms or spaces at one level of a building, as well as some other physical features. ConceptDraw PRO diagramming and vector drawing software lets you save the time, because now you can fast design your floor plans for home, flat, office, classroom, or easy remodel without having to learn difficult architectural software. ConceptDraw PRO software with available Floor Plans solution from Building Plans area of ConceptDraw Solution Park is a rapid floor plan software for professional creating great-looking and detailed floor charts, floor plans, and also blueprints for home construction, facilities management, office space planning, office supply inventories, move management, assets inventories, and cubicles. We recommend to start with built-in templates and examples of ConceptDraw PRO software, which are offered at ConceptDraw Solution Browser. All that you need is to make required changes and additions, to find an expected result in a few minutes.
Workflow Diagram Examples
ConceptDraw PRO software extended with the Workflow Diagram solution provides a complete set of samples, templates and features help you to draw diagrams faster. A workflow diagram software you use for drawing workflow diagrams and business process flow diagrams should provide a wide set of examples allows you get closer with workflow diagrams, learn symbols meaning, find appropriate layout and design, and then start drawing your own workflow diagram masterfully. Workflow diagrams used for orchestrating organizational processes between company departments and humans, so critical process diagrams used to train many people to interact must be clear and professional to convey an idea from a view. Thats a reason we created a lot workflow symbols and workflow icons collected them into special Workflow Diagram solution in ConceptDraw Solution Park.
 Electric and Telecom Plans
This solution extends ConceptDraw PRO software with samples, templates and libraries of vector stencils for drawing the Electric and Telecom Plans.
Microsoft Azure
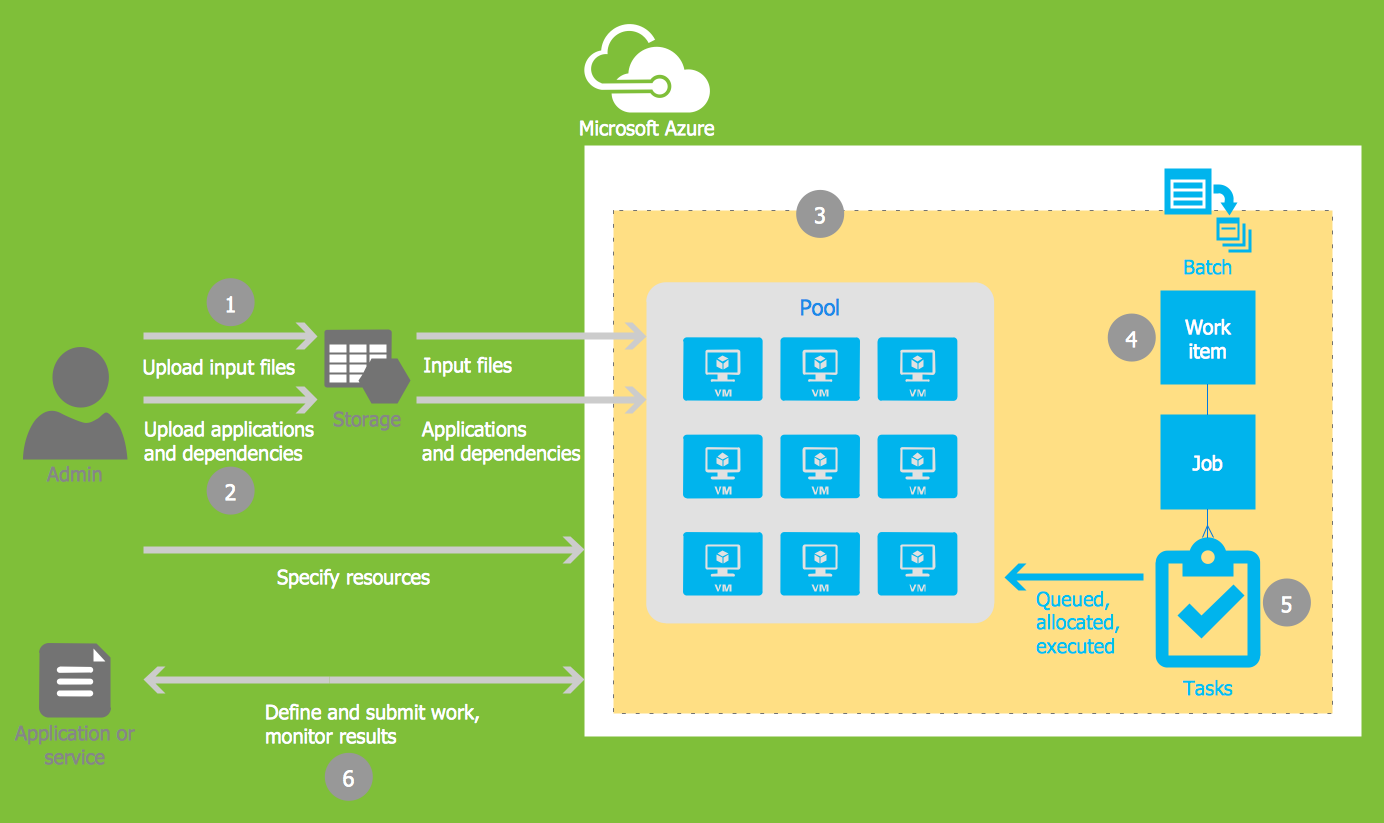
Microsoft Azure is widely used cloud platform which was created by Microsoft and now is managed by Microsoft datacenters in 19 regions of the world, and has a wide set of benefits and features. ConceptDraw PRO diagramming and vector drawing software extended with Azure Architecture Solution from the Computer and Networks area of ConceptDraw Solution Park is the best for designing various pictorial infographics, illustrations and materials showing the possibilities and work of Microsoft Azure Cloud System and Azure services.
 Reflected Ceiling Plans
Reflected Ceiling Plans solution is effective tool for architects, designers, electricians, and other people which every day need convenient tool for representing their ceiling ideas. Use it to create without efforts professional Reflected Ceiling plans and Reflective Ceiling plans, showing the location of light fixtures, drywall or t-bar ceiling patterns, lighting panels, and HVAC grilles and diffusers that may be suspended from the ceiling.
Horizontal Orgchart
The Organizational Chart is a diagram that shows the structure of the organization and the relationships of its parts. There are many ways to present the Organizational Chart. One of them is the Horizontal Organizational Chart: the parts of the diagram are arranged from left to right, or from right to left. This sample was created in ConceptDraw PRO diagramming and vector drawing software using the Organizational Charts Solution from the Management area of ConceptDraw Solution Park.- Data Flow Diagrams | Audit Flowcharts | Flowcharts | Flow Chart ...
- UML Class Diagram Example - Social Networking Site | School and ...
- Data Flow Diagrams (DFD) | Entity-Relationship Diagram (ERD ...
- ConceptDraw PRO DFD Software | Data Flow Diagrams | How to ...
- Entity-Relationship Diagram (ERD) | Data Flow Diagrams ...
- ConceptDraw Solution Park | Data Flow Diagrams (DFD) | Software ...
- Data Flow Diagrams (DFD) | School and Training Plans | CAD ...
- System Flow Diagram For Sports School
- Data Flow Diagrams (DFD) | School and Training Plans | Business ...
- Student Teacher Dfd
- Teacher Student Dfd
- Data Flow Diagrams (DFD) | Microsoft Azure | ConceptDraw ...
- Context Diagram Template | DFD Library System | Data Flow ...
- Training classroom | Human Resource Management | Human ...
- ConceptDraw Solution Park | Microsoft Azure | Data Flow Diagrams ...
- Flow Chart Creator | Classroom Seating Chart Maker | Top 5 ...
- Er Diagram On Class Room Class Student Teacher
- Bubble Chart Maker | Classroom Seating Chart Maker | Top 5 ...
- Data Flow Diagrams (DFD) | Microsoft Azure | School and Training ...
- Dfd Diagram Of A Bank Institution


