Taxi Service Data Flow Diagram DFD Example
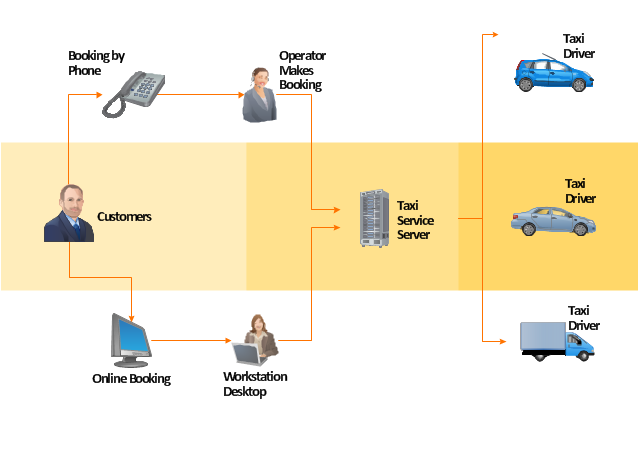
This sample shows the Data Flow Diagram of the Taxi Service and interactions between the Clients, Operators and Divers, as well as Orders and Reports databases.UML Use Case Diagram Example - Taxi Service
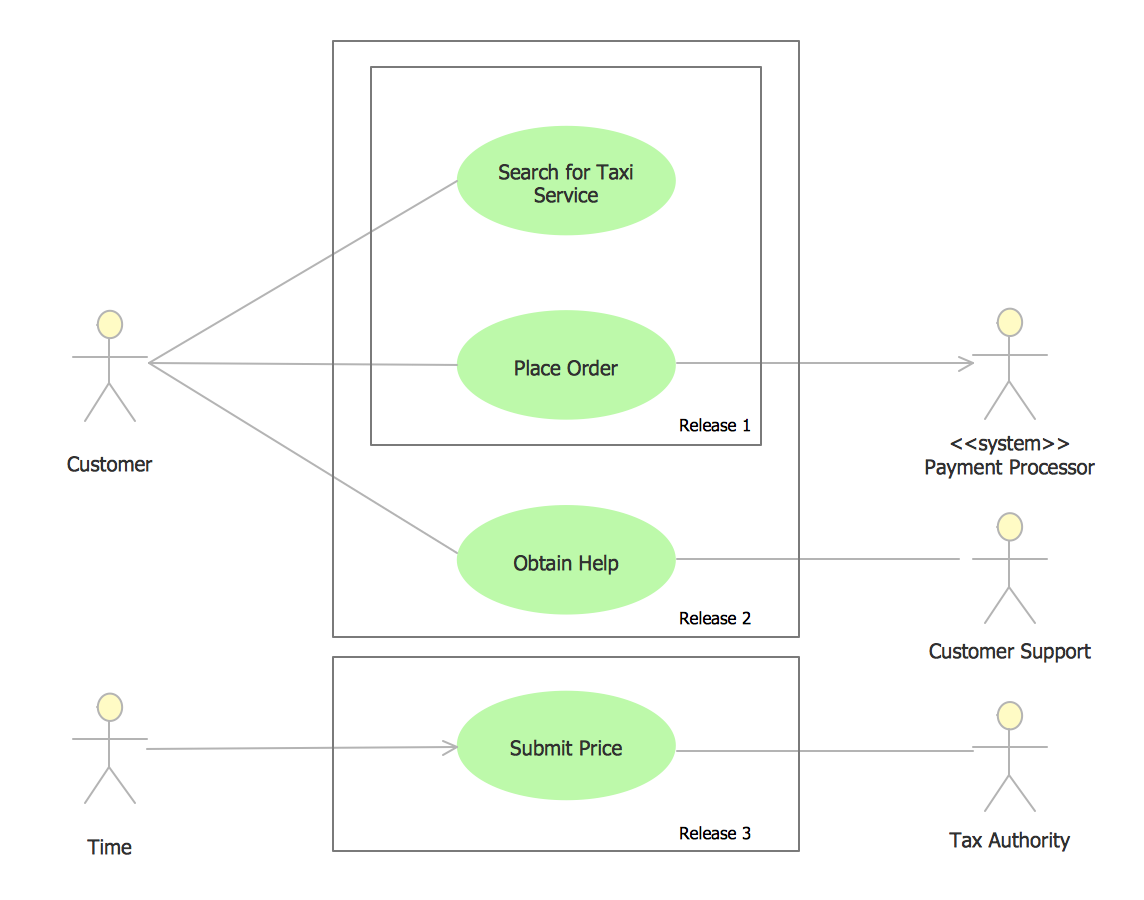
UML Use Case Diagram Taxi Service - This sample was created in ConceptDraw DIAGRAM diagramming and vector drawing software using the UML Use Case Diagram library of the Rapid UML Solution from the Software Development area of ConceptDraw Solution Park. This sample shows the work of the taxi service and is used by taxi stations, by airports, in the tourism field and delivery service.Example of DFD for Online Store (Data Flow Diagram)
Data Flow Diagram (DFD) is a methodology of graphical structural analysis and information systems design, which describes the sources external in respect to the system, recipients of data, logical functions, data flows and data stores that are accessed. DFDs allow to identify relationships between various system's components and are effectively used in business analysis and information systems analysis. They are useful for system’s high-level details modeling, to show how the input data are transformed to output results via the sequence of functional transformations. For description of DFD diagrams are uses two notations — Yourdon and Gane-Sarson, which differ in syntax. Online Store DFD example illustrates the Data Flow Diagram for online store, the interactions between Customers, Visitors, Sellers, depicts User databases and the flows of Website Information. ConceptDraw DIAGRAM enhanced with Data Flow Diagrams solution lets you to draw clear and simple example of DFD for Online Store using special libraries of predesigned DFD symbols.
"A taxicab, also known as a taxi or a cab, is a type of vehicle for hire with a driver, used by a single passenger or small group of passengers often for a non-shared ride. A taxicab conveys passengers between locations of their choice. In modes of public transport, the pick-up and drop-off locations are determined by the service provider, not by the passenger, although demand responsive transport and share taxis provide a hybrid bus/ taxi mode.
There are four distinct forms of taxicab, which can be identified by slightly differing terms in different countries:
(1) Hackney carriages also known as public hire, hailed or street taxis, licensed for hailing throughout communities.
(2) Private hire vehicles, also known as minicabs or private hire taxis, licensed for pre-booking only.
(3) Taxibuses, also known as Jitneys, operating on pre-set routes typified by multiple stops and multiple independent passengers.
(4) Limousines, specialized vehicle licensed for operation by pre-booking.
Although types of vehicles and methods of regulation, hiring, dispatching, and negotiating payment differ significantly from country to country, many common characteristics exist." [Taxicab. Wikipedia]
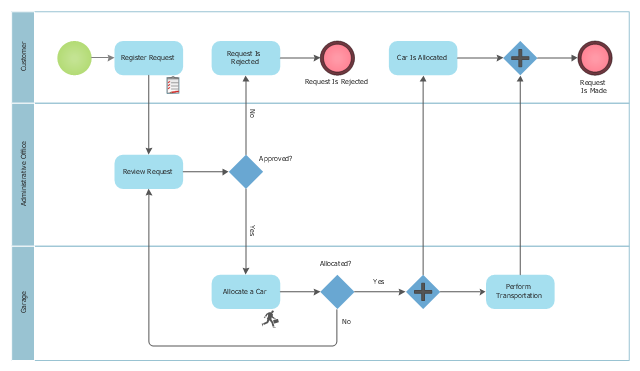
The example "Workflow diagram - Taxi service" was drawn using the ConceptDraw PRO diagramming and vector drawing software extended with the Workflow Diagrams solution from the Business Processes area of ConceptDraw Solution Park.
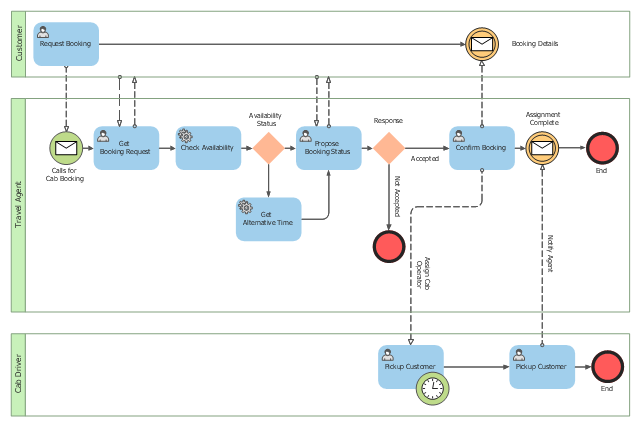
This BPMN (Business Process Model and Notation) collaboration diagram sample depicts interactions between customer, travel agent and cab driver, which are defined as a sequence of activities, and represent the message exchange during a cab booking process.
"Business process modeling is used to communicate a wide variety of information to a wide variety of audiences. BPMN is designed to cover this wide range of usage and allows modeling of end-to-end business processes to allow the viewer of the Diagram to be able to easily differentiate between sections of a BPMN Diagram. There are three basic types of sub-models within an end-to-end BPMN model: Private (internal) business processes, Abstract (public) processes, and Collaboration (global) processes...
Collaboration (global) processes.
A collaboration process depicts the interactions between two or more business entities. These interactions are defined as a sequence of activities that represent the message exchange patterns between the entities involved. Collaboration processes may be contained within a Pool and the different participant business interactions are shown as Lanes within the Pool. In this situation, each Lane would represent two participants and a direction of travel between them. They may also be shown as two or more Abstract Processes interacting through Message Flow. These processes can be modeled separately or within a larger BPMN Diagram to show the Associations between the collaboration process activities and other entities. If the collaboration process is in the same Diagram as one of its corresponding private business process, then the activities that are common to both processes can be associated." [Business Process Model and Notation. Wikipedia]
The business process modeling diagram example "Cab booking public process - Collaboration BPMN 2.0 diagram" was designed using the ConceptDraw PRO diagramming and vector drawing software extended with the Business Process Diagram solution from the Business Processes area of ConceptDraw Solution Park.
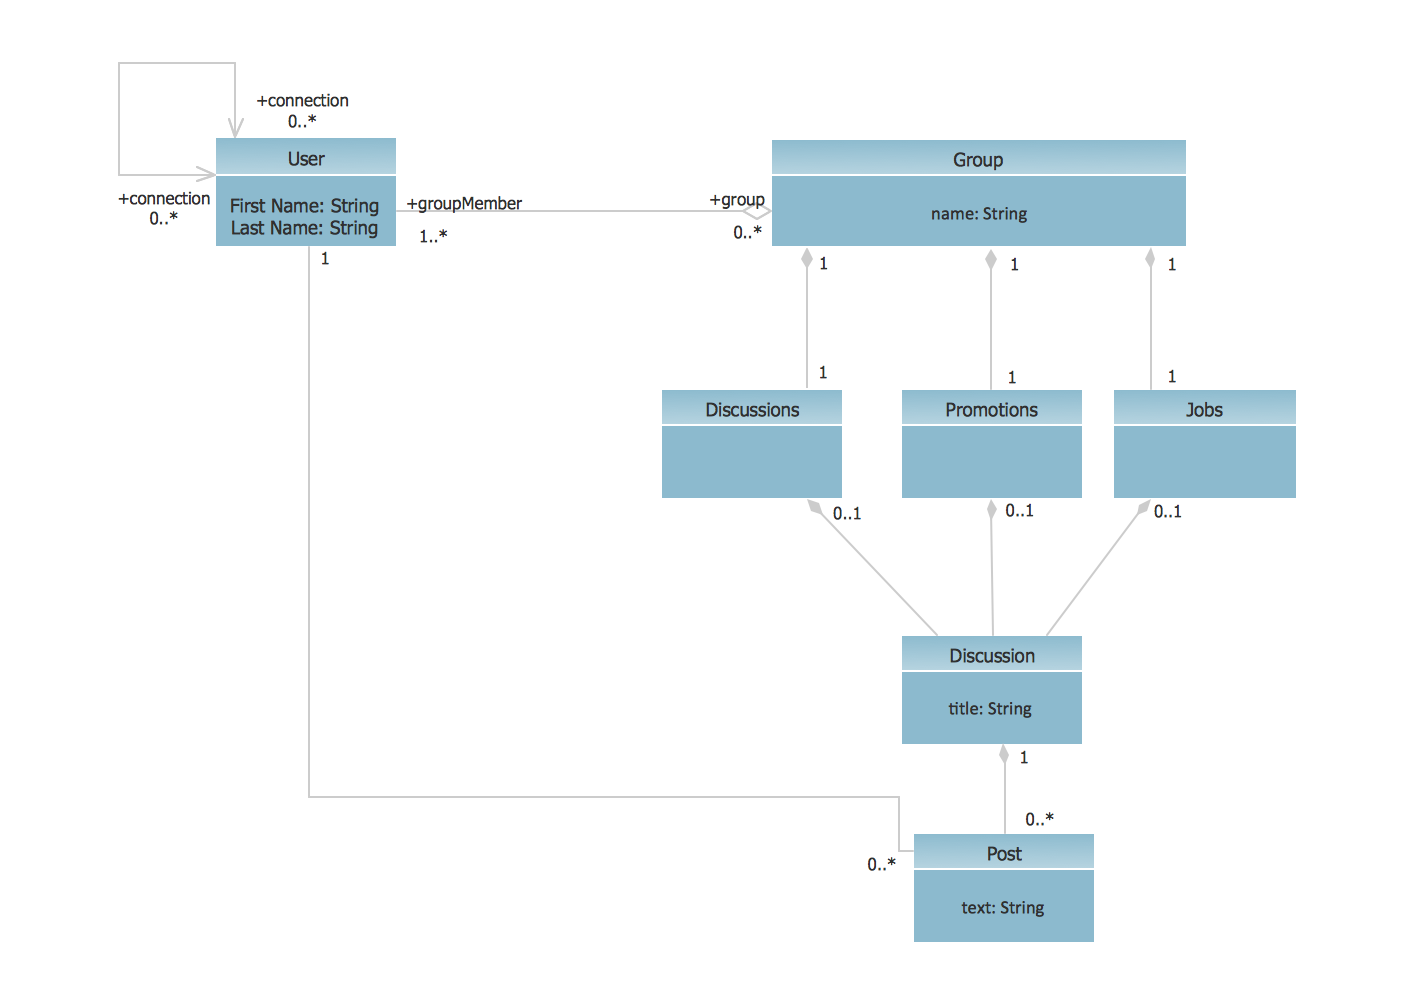
Social Media UML
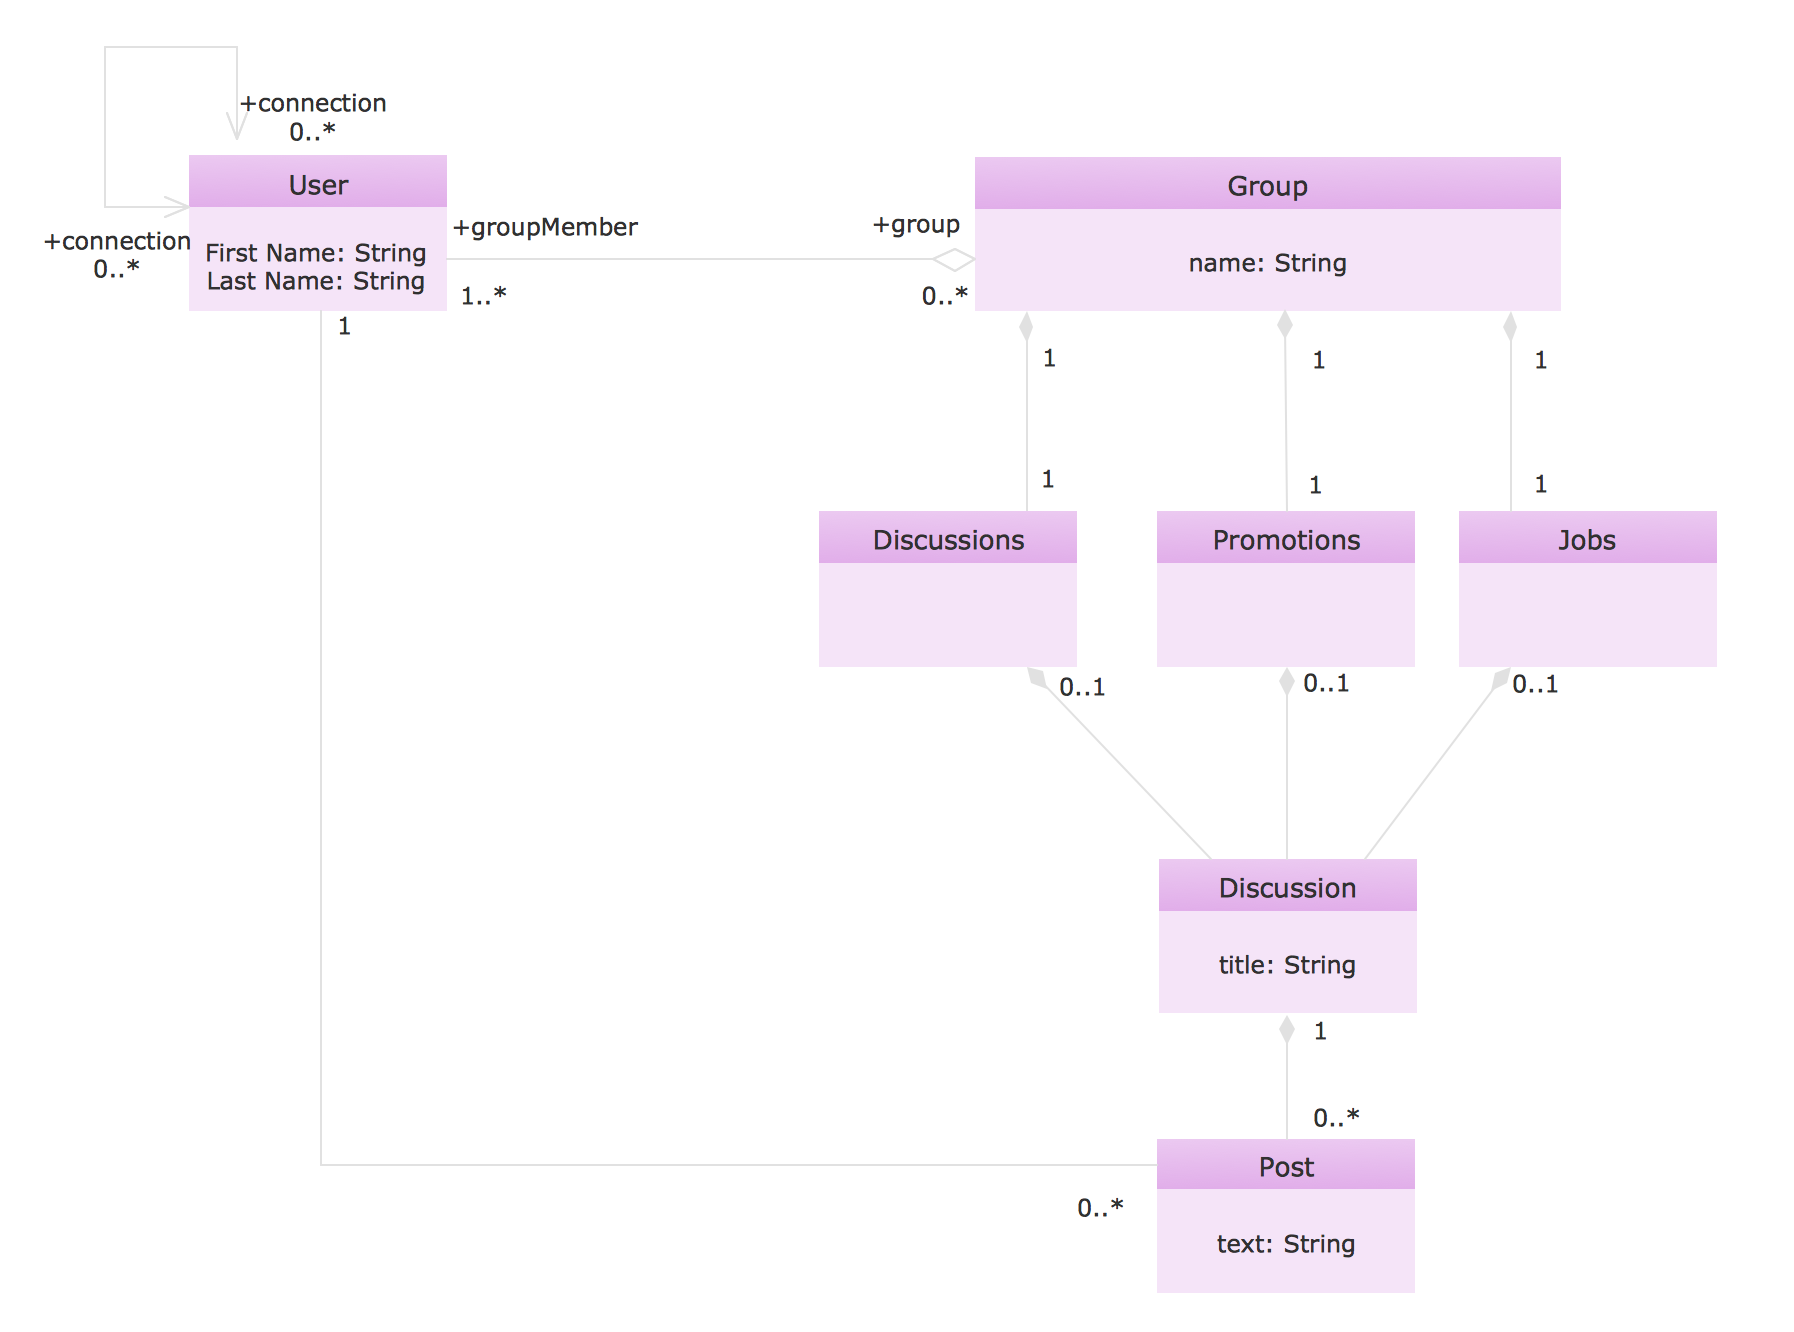
Social Media UML - This sample shows the structure of the popular social networking site Linkedin. This is a Class Diagram on that classes are represented as boxes and are connected with aggregation, composition associations. This sample can be used in the business field, in IT, at the projection and creating of the social networking sites.
 Business Process Diagrams
Business Process Diagrams solution extends the ConceptDraw DIAGRAM BPM software with RapidDraw interface, templates, samples and numerous libraries based on the BPMN 1.2 and BPMN 2.0 standards, which give you the possibility to visualize equally easy simple and complex processes, to design business models, to quickly develop and document in details any business processes on the stages of project’s planning and implementation.
Process Flowchart
The main reason of using Process Flowchart or PFD is to show relations between major parts of the system. Process Flowcharts are used in process engineering and chemical industry where there is a requirement of depicting relationships between major components only and not include minor parts. Process Flowcharts for single unit or multiple units differ in their structure and implementation. ConceptDraw DIAGRAM is Professional business process mapping software for making Process flowcharts, Process flow diagram, Workflow diagram, flowcharts and technical illustrations for business documents and also comprehensive visio for mac application. Easier define and document basic work and data flows, financial, production and quality management processes to increase efficiency of your business with ConcepDraw DIAGRAM. Business process mapping software with Flowchart Maker ConceptDraw DIAGRAM includes extensive drawing tools, rich examples and templates, process flowchart symbols and shape libraries, smart connectors that allow you create the flowcharts of complex processes, process flow diagrams, procedures and information exchange. Process Flowchart Solution is project management workflow tools which is part ConceptDraw Project marketing project management software. Drawing charts, diagrams, and network layouts has long been the monopoly of Microsoft Visio, making Mac users to struggle when needing such visio alternative like visio for mac, it requires only to view features, make a minor edit to, or print a diagram or chart. Thankfully to MS Visio alternative like ConceptDraw DIAGRAM software, this is cross-platform charting and business process management tool, now visio alternative for making sort of visio diagram is not a problem anymore however many people still name it business process visio tools.
Concept Map
A concept map is a way of representing relationships between ideas, images, or words. How to draw a Concept Map quick, easy and effective? ConceptDraw DIAGRAM offers the unique Concept Maps Solution from the "Diagrams" Area that will help you!Basic Flowchart Symbols and Meaning
Flowcharts are the best for visually representation the business processes and the flow of a custom-order process through various departments within an organization. ConceptDraw DIAGRAM diagramming and vector drawing software extended with Flowcharts solution offers the full set of predesigned basic flowchart symbols which are gathered at two libraries: Flowchart and Flowcharts Rapid Draw. Among them are: process, terminator, decision, data, document, display, manual loop, and many other specific symbols. The meaning for each symbol offered by ConceptDraw gives the presentation about their proposed use in professional Flowcharts for business and technical processes, software algorithms, well-developed structures of web sites, Workflow diagrams, Process flow diagram and correlation in developing on-line instructional projects or business process system. Use of ready flow chart symbols in diagrams is incredibly useful - you need simply drag desired from the libraries to your document and arrange them in required order. There are a few serious alternatives to Visio for Mac, one of them is ConceptDraw DIAGRAM. It is one of the main contender with the most similar features and capabilities.
Activity Network (PERT) Chart
Activity Network and Project Evaluation and Review Technique, or PERT, charts are a way of documenting and analyzing the tasks in a project. This diagram is constructed as part of the process in creating a schedule of corrective actions. The Activity Network Chart (PERT) shows the logical connections and consequence of tasks to be performed. It displays the time period for problem solving and the implementation of all activities through the critical path.ConceptDraw Arrows10 Technology
Connecting objects manually in ConceptDraw DIAGRAM is a snap: - points; - Connecting groups of objects; - Auto-routing; - Connectors text; - Snap to Guides ; - Quick.How to Present Workflow to Team
To pull a social media team together, to set your objectives, to develope an integrated communications strategy. This is excellent business process improvement tools of social media activity.UML Class Diagram Example - Social Networking Site
UML Diagrams Social Networking Sites Project. This sample was created in ConceptDraw DIAGRAM diagramming and vector drawing software using the UML Class Diagram library of the Rapid UML Solution from the Software Development area of ConceptDraw Solution Park. This sample shows the structure of the popular social networking site Linkedin and is used in the business field, in IT, at the projection and creating of the social networking sites.This BPMN (Business Process Model and Notation) diagram sample shows the taxi order process workflow.
"Business process modeling (BPM) in systems engineering is the activity of representing processes of an enterprise, so that the current process may be analyzed and improved. BPM is typically performed by business analysts and managers who are seeking to improve process efficiency and quality. The process improvements identified by BPM may or may not require information technology involvement, although that is a common driver for the need to model a business process, by creating a process master. Business process modeling results in the improvement of the way tasks performed by the business. They can pick up errors or cons about the way processes are currently being performed and model an improved way of carrying out these processes." [Business process modeling. Wikipedia]
The business process modeling diagram example "Taxi order process - BPMN 1.2 diagram" was created using the ConceptDraw PRO diagramming and vector drawing software extended with the Business Process Diagram solution from the Business Processes area of ConceptDraw Solution Park.
 Funnel Diagrams
Funnel Diagrams solution including wide range of funnel diagram samples, sales funnel examples, and vector design elements, makes the ConceptDraw DIAGRAM ideal for funnel management and creation the Funnel Diagrams of different types and designs, AIDA Model, AIDAS, ACCA Dagmar, Rossiter-Percy Model, Sales funnel, Marketing funnel, Search funnel, Brand funnel, Purchase funnel, Lead funnel, Conversion funnel, Business funnel, etc. You are free to choose to place your funnel object horizontally or vertically, you can use the objects with desired quantity of sales funnel stages, as well as to modify their size, color filling, and other parameters to make exceptionally looking Funnel diagrams fully responding to your desires.
Org Chart Diagram
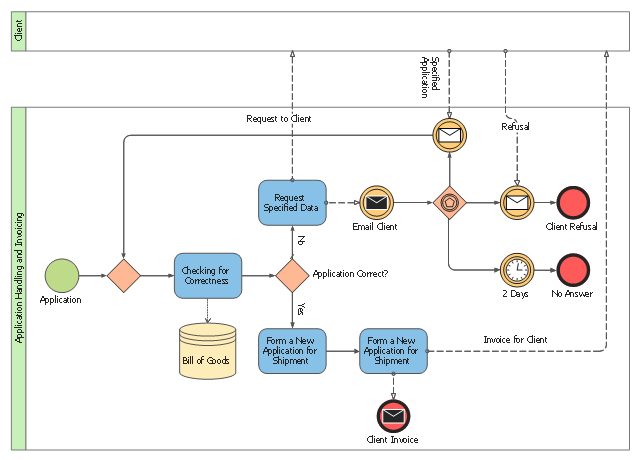
ConceptDraw Office products and PM solutions included to ConceptDraw Solution Park support many project methodologies, among them Agile and Simple Projects, which help in implementing the best practices in project management. ConceptDraw Office applications give effective support in solving the issues related with planning, tracking, events, milestones, resource usage, and many other project management functions. ConceptDraw MINDMAP software provides the great advantages of a Mind Map hierarchical tree structure during the process of development the organizational structure of an organization. When you need to make the Organizational Chart, you can use any ConceptDraw DIAGRAM or ConceptDraw MINDMAP software. If you already have a designed Mind Map, it is incredibly easy to generate an Organizational Chart directly from ConceptDraw MINDMAP. You need simply double-click the corresponding icon, all the rest will be made automatically. The Organizational Chart will be created from the active page of your map, outputted to ConceptDraw DIAGRAM and opened in Slideshow mode.This BPMN (Business Process Model and Notation) collaboration diagram sample contains the collection of participants and their interaction throughout an application handling and invoicing process.
"An invoice, bill or tab is a commercial document issued by a seller to a buyer, relating to a sale transaction and indicating the products, quantities, and agreed prices for products or services the seller has provided the buyer.
Payment terms are usually stated on the invoice. These may specify that the buyer has a maximum number of days in which to pay, and is sometimes offered a discount if paid before the due date. The buyer could have already paid for the products or services listed on the invoice.
In the rental industry, an invoice must include a specific reference to the duration of the time being billed, so in addition to quantity, price and discount the invoicing amount is also based on duration. Generally each line of a rental invoice will refer to the actual hours, days, weeks, months, etc., being billed.
From the point of view of a seller, an invoice is a sales invoice. From the point of view of a buyer, an invoice is a purchase invoice. The document indicates the buyer and seller, but the term invoice indicates money is owed or owing." [Invoice. Wikipedia]
The business process modeling diagram example "Application handling and invoicing - Collaboration BPMN 2.0 diagram" was designed using the ConceptDraw PRO diagramming and vector drawing software extended with the Business Process Diagram solution from the Business Processes area of ConceptDraw Solution Park.
Basic Diagramming
Block diagrams are essentially a very simple format of diagrams. A variety of commonly used shapes and connecting lines, rules of construction and actions pertaining to them, make Block diagram a versatile and flexible tool for many forms of industry. Another advantage is the ease with which Block diagrams can be constructed, especially if you use professional diagramming software. ConceptDraw DIAGRAM software is an example of purpose built application designed with the form of process modeling in mind. It includes Block Diagrams solution from Diagrams area of ConceptDraw Solution Park for easy drawing professional-looking simple diagram - Block diagram, and a lot of other useful solutions for designing variety of other types of diagrams, schematics and flowcharts (Line graphs, Bar charts, Organizational charts, Histograms, Pie charts, Process flowcharts, Fault tree analysis diagrams, Scatter plots, Venn diagrams, Bubble diagrams, etc.). The RapidDraw functionality of ConceptDraw DIAGRAM lets create new objects and their connectors in just single-click.
- Taxi Service Data Flow Diagram DFD Example | Types of Flowchart ...
- Taxi Service Data Flow Diagram DFD Example | Process Flowchart ...
- Process Flowchart | Taxi Service Data Flow Diagram DFD Example ...
- Process Flowchart | | Er Diagram For Cab Service
- Taxi Service Data Flow Diagram DFD Example | Social Media ...
- Taxi service - Workflow diagram | Workflow Process Example | Taxi ...
- Taxi Service Data Flow Diagram DFD Example | Sales Process ...
- Taxi Service Data Flow Diagram DFD Example | Property ...
- E-R Diagrams | Business Process Modeling Notation Template ...
- Taxi service - Workflow diagram | Flow Chat On Cab Online Service
- Taxi Service Data Flow Diagram DFD Example | Taxi service ...
- Taxi Service Data Flow Diagram DFD Example | Gantt Chart ...
- Creating a Simple Flowchart | Taxi Service Data Flow Diagram DFD ...
- Data Flow Diagram Of Online Cab Booking
- Taxi Service Data Flow Diagram DFD Example | DFD Library ...
- Taxi Service Data Flow Diagram DFD Example | Workflow Process ...
- UML Use Case Diagram Example - Taxi Service | UML Block ...
- Dfd Daigram Upto 2 Level For User Of Cab Application
- Taxi Service Er Diagram

