HelpDesk
How to Create Infographics that Help People Eat Healthy
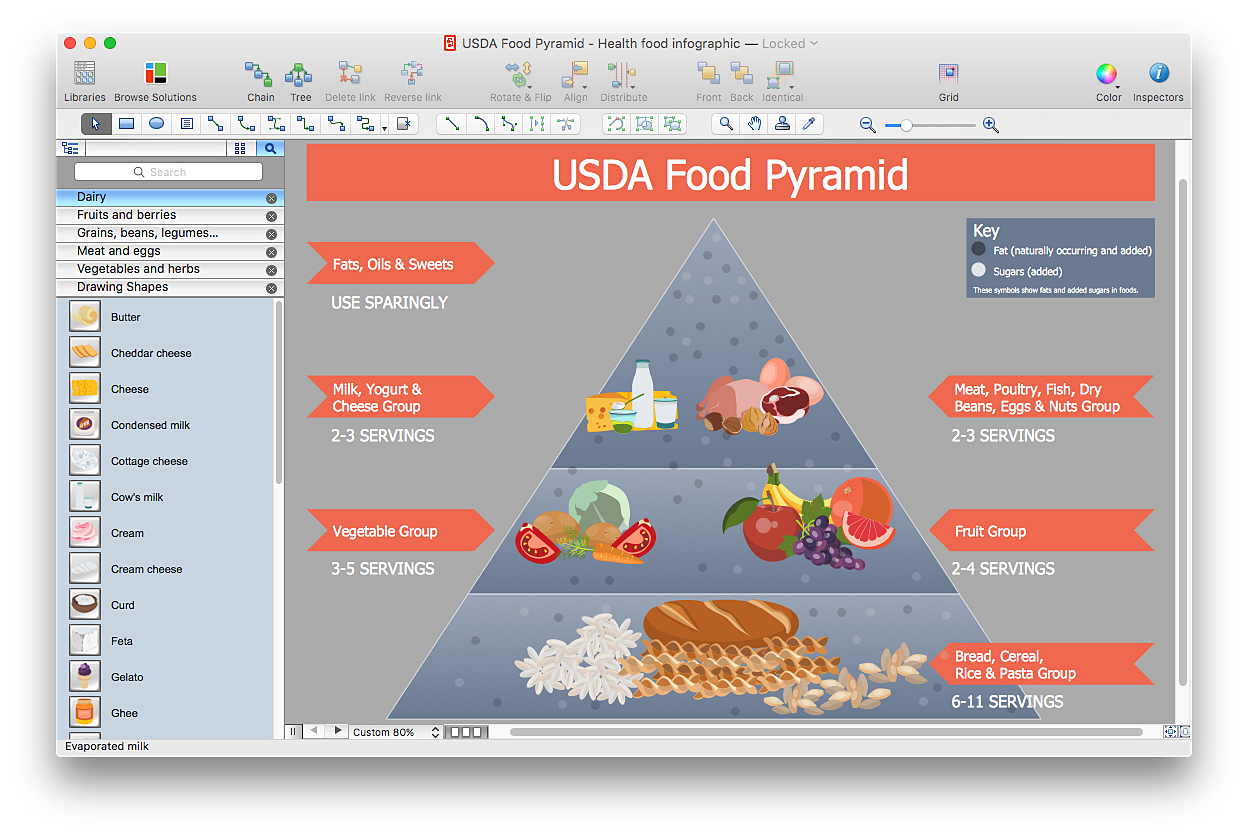
The most effective manner of presenting information on healthy diet and food nutrition is using various visualizations such as charts or infographics. To help easily create infographics and diagrams of healthy eating, ConceptDraw has provided the Health Food solution to its Solution Park. It contains vector stencil libraries of healthy eating options, samples of diagrams and infographics, and a set of templates to help you create your own diagrams, infographics and even adds. Using ConceptDraw PRO you can easily create and share healthy food recipes and materials about the proper nutrition.
 Computer and Networks Area
The solutions from Computer and Networks Area of ConceptDraw Solution Park collect samples, templates and vector stencils libraries for drawing computer and network diagrams, schemes and technical drawings.
 Football
The Football Solution extends ConceptDraw PRO v9.5 (or later) software with samples, templates, and libraries of vector objects for drawing football (American) diagrams, plays schemas, and illustrations. It can be used to make professional looking documen
 Management Area
The solutions from Management area of ConceptDraw Solution Park collect templates, samples and libraries of vector stencils for drawing the management diagrams and mind maps.
 Marketing Area
The solutions from Marketing area of ConceptDraw Solution Park collect templates, samples and libraries of vector stencils for drawing the marketing diagrams and mind maps.
 Cafe and Restaurant Floor Plans
Restaurants and cafes are popular places for recreation, relaxation, and are the scene for many impressions and memories, so their construction and design requires special attention. Restaurants must to be projected and constructed to be comfortable and e
 Bar Graphs
The Bar Graphs solution enhances ConceptDraw PRO v10 functionality with templates, numerous professional-looking samples, and a library of vector stencils for drawing different types of Bar Graphs, such as Simple Bar Graph, Double Bar Graph, Divided Bar Graph, Horizontal Bar Graph, Vertical Bar Graph, and Column Bar Chart.
- Make The Diagram Of The Pyramid Of Development And Label It
- Pyramid Models Label
- Diagram Of Pyramid Of Development With Label
- Diagram Which Shows Three Management Levels With Its Labels
- 4 Level pyramid model diagram - Information systems types | 5 Level ...
- Draw And Label The Diagram Of Information Process
- Pyramid Diagram and Pyramid Chart | 4 Level pyramid model ...
- Layers Of Pyramidal Structure Of Mis
- Diagram Of The Pyramid Of Development
- Design A Diagram Of Window With Proper Label
- Full Label Diagram Of A Flow Char
- Process Flowchart | Pyramid Diagram | ERD Symbols and Meanings ...
- Tree Network Topology Diagram | Multiprotocol Label Switching ...
- Model Of A Football Field With Label
- Process Flowchart | Pyramid Diagram | Pyramid Diagram | Use A ...
- Diagram Of Pyramid Of Development
- Pyramid Diagram | Pyramid Charts | Pyramid Diagram | Draw And ...
- Pyramid Diagram | Pyramid Diagram | Process Flowchart | Chart Of ...
- I Need An Atm Machine Diagram And Label
